


1. Introduction
The Shanghai Composite Index is the oldest of the major indexes in the A-share market in China. Different from other major stock market indexes, Shanghai Composite index is a comprehensive index, that is, it considers as many securities listed on Shanghai Composite Index as possible to be included in the index scope, so the biggest feature of Shanghai Composite Index is comprehensive, the study of Shanghai Stock Index is of great significance to China's stock market.
Prediction of stock prices is a classic problem. The love affair with stock investing has never waned over time. People try to profit from the stock market by predicting share prices. If stocks can predict effectively, then people will be able to earn high returns in the capital market. In addition, from an academic point of view, the predictability of stocks contributes to the study of the efficiency of the capital market and helps scholars to realize a more realistic capital model. So, the issue of stock forecasting is very important. But the price of a stock is subject to so many uncertainties that it is difficult for investors to make effective predictions about the stock.
Previous researchers mostly used a single machine learning model to forecast the stock price, including nonlinear time series model [1,2], artificial neural network [3-5], decision tree [6,7], genetic algorithm [8,9], Markov model [10], support vector set [11-13], etc. However, previous investigations seem still limited. Thus, this paper selects the historical data of Shanghai Composite Index from 1991 to 2016 and use ARIMA and LSTM models to forecast the data of the Shanghai Composite Index.
2. Methodology
This paper mainly uses ARIMA and LSTM to forecast the closing price of Shanghai Composite Index (1991-2016). This chapter mainly introduces these two methods, which predict the closing price from 2014 to 2016 respectively. The rmse is calculated from the predicted value and the real value. Then, this paper select a model with better predictions by comparing the result of the rmse of the two models.
2.1. ARIMA
ARIMA is a statistical forecasting method and a time series forecasting method. It builds the model through the combination of white noise and ensures that the residual difference between the model and the actual data is also a normal distribution with a small mean. This method is based on the assumption that the data are stationary and time-dependent and also change linearly.
Firstly, by building an ARIMA model, time series should be made stationarily. The parameter d should also be determined. The stability of the sequence is observed by drawing the sequence or performing ADF test. And then differentiate it. Difference means subtracting the previous value from the last value. The parameter d is determined by the minimum figure of differencing needed to make the series stationary.
The parameter p of the autoregressive model indicates that predicting the current value is to use the historical value in several periods. And in an autoregressive model, if it is not a white noise sequence, it is usually considered as a q order moving average. Next, comparing autocorrelations and partial autocorrelations and determine the order of regression (p) and order of moving average (q).
Then, this paper can build the model according to p, q and d and select the model with the smallest AIC and BIC.
2.2. LSTM
LSTM is a machine learning algorithm based on deep learning. Stock data is a set of time series in which samples are correlated with each other in sequential order and predictions are made based on the correlation. LSTM improves the linearity, meets the nonlinear condition well, and can solve the problems of length dependence and gradient disappearance better than the general RNN.
The transmission form of A recurrent neural network RNN is that X serves as the input layer and generates input h and a signal after processing by neuron A. This signal will be input to A together with X as the next input, and repeat. Where, the generated signal can be the same or different from h. Think of the signals that neurons produce for the next round of input as experiences. The output of neurons depends not only on X, but also on experience. This experience is also seen as an association between sequence samples.
Long-term memory network is a kind of RNN, which is mainly composed of forgetting gate, input gate, updating neuron state gate and output gate. It is compared to a traditional recurrent neural network, where C represents the state of the node, where C and h are passed down as experience during learning (See Figure 1).
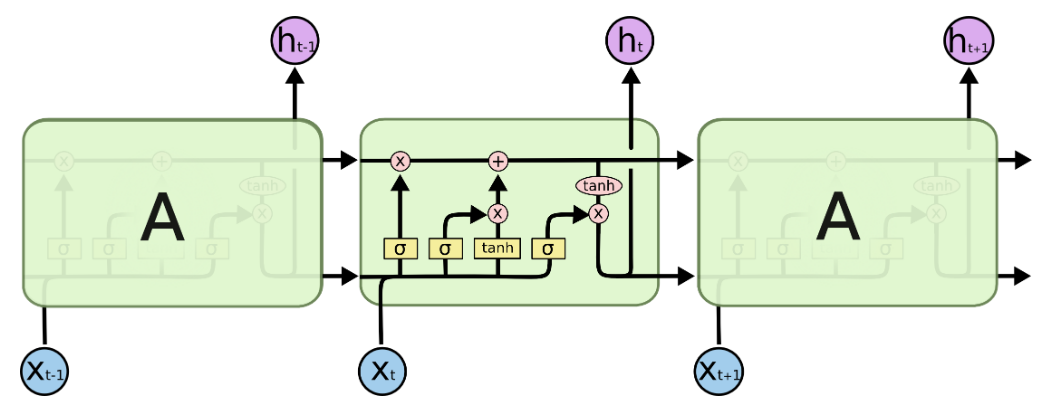
Figure 1: LSTM model.
3. Results
3.1. ARIMA
First, ADF Test result is compared to different degrees at 1%, 5%, and %10 and checking the result if it can reject the statistical value of the original hypothesis at those degrees. If the result is all less than three degrees at the same time, it means that the hypothesis can be very well rejected. In this data, the adf result is -12, which is less than the statistical value of three degrees. In the result got from the data, the P-value is 1.005e-23, which is close to 0. After first-order difference, the data series becomes a stationary white noise series, so the model can be preliminarily judged as AR (1) model.
The autocorrelation graphs and partial autocorrelation graphs after first-order difference are as follows in Figures 2 and 3:
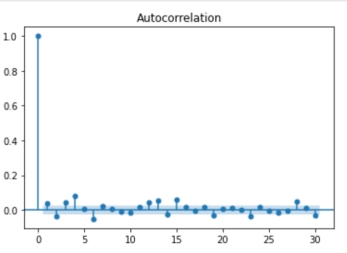
Figure 2: Autocorrelation.
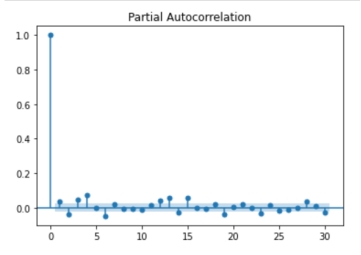
Figure 3: Partial Autocorrelation.
According to the autocorrelation graph and partial autocorrelation graph, the autocorrelation coefficient and partial autocorrelation coefficient rapidly decrease to near 0, so it is determined to be a first-order truncation, so p is equal to 1 and q is equal to 1.
Then, according to the results of the evaluation criteria, when p = 1 and q = 1, the two values are the smallest, AIC is 64325.120, BIC is 64352.068.
Model test is carried out, and all the P-values are less than 0.05 except the intercept term (indicating that there is no constant term), that is, the null hypothesis is rejected, indicating that the model diagnosis passes.
Finally, the model predicts and visualizes the closing prices from 2014 to 2016 (See Figure 4). Calculate the rmse of the predicted value and the real value. Rmse is calculated to be 1101. From the results, the prediction effect is not very good.
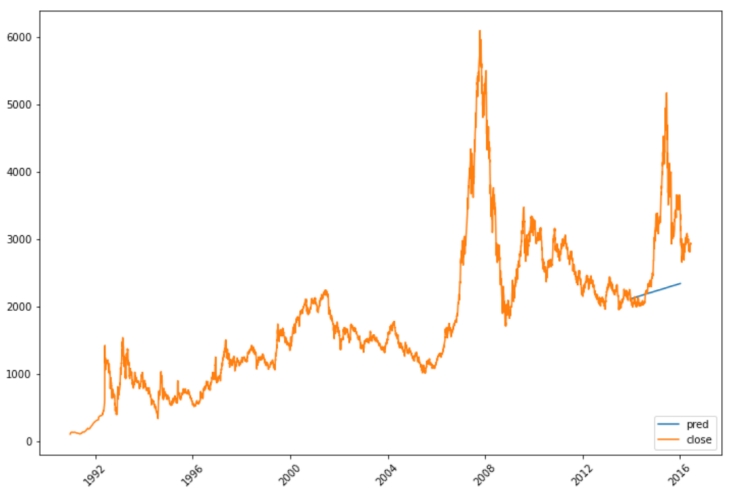
Figure 4: ARIMA Predicts Result.
3.2. LSTM
A two-layer LSTM model is built for prediction and the results are visualized in Figure 5.
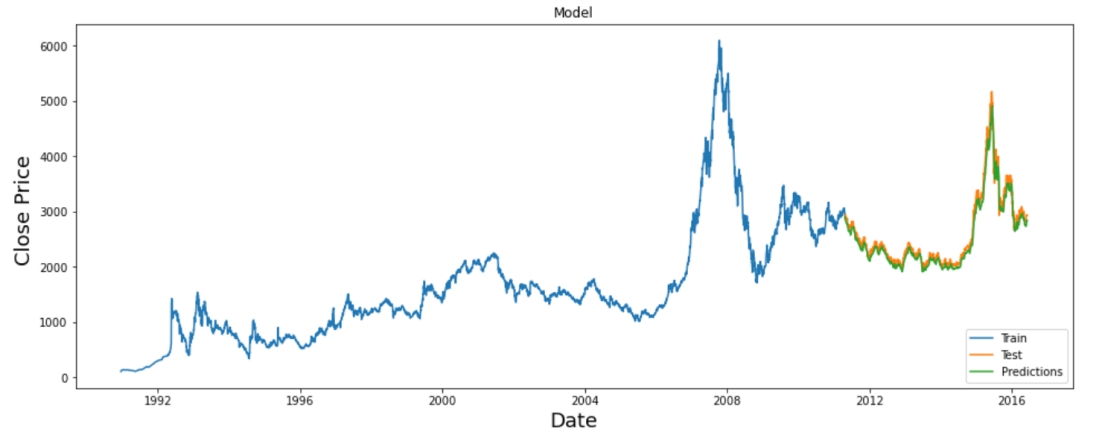
Figure 5: LSTM Predicts Result.
3.3. Comparison
By comparing the predictions of the two models, this paper makes the conclusion that LSTM is better than ARIMA in predicting the performance of Shanghai Composite Index (See Table 1).
Table 1: Rmse Comparison Results.
Model | Rmse Result |
ARIMA | 1101.036023711438 |
LSTM | 116.15936167898809 |
4. Conclusion
This paper uses ARIMA and LSTM models to forecast the Shanghai Composite Index (1991-2016). The prediction effect of the two models is compared and analyzed. Rmse is used as the standard of prediction, and LSTM is better for the data set used in this paper. LSTM has already optimized to other advanced models, this paper only takes LSTM into consideration, adopting alternative models deserve further investigations.
References
[1]. Gao, Y. Y. (2022) Research on Nonlinear Time Series Hybrid Prediction Model Based on Swarm Intelligence Optimization, Thesis for doctoral degree, Dongbei University of Finance And Economics.
[2]. Yu, Q., and Tian, X. (2021) Nonlinear time series prediction algorithm based on combination model. Computer Engineering & Science, (10),1817-1825.
[3]. Xie, J. B., Jiang, F., Du, J. W., and Zhao, J. (2022) Stock price prediction based on improved artificial fish swarm algorithm and RBF neural network. Computer Engineering & Science, (11), 2080-2090.
[4]. Wu, S. Z. (2018) Stock Price Prediction Based on BP Artificial Neural Network Model, Thesis for master’s degree, Tianjin University
[5]. Yuan, D. (2010) Stock Market Prediction Research Based on Artificial Neural Network, Thesis for master’s degree, Hunan University.
[6]. Wu, D. (2016) Safety Stock Prediction Model Based on The Fuzzy Decision Tree Algorithm, Thesis for master’s degree, China University of Geosciences, Beijijng.
[7]. Tao, Y. U. (2014) Application of Decision Tree and Neural Network in Stock Classification Prediction, Thesis for master’s degree, Hangzhou Dianzi University.
[8]. Li, X. H., Jia, H. D., Cheng, X., and Li, T. Y. (2022) Stock market volatility prediction method based on improved genetic algorithm and graph neural network. Journal of Computer Applications, (05),1624-1633.
[9]. Xie, M. D., and Qin, J. T. (2019) Research on BP neural network optimized by genetic algorithm to predict stock index. Software Guide, (04), 41-45.
[10]. Cheng, L. J., and Feng, J. M. (2021) Stock prediction based on weighted Markov model. Journal of Shaoguan University, (06), 7-11.
[11]. Li, J. H. (2021) Stock prediction and analysis based on support vector machine. Economic Research Guide, (32), 107-110.
[12]. Chen, H. (2020) Stock prediction model based on hybrid genetic algorithm and support vector machine. Modern marketing (management edition), (04), 181-182.
[13]. Qin, L., and Li, X. W. (2018) Research on cost sensitive support vector machine based on region labeling in stock prediction. Journal of Sichuan University (Natural Science Edition), (02), 277-282.
Cite this article
Hu,Y. (2024). Shanghai Stock Composite Index Forecasts: Evidence from ARIMA and LSTM. Advances in Economics, Management and Political Sciences,57,303-308.
Data availability
The datasets used and/or analyzed during the current study will be available from the authors upon reasonable request.
Disclaimer/Publisher's Note
The statements, opinions and data contained in all publications are solely those of the individual author(s) and contributor(s) and not of EWA Publishing and/or the editor(s). EWA Publishing and/or the editor(s) disclaim responsibility for any injury to people or property resulting from any ideas, methods, instructions or products referred to in the content.
About volume
Volume title: Proceedings of the 2nd International Conference on Financial Technology and Business Analysis
© 2024 by the author(s). Licensee EWA Publishing, Oxford, UK. This article is an open access article distributed under the terms and
conditions of the Creative Commons Attribution (CC BY) license. Authors who
publish this series agree to the following terms:
1. Authors retain copyright and grant the series right of first publication with the work simultaneously licensed under a Creative Commons
Attribution License that allows others to share the work with an acknowledgment of the work's authorship and initial publication in this
series.
2. Authors are able to enter into separate, additional contractual arrangements for the non-exclusive distribution of the series's published
version of the work (e.g., post it to an institutional repository or publish it in a book), with an acknowledgment of its initial
publication in this series.
3. Authors are permitted and encouraged to post their work online (e.g., in institutional repositories or on their website) prior to and
during the submission process, as it can lead to productive exchanges, as well as earlier and greater citation of published work (See
Open access policy for details).
References
[1]. Gao, Y. Y. (2022) Research on Nonlinear Time Series Hybrid Prediction Model Based on Swarm Intelligence Optimization, Thesis for doctoral degree, Dongbei University of Finance And Economics.
[2]. Yu, Q., and Tian, X. (2021) Nonlinear time series prediction algorithm based on combination model. Computer Engineering & Science, (10),1817-1825.
[3]. Xie, J. B., Jiang, F., Du, J. W., and Zhao, J. (2022) Stock price prediction based on improved artificial fish swarm algorithm and RBF neural network. Computer Engineering & Science, (11), 2080-2090.
[4]. Wu, S. Z. (2018) Stock Price Prediction Based on BP Artificial Neural Network Model, Thesis for master’s degree, Tianjin University
[5]. Yuan, D. (2010) Stock Market Prediction Research Based on Artificial Neural Network, Thesis for master’s degree, Hunan University.
[6]. Wu, D. (2016) Safety Stock Prediction Model Based on The Fuzzy Decision Tree Algorithm, Thesis for master’s degree, China University of Geosciences, Beijijng.
[7]. Tao, Y. U. (2014) Application of Decision Tree and Neural Network in Stock Classification Prediction, Thesis for master’s degree, Hangzhou Dianzi University.
[8]. Li, X. H., Jia, H. D., Cheng, X., and Li, T. Y. (2022) Stock market volatility prediction method based on improved genetic algorithm and graph neural network. Journal of Computer Applications, (05),1624-1633.
[9]. Xie, M. D., and Qin, J. T. (2019) Research on BP neural network optimized by genetic algorithm to predict stock index. Software Guide, (04), 41-45.
[10]. Cheng, L. J., and Feng, J. M. (2021) Stock prediction based on weighted Markov model. Journal of Shaoguan University, (06), 7-11.
[11]. Li, J. H. (2021) Stock prediction and analysis based on support vector machine. Economic Research Guide, (32), 107-110.
[12]. Chen, H. (2020) Stock prediction model based on hybrid genetic algorithm and support vector machine. Modern marketing (management edition), (04), 181-182.
[13]. Qin, L., and Li, X. W. (2018) Research on cost sensitive support vector machine based on region labeling in stock prediction. Journal of Sichuan University (Natural Science Edition), (02), 277-282.