


1. Introduction
Markowitz's portfolio theory encompasses the mean-variance model as well as the concept of the efficient frontier. This theory quantifies a portfolio's expected return in terms of its mean, while its associated risk is captured by variance [1]. Investment strategies aim to identify the portfolio allocation that either maximises return for a specified level of risk or minimises risk for a given level of return [2].
Underlying Assumptions: The theory rests on several foundational assumptions: (1) Security markets operate efficiently; (2) Investors base portfolio choices solely on two metrics—expected value and variance of returns; and (3) Investment decisions are influenced by the probability distribution of returns, which is assumed to conform to a normal distribution [3]. Given a specific level of risk, the portfolio with the highest expected return is selected. Conversely, for a predefined return, the portfolio with the lowest associated risk is preferred.
2. Mean-Variance Model
In a single investment period, this research assumes an investment in a portfolio consisting of \( n \) risky assets. Here, \( {r_{i}} \) represents the expected rate of return on the \( {i^{th}} \) asset, \( {Q_{i}} \) denotes the probability of that return occurring, and \( {W_{i}} \) is the weight of the \( {i^{th}} \) asset in the portfolio. The expected rate of return on the portfolio for one investment period is expressed as:
\( E{(r_{n}})=\sum _{i=1}^{n}{W_{i}}{Q_{i}}{r_{i}} \) (1)
Simultaneously, the variance of a portfolio containing \( n \) assets, denoted \( σ_{n}^{2} \) , is given by:
\( σ_{n}^{2}==\sum _{i=1}^{n}\sum _{y=1}^{n}{W_{i}}{W_{y}}{p_{iy}}{σ_{i}}{σ_{y}}=\sum _{i=1}^{n}\sum _{y=1}^{n}{W_{i}}{W_{y}}cov({r_{i}}{,r_{y}}) \) (2)
Given the prohibition of short selling in the Chinese securities market, the constraint for the portfolio weights is: \( \sum _{i=1}^{n} {W_{i}}≤1,{W_{i}}≥0 \) .
In Equation (2), \( i \) and \( y \) represent distinct assets within the portfolio. The term \( cov({r_{i}}{,r_{y}}) \) represents the covariance between asset \( i \) and asset \( y \) , serving as a measure of the linkage between their returns. Additionally, \( {σ_{i}} \) and \( {σ_{y}} \) denote the standard deviations of assets \( i \) and \( y \) respectively. It is evident from Equation (2) that the portfolio's risk is a function of the asset weights, the correlation coefficients between the assets, and each asset's individual risk. Hence, one can mitigate the portfolio's risk by strategically selecting assets with lower correlation coefficients.
3. Portfolio Efficient Frontier
Every conceivable combination of assets within a portfolio constitutes the feasible set. This set manifests as a left-convex region, as depicted in Figure 1. The Minimum Variance Portfolio (MVP) point corresponds to the portfolio composition where the variance is at its lowest [4].
|
Figure 1: Efficient Frontier. |
Photo credit: Original |
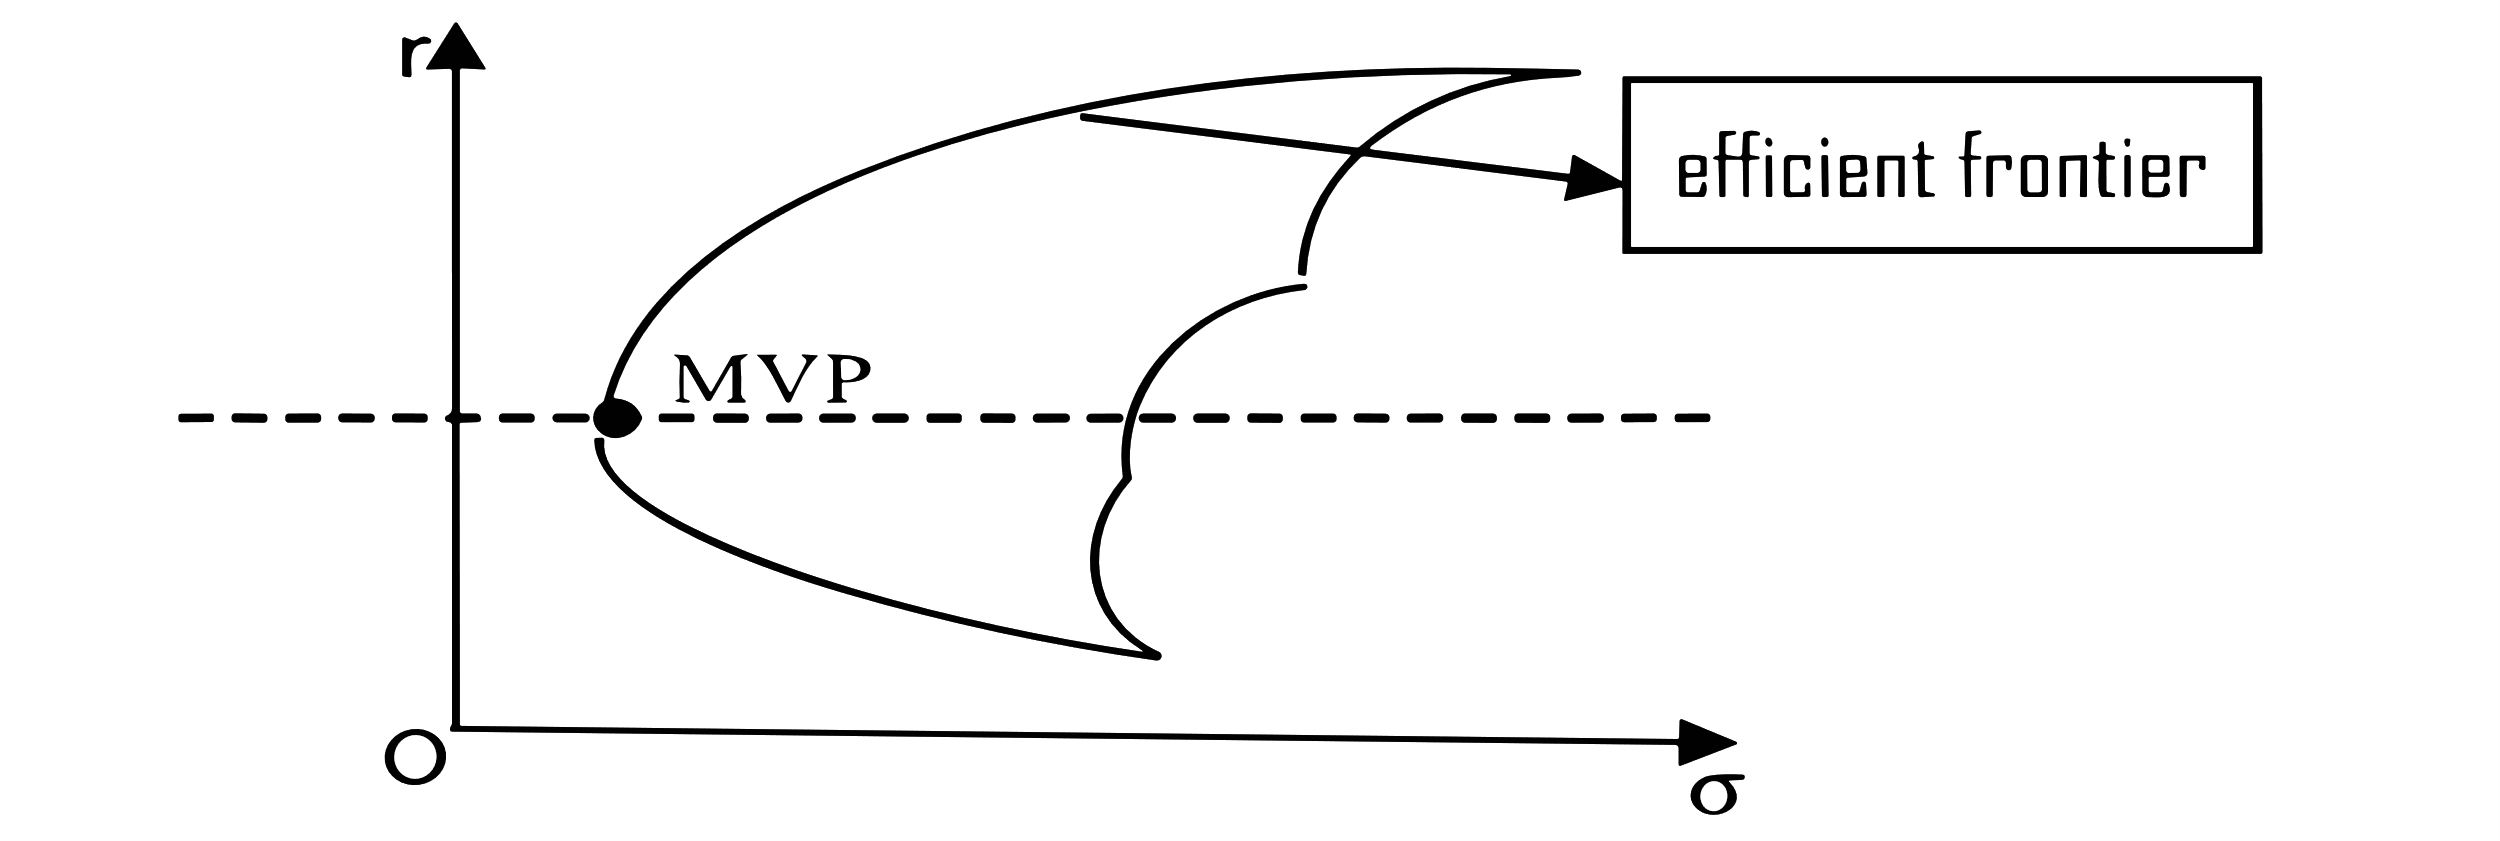
In Figure 1, the Dotted Line Partitions the Curve into Two Segments. Portfolios Situated on the Upper Segment of This Curve, and Thus above the Dotted Line, Meet the Criteria of Maximising Returns for a Given Risk Level or Minimising Risk for a Specific Return. This Upper Curve Is Referred to As the Efficient Frontier of the Asset Portfolio.
Sharpe Ratio [5]. This metric offers a risk-adjusted evaluation of a portfolio's performance. The Sharpe Ratio quantifies the excess expected return of a portfolio relative to its overall standard deviation. The formula for the Sharpe Ratio is:
\( {X_{p}}=\frac{E({r_{p}}-{R_{f}})}{{σ_{p}}} \) (3)
Where \( {X_{p}} \) represents the Sharpe Ratio, \( {σ_{p}} \) is the portfolio's standard deviation, and \( {R_{f}} \) is the risk-free rate. The ratio illuminates the amount of additional return achievable for every unit of risk undertaken. Empirical research often leverages the Sharpe Ratio to determine the most optimal portfolio allocation on the efficient frontier.
4. Literature Review
The applicability and relevance of Markowitz's Portfolio Theory (MPT) have been empirically evaluated across various global markets. In the Malaysian context, Lee et al. (2016) [6] emphasized the synergies between the Capital Asset Pricing Model (CAPM) and MPT, elucidating their roles in the Kuala Lumpur Stock Exchange. Their findings accentuated CAPM's prowess in forecasting stock behaviour and underscored the importance of Markowitz diversification in risk mitigation. Parallelly, Širůček and Křen (2017) [7] explored MPT in the U.S. market, leveraging the Dow Jones Industrial Average index for portfolio construction. Their research provides substantial insights into optimized security selection, balancing risk, and return.
A discernible trend in recent literature is the integration of advanced computational methodologies with traditional portfolio theories. Ma et al. (2020) [8] presented a pioneering approach, amalgamating deep learning with MPT to enhance stock return predictions. Their exploration revealed the promise of tools like Deep Neural Networks in reshaping the investment landscape. Notably, studies focused on the Chinese market have exhibited a growing interest in MPT's potential and limitations. Wu (2022) [9] employed a comprehensive analysis, incorporating Monte Carlo simulations, to critically evaluate MPT's practicality in the real stock market scenario. In a congruent vein, Zhang (2023) [10] harnessed the computational capabilities of Python to fortify the empirical application of Markowitz's theory in portfolio optimization.
However, a nuanced observation reveals a gap. Despite the wide-ranging investigations into MPT across diverse markets, such as the work of Sri Artini and Sandhi (2020) [11] which spanned the Chinese, Indonesian, and Indian markets, and its confluence with advanced technologies highlighted by Jang and Seong (2023) [12], there remains a paucity of research concentrating on the empirical nuances of MPT within the Chinese stock market, especially when leveraging Python.
Given this backdrop, the present study aspires to bridge this gap, utilizing Python's robust computational capacities to provide a granular analysis of Markowitz's portfolio theory's intricacies within China's dynamic stock market landscape.
5. Empirical Analysis
The empirical analysis undertaken in this research reflects the specific characteristics of China's securities market. This study operates under the following assumptions: (1) Stock prices fully capture all available information in the securities market [13]; (2) Transaction costs are disregarded; (3) Assets can be divided infinitely; (4) Portfolio decisions are guided by the expected return and variance [14]; (5) Investors exhibit a relentless pursuit for returns, meaning, all other factors held constant, they will gravitate towards portfolios with higher expected returns; (6) Short selling of stocks is prohibited.
For the purpose of this analysis, five stocks were selected from China's stock market: Guizhou Maotai, China Merchants Bank, Longyi, Haitian Flavouring, and Sany Heavy Industry. Data corresponding to these stocks were sourced from NetEase Finance, spanning from June 11, 2018, to February 1, 2022. This data facilitated the computation of the covariance and correlation coefficients of these stocks over the said period. Subsequent analyses sought to maximise the Sharpe ratio and minimise portfolio variance, leading to the identification of two optimal portfolios. The weightings of these portfolios were then determined. Calculations were performed to ascertain the return, variance, and Sharpe ratio of both portfolios—one optimised for maximum Sharpe ratio and the other for minimum variance. These portfolios' positions on the efficient frontier were duly marked, culminating in the graphical representation of the efficient frontier.
Table 1: Correlation Coefficient.
Guizhou Maotai | China Merchants Bank | Longi shares | Haitian Taste | Sany Heavy Industry | |
Guizhou Maotai | 1.000000 | 0.466756 | 0.207298 | 0.518991 | 0.397854 |
China Merchants Bank | 0.466756 | 1.000000 | 0.163934 | 0.302402 | 0.444368 |
Longi shares | 0.207298 | 0.163934 | 1.000000 | 0.154415 | 0.227150 |
Haitian Taste | 0.518991 | 0.302402 | 0.154415 | 1.000000 | 0.321604 |
Sany Heavy Industry | 0.397854 | 0.444368 | 0.227150 | 0.321604 | 1.000000 |
Table 1 presents the correlation coefficients of the five selected stocks, while Table 2 details the annualised rate of return covariance of the chosen stocks.
Table 2: Annualised Rate of Return Covariance.
Guizhou Maotai | China Merchants Bank | Longi shares | Haitian Taste | Sany Heavy Industry | |
Guizhou Maotai | 0.112822 | 0.046906 | 0.053652 | 0.067956 | 0.053621 |
China Merchants Bank | 0.046906 | 0.089091 | 0.031110 | 0.035213 | 0.053182 |
Longi shares | 0.053652 | 0.031110 | 0.271947 | 0.048350 | 0.062656 |
Haitian Taste | 0.067956 | 0.035213 | 0.048350 | 0.156561 | 0.049921 |
Sany Heavy Industry | 0.053621 | 0.053182 | 0.062656 | 0.049921 | 0.159019 |
As observed in Figure 2, the annualised returns of all five stocks exceed 0, signifying a reduced likelihood of negative returns. Furthermore, the correlation coefficients and covariances depicted in Table 1 and Table 2 suggest moderate relationships among the stocks. These characteristics make them suitable candidates for portfolio construction.
Table 3: Summary Statistics.
Count | Mean | Std. err | Min | P25 | P50 | P75 | Max | |
GZMT | 886.0 | 0.001003 | 0.021159 | -0.105361 | -0.010342 | 0.000406 | 0.013360 | 0.090792 |
ZSYH | 886.0 | 0.000611 | 0.018803 | -0.068975 | -0.009799 | -0.000561 | 0.011486 | 0.095211 |
LJGF | 881.0 | NaN | NaN | -inf | -0.015678 | 0.000784 | 0.018516 | inf |
HTWY | 886.0 | 0.000270 | 0.024925 | -0.240623 | -0.012359 | 0.000422 | 0.012076 | 0.095330 |
SYZG | 886.0 | 0.001009 | 0.025120 | -0.105153 | -0.013620 | 0.000840 | 0.013656 | 0.095237 |
Table 3 presents the descriptive statistics for individual stocks, detailing the daily log returns. The 'Mean' column signifies the average daily log return for each stock. Specifically, the daily log return for Guizhou Maotai stands at 0.001003, for China Merchants Bank at 0.00611, for Haitian Taste at 0.000270, and for Sany Heavy Industry at 0.001009.
The column labeled 'Std. err' delineates the standard deviation of the logarithmic returns for each stock. For instance, the standard deviation for Guizhou Maotai's daily log return is 0.021159, for China Merchants Bank's is 0.018803, for Haitian Taste's is 0.024925, and for Sany Heavy Industry's, it's 0.025120.
Lastly, the 'Min' and 'Max' columns indicate the lowest and highest daily logarithmic returns respectively for each stock. To elucidate, Guizhou Maotai has a range from -0.105361 to 0.090792, Haitian Taste's range spans from -0.240623 to 0.095330, and Sany Heavy Industry's varies from -0.105153 to 0.095237.
Longi shares was suspended from trading on April 9, 2019, and resumed on April 17, 2019, due to the implementation of share allotment. As a result, in the calculation of daily logarithmic returns for Longi shares—specifically for mean, standard deviation, and the minimum and maximum values—the Python computation resulted in NaN and inf values. This was due to a division by zero error. With the provided data, annual logarithmic returns for the stocks, excluding Longi shares, are as follows: Guizhou Maotai at 25.28%, China Merchants Bank at 15.40%, Haitian Taste at 6.79%, and Sany Heavy Industry at 25.79%.
Table 3, the individual stock descriptive volume statistics, provides insights into the quartiles of the daily log returns of the respective stocks. Additionally, Figure 1 illustrates the value of daily log returns corresponding to each quartile for these stocks.
This research then employs a Monte Carlo simulation to derive random weights for 20,000 portfolios, capturing the expected returns, standard deviations, and Sharpe ratios associated with each weight combination.
The highest Sharpe ratio for these portfolios was identified under specific constraints on the stock weights, ensuring the sum of weights equated to 1. Utilising Python's minimize function, the research sought to minimise the negative value of the Sharpe ratio. Initially, weights for all five stocks were set at 0.2. The optimal outcome produced stock weights of [0.49397271, 0.13896104, 0.00895254, 0.00895254, 0.00895254, 0.00895254, 0.00895254, 0.00895254, 0.00895254, 0.00895254, 0.0095254, 0.00895254, 0.02272108, 0.33539263], correlating to an expected portfolio return of 0.2435, a standard deviation of 0.2897, and a Sharpe ratio of 0.8404.
Following a similar methodology, the weights of the minimum variance portfolio for the five stocks were [0.11017539, 0.26214347, 0.2252433, 0.29467509, 0.10776275]. This portfolio yielded an expected return of 0.1503, a standard deviation of 0.2504, and a Sharpe ratio of 0.6002.
For the purposes of this analysis, the portfolio with weights yielding the maximum Sharpe ratio is denoted as Portfolio I, while the portfolio with weights resulting in the minimum variance is termed Portfolio II. The specifics of these two portfolios are collated in Table 4.
Table 4: Two Optimal Portfolios.
Portfolio | Weighting | Expected Rate of Return | Standard Deviation (Statistics) | Sharpe Ratio |
Portfolio I | [0.49397271,0.13896104, 0.00895254,0.02272108, 0.33539263] | 0.2435 | 0.2897 | 0.8404 |
Portfolio II | [0.11017539,0.26214347, 0.2252433,0.29467509, 0.10776275] | 0.1503 | 0.2504 | 0.6002 |
Beginning the discussion by contemplating the typical mindset of an investor in the Chinese securities market, this research assumes that investors display payoff-intolerance. This means that, for a given level of risk, investors generally desire higher returns. When the Sharpe ratio is maximised, the stock weights correspond to Portfolio I. Under this scenario, an investor would likely opt for Portfolio I as their investment strategy. This portfolio offers an expected return of 0.2435, a standard deviation of 0.2897, and a Sharpe ratio of 0.8404.
|
Figure 2: Feasible Set. |
Photo credit: Original |
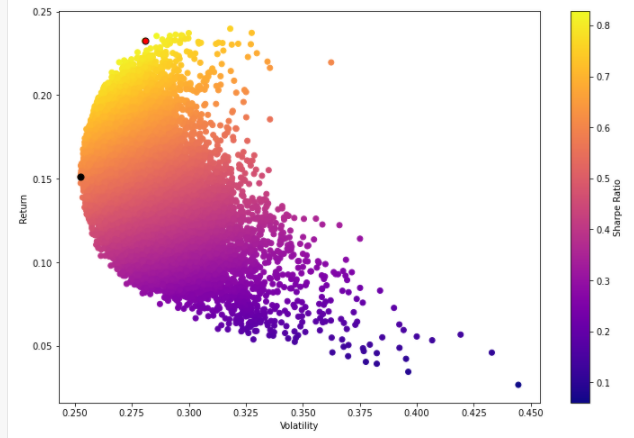
Within the feasible set, Portfolio I and Portfolio II are distinctly marked. The position of Portfolio I is indicated by a red dot, while Portfolio II is denoted by a black dot. Refer to Figure 2 for visual clarification.
|
Figure 3: Feasible Set with Efficient Frontier. |
Photo credit: Original |
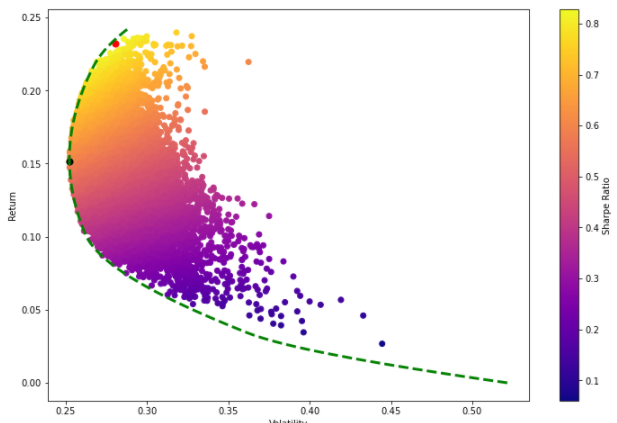
Naturally, it's a simplification to assume every investor prioritises rewards. Such conclusions arise purely from the assumptions adopted in this empirical analysis. A risk-averse investor might favour the weights of Portfolio II. Yet there are also investors who don't fit neatly into categories of reward-seeking or risk-aversion. These investors would balance their personal risk tolerance with their investment preferences, selecting an appropriate strategy based on the efficient frontier depicted in Figure 3.
6. Conclusion
In the empirical analysis, the data from individual stocks was processed to obtain correlation coefficients and annualized return covariances. This was done to ascertain their suitability for investment portfolio construction. Subsequently, the Markowitz portfolio theory was employed to identify two optimal portfolios and to outline the set of effective portfolios. The findings indicate that an investor, aiming to achieve the maximum return for a given risk, could opt for the portfolio with the highest Sharpe ratio. This portfolio comprises stocks weighted as follows: Guizhou Maotai at 0.49397271, China Merchants Bank at 0.13896104, Longi shares at 0.00895254, Haitian Taste at 0.02272108, and Sany Heavy Industry at 0.33539263. This allocation results in an expected return of 0.2435 with an associated risk of 0.2897. Alternatively, for investors prioritising a given return with minimal risk, the portfolio with the lowest variance is recommended. This consists of Guizhou Maotai weighted at 0.11017539, China Merchants Bank at 0.26214347, Longi shares at 0.2252433, Haitian Taste at 0.29467509, and Sany Heavy Industry at 0.10776275. Investors desiring varied risk-return combinations can adjust their investments according to the efficient frontier.
The findings illustrate that Markowitz's portfolio theory can effectively diminish the weightings of stocks exhibiting low returns and heightened risks among the selected equities. This facilitates investors in channelling their capital towards a limited selection of securities that present superior returns and risk profiles. Notably, the effective portfolio outperforms the typical portfolio, given its capacity to either yield higher returns at a similar risk or secure equivalent returns at reduced risk compared to the standard securities portfolio.
In the context of the contemporary Chinese securities market, investors typically rely on technical and fundamental analyses of individual stocks. Yet, when an investment decision is centred around a single stock, it essentially constitutes a portfolio. The unsystematic risk linked to an individual stock is a significant concern. Crafting an effective investment portfolio serves to mitigate the non-systematic risk inherent in the collection. Employing an effective portfolio to sidestep certain risks while guaranteeing returns aligns with the aspirations of many investors. Moreover, the efficient frontier, as derived through Markowitz's portfolio theory, provides a clear roadmap for investors. By comprehending their risk preferences and integrating them with the efficient portfolios crafted via the efficient frontier, investors can strive to either maximise their returns or curtail their risks. This approach can significantly aid investors, especially those unsure about astute investment strategies.
Given these considerations, applying Markowitz's portfolio theory to China's securities market appears to be a plausible strategy.
References
[1]. Freitas, F. D., De Souza, A. F., & de Almeida, A. R. (2009). Prediction-based portfolio optimization model using neural networks. Neurocomputing, 72(10), 2155–2170. https://doi.org/10.1016/j.neucom.2008.08.019
[2]. Lai, K. K., Yu, L., & Wang, S. (2006). Mean-Variance-Skewness-Kurtosis-based Portfolio Optimization. First International Multi-Symposiums on Computer and Computational Sciences (IMSCCS’06), 2, 292–297. https://doi.org/10.1109/IMSCCS.2006.239
[3]. Wang, S. S. (2000). A Class of Distortion Operators for Pricing Financial and Insurance Risks. The Journal of Risk and Insurance, 67(1), 15–36. https://doi.org/10.2307/253675
[4]. Shi, F., Shu, L., Yang, A., & He, F. (2020). Improving Minimum-Variance Portfolios by Alleviating Overdispersion of Eigenvalues. Journal of Financial and Quantitative Analysis, 55(8), 2700–2731. https://doi.org/10.1017/S0022109019000899
[5]. Sharpe, W. F. (1966). Mutual Fund Performance. The Journal of Business, 39(1), 119–138.
[6]. Lee, H.-S., Cheng, F.-F., & Chong, S.-C. (2016). Markowitz Portfolio Theory and Capital Asset Pricing Model for Kuala Lumpur Stock Exchange: A Case Revisited. International Journal of Economics and Financial Issues, 6(3), Article 3.
[7]. Širůček, M., & Křen, L. (2017). Application of Markowitz Portfolio Theory by Building Optimal Portfolio on the US Stock Market. In Tools and Techniques for Economic Decision Analysis (pp. 24–42). IGI Global. https://doi.org/10.4018/978-1-5225-0959-2.ch002
[8]. Ma, Y., Han, R., & Wang, W. (2020). Prediction-Based Portfolio Optimization Models Using Deep Neural Networks. IEEE Access, 8, 115393–115405. https://doi.org/10.1109/ACCESS.2020.3003819
[9]. Wu, W. (2022). Is Evaluation Indicators of Portfolio Performance Reliable? An Empirical Research of Markowitz’s Portfolio Theory Based Monte Carlo Simulation. World Scientific Research Journal, 8(3), 412–419. https://doi.org/10.6911/WSRJ.202203_8(3).0050
[10]. Zhang, A. (2023). Portfolio Optimization of Stocks – Python-Based Stock Analysis. International Journal of Education and Humanities, 9(2), Article 2. https://doi.org/10.54097/ijeh.v9i2.9584
[11]. Sri Artini, L. G., & Sandhi, N. L. P. S. (2020). Comparison of SME stock portfolio and manufacturing company performance in the Indonesian, Indian and Chinese stock markets. Journal of Economic and Administrative Sciences, 37(2), 209–237. https://doi.org/10.1108/JEAS-04-2019-0044
[12]. Jang, J., & Seong, N. (2023). Deep reinforcement learning for stock portfolio optimization by connecting with modern portfolio theory. Expert Systems with Applications, 218, 119556. https://doi.org/10.1016/j.eswa.2023.119556
[13]. Fama, E. F. (1970). Efficient Capital Markets: A Review of Theory and Empirical Work. The Journal of Finance, 25(2), 383–417. https://doi.org/10.2307/2325486
[14]. Markowitz, H. M., & Todd, G. P. (2000). Mean-Variance Analysis in Portfolio Choice and Capital Markets. John Wiley & Sons.
Cite this article
He,Q. (2024). A Python-based Empirical Study of Markowitz's Portfolio Theory in the Chinese Stock Market. Advances in Economics, Management and Political Sciences,59,279-286.
Data availability
The datasets used and/or analyzed during the current study will be available from the authors upon reasonable request.
Disclaimer/Publisher's Note
The statements, opinions and data contained in all publications are solely those of the individual author(s) and contributor(s) and not of EWA Publishing and/or the editor(s). EWA Publishing and/or the editor(s) disclaim responsibility for any injury to people or property resulting from any ideas, methods, instructions or products referred to in the content.
About volume
Volume title: Proceedings of the 2nd International Conference on Financial Technology and Business Analysis
© 2024 by the author(s). Licensee EWA Publishing, Oxford, UK. This article is an open access article distributed under the terms and
conditions of the Creative Commons Attribution (CC BY) license. Authors who
publish this series agree to the following terms:
1. Authors retain copyright and grant the series right of first publication with the work simultaneously licensed under a Creative Commons
Attribution License that allows others to share the work with an acknowledgment of the work's authorship and initial publication in this
series.
2. Authors are able to enter into separate, additional contractual arrangements for the non-exclusive distribution of the series's published
version of the work (e.g., post it to an institutional repository or publish it in a book), with an acknowledgment of its initial
publication in this series.
3. Authors are permitted and encouraged to post their work online (e.g., in institutional repositories or on their website) prior to and
during the submission process, as it can lead to productive exchanges, as well as earlier and greater citation of published work (See
Open access policy for details).
References
[1]. Freitas, F. D., De Souza, A. F., & de Almeida, A. R. (2009). Prediction-based portfolio optimization model using neural networks. Neurocomputing, 72(10), 2155–2170. https://doi.org/10.1016/j.neucom.2008.08.019
[2]. Lai, K. K., Yu, L., & Wang, S. (2006). Mean-Variance-Skewness-Kurtosis-based Portfolio Optimization. First International Multi-Symposiums on Computer and Computational Sciences (IMSCCS’06), 2, 292–297. https://doi.org/10.1109/IMSCCS.2006.239
[3]. Wang, S. S. (2000). A Class of Distortion Operators for Pricing Financial and Insurance Risks. The Journal of Risk and Insurance, 67(1), 15–36. https://doi.org/10.2307/253675
[4]. Shi, F., Shu, L., Yang, A., & He, F. (2020). Improving Minimum-Variance Portfolios by Alleviating Overdispersion of Eigenvalues. Journal of Financial and Quantitative Analysis, 55(8), 2700–2731. https://doi.org/10.1017/S0022109019000899
[5]. Sharpe, W. F. (1966). Mutual Fund Performance. The Journal of Business, 39(1), 119–138.
[6]. Lee, H.-S., Cheng, F.-F., & Chong, S.-C. (2016). Markowitz Portfolio Theory and Capital Asset Pricing Model for Kuala Lumpur Stock Exchange: A Case Revisited. International Journal of Economics and Financial Issues, 6(3), Article 3.
[7]. Širůček, M., & Křen, L. (2017). Application of Markowitz Portfolio Theory by Building Optimal Portfolio on the US Stock Market. In Tools and Techniques for Economic Decision Analysis (pp. 24–42). IGI Global. https://doi.org/10.4018/978-1-5225-0959-2.ch002
[8]. Ma, Y., Han, R., & Wang, W. (2020). Prediction-Based Portfolio Optimization Models Using Deep Neural Networks. IEEE Access, 8, 115393–115405. https://doi.org/10.1109/ACCESS.2020.3003819
[9]. Wu, W. (2022). Is Evaluation Indicators of Portfolio Performance Reliable? An Empirical Research of Markowitz’s Portfolio Theory Based Monte Carlo Simulation. World Scientific Research Journal, 8(3), 412–419. https://doi.org/10.6911/WSRJ.202203_8(3).0050
[10]. Zhang, A. (2023). Portfolio Optimization of Stocks – Python-Based Stock Analysis. International Journal of Education and Humanities, 9(2), Article 2. https://doi.org/10.54097/ijeh.v9i2.9584
[11]. Sri Artini, L. G., & Sandhi, N. L. P. S. (2020). Comparison of SME stock portfolio and manufacturing company performance in the Indonesian, Indian and Chinese stock markets. Journal of Economic and Administrative Sciences, 37(2), 209–237. https://doi.org/10.1108/JEAS-04-2019-0044
[12]. Jang, J., & Seong, N. (2023). Deep reinforcement learning for stock portfolio optimization by connecting with modern portfolio theory. Expert Systems with Applications, 218, 119556. https://doi.org/10.1016/j.eswa.2023.119556
[13]. Fama, E. F. (1970). Efficient Capital Markets: A Review of Theory and Empirical Work. The Journal of Finance, 25(2), 383–417. https://doi.org/10.2307/2325486
[14]. Markowitz, H. M., & Todd, G. P. (2000). Mean-Variance Analysis in Portfolio Choice and Capital Markets. John Wiley & Sons.