


Introduction
With the development of behavioral finance, research on indicators that can quantify investor behavior has become more and more important in behavioral finance. However, psychological evidence has shown that attention is still an insufficient cognitive resource [1]. Former researchers have already accomplished a model about investors’ attention allocation in learning and studying the impacts of this on asset-price dynamics [2]. They find that limited investor attention leads to category-learning behavior, i.e., investors tend to process more market and sector-wide information than firm-specific information. When this phenomenon is combined with overconfidence, it can reveal important characteristics of return co-movement. Besides, their model can also demonstrate new cross-sectional implications for return predictability.
Motivated by their research, I intend to further examine the relationship between investor attention and more direct capital market indicators like stock price and trading volume. The first thing I consider is the correlation between information and attention.
According to a theory, it pointed out that current good (bad) news has the power in predicting future positive (negative) returns. The overreaction evidence shows that over longer horizons of perhaps 3 to 5 years. Security prices overreact to consistent patterns of news pointing in the same direction. In this case, securities that have had a long record of good (bad)news tend to become overpriced (underpriced) and have low (high) average returns afterward. Put differently, securities with strings of good (bad) performance, however, measured, get extremely high (low) valuations, and these valuations on average return to the mean [3].
This point of view indicates that after consumers have emotions about market news, they will generate expectations in the same direction(positive or negative) according to their judgment. But in what indicators are these sentiments and expectations reflected? How does it further affect the stock? I intend to further analyze the more practical role of this conclusion.
The Internet age will inevitably have a considerable impact on investors' access to information and attention. The Internet is one of the resources for investors who lack the information required to make investment decisions [4]. Their research shows that when investors can obtain information from public sources, the same source of information will arouse investors' common emotional tendencies and lead to the herd effect. Besides, empirical results had been mentioned in their article. It shows that Google Search Volume Index can be a proxy for the investor attention of uninformed individual investors, and the measure of abnormal search volume index (ASVI, hereafter) shows that individual investors become more attentive to the information and exhibit more herding behavior. According to Google Search Volume Index, since search volume can be used as a measure of attention, it is possible to apply specific data to a more direct financial index. The ASVI study can also show that search volume can reflect investors' attention and further influence investors' investment decisions.
This paper aims to find a direct indicator that can reflect the impact of consumer expectation and sentiment on stock market valuation. This article quantifies investor attention with keyword search volume and uses the financial index and attention data of Apple and Tesla to establish a regression model to measure the relationship between investor attention and stock price changes in companies. Then I create the regression by using relevant data from SP500 and SSEC as a measure of the relationship between investor attention and price in the entire market. Apart from this, I make and illustrate the tendency chart of Apple, Tesla, SP500, SSEC, and investors’ sentiment. Eventually, I conclude that the attention of investors will cause stock price fluctuations, and positive sentiment signals (negative sentiment signals) will lead stock prices to rise (fall). Besides, the data of search volume can be used as a reference indicator for daily investment decisions.
This paper clarifies that search volume can be used as direct reference data and closely related to stock prices, addressing the lack of indicators that represent investor preferences in current areas. My result concretizes the conclusions which are summarized by previous scholars about the impact of investor sentiment on stock return. It provides a tool for future professional and non-professional investors to predict stock fluctuations in advance and make timely decisions.
Literature Review
In nowadays behavioral finance, the research on investor sentiment and market expectation are very mature. After referring to the research of many famous scholars, I found that there have been many quantitative models and research conclusions on investor sentiment to relatively measure the investor sentiment in the market. Investor sentiment is exogenous and instead focuses on its empirical effects and it is quite possible to measure investor sentiment, and waves of sentiment have discernible, important, and regular effects on individual firms and the stock market as a whole [5]. They mainly use the return rate and volatility of stocks as a measure of investor sentiment and stock price prediction. They did rigorous data analysis and modeling to reach these conclusions. However, their research is more focused on the variable itself of emotion, and there is no clear indicator that can reflect emotion.
The profit and loss of investors' investments are the most direct result of the investment market’s contribution to economics. Investment gains and losses also directly affect the investors’ subsequent sentiment and confidence. But there are stark differences in how they are perceived by investors. Researchers find that Investors are reluctant to realize losses, that they engage in tax-loss selling activity, and that past returns and his-topical price patterns, such as being at a monthly high or low, affect trading [6]. They also give a specific result: The propensity to sell stocks one holds is positively related to recent returns. The effect of the past return on trading activity is much more important for positive past market-adjusted returns than for negative past market-adjusted returns. Investors also tend to be reluctant to realize their losses except in December, when the urge to realize large losses for tax purposes tends to eliminate this effect.
This conclusion clarifies that investors are more focused on profitable markets and unwilling to admit losses, they still make irrational investment behaviors under the influence of changing external economic conditions. In addition, in general, small-cap stocks trigger more intensive herding behavior among individual investors. By studying the asymmetric effect of ASVI on herd behavior in bull and bear markets, it is confirmed that individual investors buy flocks in bull markets stronger, especially for small-cap companies. However, in bear markets, where prices deteriorate more severely in large-cap companies, we detect herding behavior on the sell side [4]. The individual investment returns of investors may become a potential indicator to measure market expectations, but it is difficult for me to operate in this aspect due to data acquisition problems. Therefore, I set my sights on more pro-investor sentiment indicators.
Modern financial economics assumes that we behave with extreme rationality, but certainly, we can’t do that. Psychological research has established that men are more prone to overconfidence than women, particularly so in male-dominated realms such as finance. In addition, researchers use empirical tests to provide strong support for the behavioral finance model: Men trade more than women and thereby reduce their returns more so than women. Furthermore, these differences are most pronounced between single men and single women which also concludes that Overconfident investors overestimate the precision of their information and thereby the expected gains of trading [7].
In this case, overconfidence is a vital factor affecting investors’ emotions and expectations. It can also be reflected in individual returns. However, the same problem arises, how to quantify the level of confidence, which becomes a difficult problem for me.
Economists around the world are eager to find an indicator that can accurately predict future market returns, and many scholars also use different variables to measure investor attention. Motivated by psychological evidence on limited investor attention and anchoring [8], researchers propose two proxies for the degree to which traders under and over-react to news, namely, the nearness to the Dow 52-week high and the nearness to the Dow historical high, respectively. We find that nearness to the 52-week high positively predicts future aggregate- market returns, while nearness to the historical high negatively predicts future market returns. Based on an intriguing study [9], Thomas and Hwang suggest that traders might use the 52- week high as an anchor when assessing the increment in stock value implied by new information. They argue that a stock whose price is at or near its 52-week high is a stock for which good news has recently arrived; and that this may be precisely the time when traders’ underreaction to the good news is at its peak. Hence, nearness to the 52-week high is positively associated with expected returns in the cross-section. On the other hand, Lin and Wei show that limited investor attention leads to category-learning behavior, i.e., investors tend to process more market-wide information than firm-specific information [2]. Because the Dow index is arguably the most widely available information about the market, investors are likely to use the Dow index as a benchmark when evaluating new market-wide information.
From these results, they decided to use the 52-week high of the Dow as a measure of overall market returns. However, through the analysis, there are a considerable number of less sensitive stocks in the experiment and the impact of behavioral bias on individual stock prices and the whole market. This, coupled with the long period span of the indicator, which takes place every 52 weeks, and the relatively hard-to-quantify factors such as momentum and behavioral bias, makes the indicator difficult to use in the investor market.
Besides, they provide a theoretical model for studying investors’ attention allocation in learning about asset fundamentals [2]. Their model shows that limited attention generates an endogenous structure of information that reflects the investor’s category-learning behavior, i.e., the investor tends to focus more on market- and sector-level information than on firm-specific information. When we combine this endogenous information structure with investor overconfidence, we generate several implications for asset-return comovement. We show that the return correlation between firms is higher than their fundamental correlation; stock prices in a sector with a lower average return correlation tend to be more informative and return correlations decrease over time with the development of information technology. These results are supported by recent empirical findings, which would otherwise be difficult to explain using standard rational expectations models.
This theory points out that the investors’ attention incorporates sentiment, overconfidence, expectation, and other multiple factors which will eventually lead to behavioral biases due to different market returns. This means that I should try my best to meet the subjective will of investors when screening feasible indicators.
Researchers emphasize that attention is a scarce cognitive resource [1]. Attention to one task necessarily requires a substitution of cognitive resources from other tasks. When it comes to investment decisions, given the vast amount of information available and the inevitability of limited attention, investors have to be selective in information processing. This theory also shows that attention is selective. Although the attention of investors can be adjusted by many factors, only one kind of attention plays a subjective role in each specific focus.
Hence, my paper aims to reflect the subjective behavior of investors' attention in detail from the browsing heat of investors' self-search of relevant stocks and the sentiment index integrated with big data. Using data analysis, we will get the overall relationship between investors' browsing enthusiasm and stock returns, to directly provide investors with a clear indicator for judgment.
Methodology and Data Analysis
The reason why I chose Apple and Tesla for my data analysis is that both companies have strong social and investor attention which means their data is richer and more likely to reflect the impact of investor attention on stock prices. Both companies have a strong ability to generate attention which means their attention data will be very volatile and more likely to show the results I want to test. Besides, the two companies have similar corporate positioning and attention tendencies in the sights of investors. In this case, I decided to examine the data from Apple and Tesla to represent the relationship between the company's stock price and attention. Comparing data from Apple and Tesla can summarize the difference in investor sensitivity between the current popular companies and the once-popular companies. Apart from this, the two companies obtain investor attention in similar ways, both generate phenomenal attention through new product launches. By comparing the data of the two, I can find commonalities between the stock prices of such prevalent companies and investor attention, so that I am more likely to come up with meaningful results. I collect the weekly data of the stock price and keyword search volume of Apple and Tesla in a period of one year (2021-2022) to make a comparison, and the significance is to compare whether there is a difference in the relationship between the search volume and the stock price of companies with recent popularity and those with past popularity. I also added Apple data from 2018-2019 to simulate a control group similar to Tesla's popularity in 2021-2022 to test whether the variables would change due to different heat periods.
I also collect the weekly data of search volume and stock prices of China's Shanghai Composite Index and the S&P 500 Index in the past year to represent the relationship between the region's stock price and attention.
Finally, I find the Sentiment Index of investors on the S&P 500 Index between 2018 and 2022. To measure whether the change in investors' expectations caused by external news was reflected in the change in the Sentiment Index of the S&P 500 from an exogenous perspective. We hope that by obtaining the scatter plot of the stock price and the keyword search popularity, we can regress the analysis result into a curve that conforms to the objective law as much as possible.
In the process of data analysis, we will use graphs and a linear model to visualize the data and I will combine chronological graphs and non-chronological graphs to illustrate the conclusion.
I will start with the perspective of the company, the chart below is drawn from Apple and Tesla’s weekly data on keyword search volume and stock prices from August 2021 to August 2022.
Fig. 1. The attention and price of Apple.
Fig. 2. The attention and price of Tesla (The left longitudinal axis represents attention to value and the right longitudinal axis represents a stock price.)
In figure 1 and figure 2 above, the line represents the change in the stock prices of the two companies from August 2021 to August 2022, while the clustered data below the line represents the weekly keyword search volume of the corresponding stock price.
According to the two charts above, you can see that people's attention is closely related to the fluctuations in stock prices. Whenever the stock price has an upward (downward) trend or has already risen (fallen), people's attention will rise. When that trend slows and stock prices level off, attention drops dramatically. Specifically, affected by national economic regulation and control, the Fed raised interest rates three times in March, May, and June. As a result of the interest rate increase, the stock prices of both companies have experienced a relative decline with fluctuation. However, attention is generally higher than it was before the March rate hike. This kind of situation also happened when the company has good(bad) news or event. After the positive news that Tesla officially broke the $1 trillion mark on October 25, 2021, the company's stock price continued to rise, and at the same time, attention also rose. Apple's stock price rose after its fall 2021 event and continued to rise until mid-December, and at the same time, attention also rose.
This trend shows that investor attention is affected by stock price fluctuations and changes in different directions depending on the news in both companies.
After analyzing the chronological data, I conducted a regression analysis on the two variables.
Table 1. Apple and Tesla’s regression
|
Apple |
Tesla |
Pre-Apple |
|
|
Search Vol |
0.092 (0.071) |
2.803 ** (1.110) |
0.0095 (0.0138) |
|
Trading Vol |
0.000 (0.000) |
0.000 (0.000) |
0.000 (0.000) |
|
Turnover |
119.409 (93.154) |
-12.544 (143.085) |
0.000 (0.000) |
|
lTrading Vol |
0.000** (0.000) |
0.000 (0.000) |
0.000 (0.000) |
|
lTurnover |
198.941** (88.847) |
-182.464 (158.680) |
|
|
lClosingPrice |
0.406 *** (0.083) |
0.644 *** (0.084) |
0.9644*** (0.0312642) |
|
PE |
3.875*** (0.581) |
0.854*** (0.272) |
|
|
Cons |
11.122 (11.261) |
-176.320 * (103.845) |
54.66828 3.097986 |
|
R-squared |
0.90 |
0.82 |
0.1576 |
*** p<.01, ** p<.05, * p<. 1, l=lag, Vol=Volume, (Std.Error). Pre-Apple means the analogous data of the Tesla’s popular period. Apple and Tesla’s sample periods are from August 2021 to August 2022, and Pre-Apple’s sample period is from August 2018 to December 2019.
In the table1 above, I used 6 additional variables to test the correlation between keyword search volume and stock price, and I also added Apple data from 2018-2019 to simulate a control group similar to Tesla's popularity in 2021-2022 to test whether variables would change due to different heat periods.
I compare data from Apple and Tesla in the same year and similar popular periods. There is a large individual disparity in the impact of investor attention on stock prices between companies. When I examined the Apple data, I find that compared to other relevant variables, the significance of the data was too low to get a direct correlation. On the contrary, there is a positive correlation between Tesla's keyword search volume and stock price. I find that even Apple's data from the close prevalent period still show a low correlation. Hence, the influence of the heat period on the difference in attention can be ruled out.
When observing the data of Tesla, the table shows a clear difference from Apple's regression data. There is a positive correlation between Tesla's keyword search volume and stock price. I speculate that this is due to different competition conditions in the market. Apple has obvious monopoly capabilities in the related product market, which belongs to a mature and saturated market situation. However, Tesla not only faces a large number of competitors and substitutes in the new energy vehicle market but also receives competition from enterprises in the original market.
Apart from this, I create scatterplots to further analyze the relationship between search volume and valuation in a business.
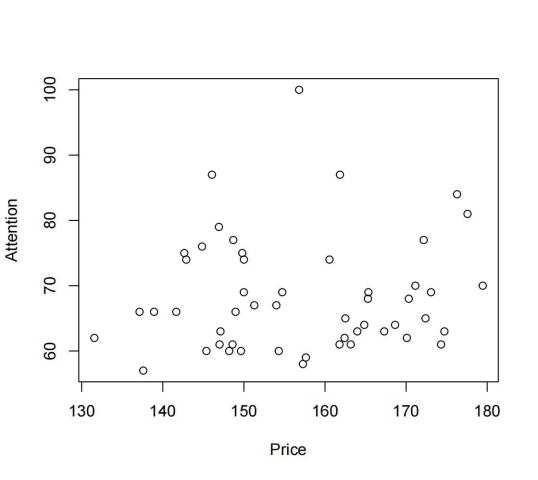
Fig. 3. Apple scatter plot.
In figure 3, the abscissa represents Apple's stock price data for 2021-2022, while the ordinate represents Apple's keyword search volume data for the year.
I find that the non-chronological scatter plot showed the effect of stock price volatility on attention. There are more low attention values distributed on the abscissa with small price fluctuations, while there are larger attention values distributed on the abscissa with large price fluctuations.
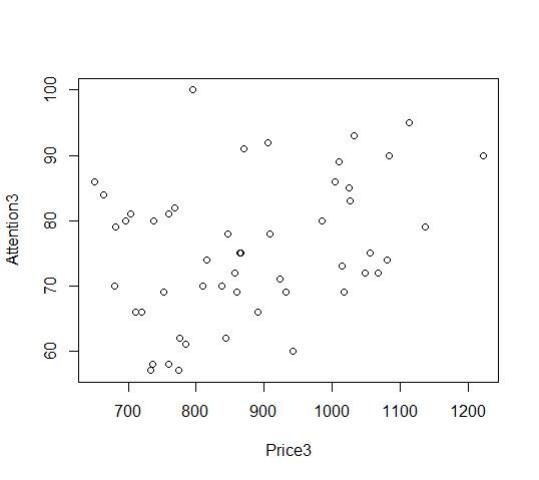
Fig. 4. Tesla scatter plot.
In figure 4, the abscissa represents Tesla's stock price data for 2021-2022, while the ordinate represents Tesla's keyword search volume data for the year.
We could also find a similar pattern with the data of Apple on the scatter plot. There are more low attention values distributed on the abscissa with small price fluctuations, while there are larger attention values distributed on the abscissa with large price fluctuations. This discovery shows that investor attention is affected by stock price fluctuations in both companies.
After I analyze the weekly data of the stock price and keyword search volume of Apple and Tesla in the past year. I find that there is a significant difference in the relationship between the search volume and the stock price of companies with recent popularity and those with past popularity. Therefore, although the search volume indicator can reflect some stock price changes, the disparity according to the individual stocks will make it difficult to estimate some stocks with a long popularity period.
Next, I analyze the keyword search volume and index data of the representative stock index of China and the representative stock index of the United States, to produce the result in the world stock market.
Fig. 5. The attention and price of SP500. (Left longitudinal axis represents attention to value and the right longitudinal axis represents index value.)
Fig. 6. The attention and price of SSEC. (Left longitudinal axis represents attention to value and the right longitudinal axis represents index value.)
In figure 5 and figure 6, the line represents the change in the stock prices of the two indices from August 2021 to August 2022, while the clustered data below the line represents the weekly keyword search volume of the corresponding index.
By looking at the data of two famous global stock indexes, we find that their fluctuation pattern of them is very similar to the previous company data. Though share prices move more gently than corporate data. However, the fluctuation pattern of keywords is more intuitive. It's a straightforward way of showing attention to volatility when stock prices go down or up. Especially at the time of implementation of some important national policies that we mentioned earlier. It shows the phenomenon that stock price fluctuation is affected by people's attention. Then I check the regression data and scatter plot.
Table 2. SP500 and SSEC’s regression
|
SP500 |
SSEC |
|
|
Search Vol |
-3.106 ** (1.501) |
0.218 (0.329) |
|
Trading Vol |
-0.000 (0.000) |
-0.000 ** (0.000) |
|
Turnover |
6.786 (5.530) |
348.245 ** (137.703) |
|
lTrading Vol |
0.000 ** (0.000) |
0.000 ** (0.000) |
|
lTurnover |
2.309 (5.605) |
-285.808 ** (131.721) |
|
PE |
23.622 *** (8.259) |
208.022 *** (16.914) |
|
Closing Price |
0.642 *** (0.076) |
0.300 *** (0.058) |
|
Cons |
944.504*** (330.622) |
-318.289 *** (109.190) |
|
R-squared |
0.92 |
0.98 |
*** p<.01, ** p<.05, * p<. 1, l=lag, Vol=Volume, (Std.Error). The sample period is from August 2021 to August 2022.
Fig. 7. SP500 scatter plot.
Fig. 8. SSEC scatter plot.
In the table2 above, I used 6 additional variables to test the correlation between keyword search volume and stock index.
In figure7 and figure8, the abscissa represents the stock indices data for 2021-2022, while the ordinate represents the relevant keyword search volume data for the year.
It is clear that the result for Tesla is very different from the SP500. The search volume in the figure shows an obvious negative correlation in both regression data and scatter plots. Besides, their significance is high enough to be considered as a reference. The relevance of the date reflected in this graph is contrary to the earlier claim of Grinblatt and Keloharju [6]. They find evidence that investors are reluctant to realize losses. But my scatter plot and regression show a very different result. It shows attention goes down as the index goes up. Although the scatter plot lacks the existence of time order, this conclusion cannot be deterministic. But a sufficient amount of data trends can objectively reflect a possible law. Besides, the previous chart, which shows the chronology, also clearly shows the strong increase in attendance after the stock price falls.
I do not have sufficient theories and models to prove this conclusion, so I have no reasons to doubt the accuracy of the views put forward by these two gentlemen. In this scatter plot, we can still see the same result as the previous test: whenever the index fluctuates greatly, the corresponding ordinate attention will rise significantly; while when the index fluctuates gently and the abscissa price changes are small, the corresponding ordinate attention will be low and densely distributed.
Compared to SP500's data, the correlation between search volume and stock price in SSEC's data is less significant than other fundamental indicators. I am personally convinced that this regional difference comes from the distribution of the investor. A large percentage of investors in the U.S. market are institutional investors, while the Chinese market is mostly individual investors. Compare to institutional investors, individual investors have a weaker sensitivity to information. In this case, this weakness will result in a situation where market attention does not reflect stock prices. Although scatter charts can reflect stock price fluctuations caused by search volume, it is difficult to measure stock prices in the Chinese market with this metric.
After using the first indicator search volume to measure the impact of attention on stock prices. Then I will replace investor sentiment with a sentiment index as a second indicator to measure the impact of investor attention on stock prices

Fig. 9. The SP500 sentiment index.

Fig. 10. The performance of SP500.
Figure 9 is a line chart of the quantified investor sentiment index and figure 10 shows the SP500's performance over the past 5 years. When we match up the timelines and compare the two curves from 2018 onwards, we can confirm that they move in much the same direction. This means that when the stock price goes up, people's sentiments increase and their attitude becomes optimistic, and when the stock price goes down, people's sentiments decreases and their attitude becomes pessimistic.
Conclusion
This paper shows that the fluctuation of the stock price changes with investor attention. Besides, by looking at the regression data of tables, I found there are significant disparities in sensitivity to attention in different companies and regions which may cause by exogenous factors such as competitive markets and investor distribution. By observing the analysis results of the combination and scatter plots, the increased attention will cause the fluctuation of the stock price and the fluctuation of the stock will also lead to attention rise. Hence, the higher the attention of investors, the greater the volatility of stock prices. Besides, I also analyze the sentiment data and it comes out that U.S. stocks perform better when sentiment is high, and vice versa. This explains positive sentiment signals (negative sentiment signals) will lead stock prices to rise (fall).
These two conclusions are helpful for investors to estimate investor attention by using search volume or sentiment index. Then investors may use the conclusion to deduce the possible fluctuation trend of the stock in the future.
I use keyword search volume and sentiment index to visualize unquantifiable attention. The point is to let attention which is closely related to investor behavior. Apply it to everyday investment decisions. I used a variety of graphs and regression models to examine both chronological and non-chronological data to summarize patterns. To be precise, I look for reference data from different areas and different situations to determine a uniform conclusion. In addition, in this paper, I mentioned that there is a big difference between my analysis data and the result of Grinblatt and Keloharju [6], although I do not have enough research results to prove my point, I still hope that readers can think dialectically about this issue and explore it further. Apart from this, regarding the large difference in attention between individual companies that I found, although I use the same popularity data to test it many times, I still could not explain the difference in attention between individual companies. I will continue to study this area and hope that more excellent scholars will join the relevant research.
References
[1]. Kahneman D. Attention and effort[M]. Englewood Cliffs, NJ: Prentice-Hall, 1973.
[2]. Peng L, Xiong W. Investor attention, overconfidence and category learning[J]. Journal of Financial Eco-nomics, 2006, 80(3): 563-602.
[3]. Barberis N, Shleifer A, Vishny R. A model of investor sentiment[J]. Journal of financial economics, 1998, 49(3): 307-343.
[4]. Hsieh S F, Chan C Y, Wang M C. Retail investor attention and herding behavior[J]. Journal of Empirical Finance, 2020, 59: 109-132.
[5]. Baker M, Wurgler J. Investor sentiment in the stock market[J]. Journal of economic perspectives, 2007, 21(2): 129-152.
[6]. Grinblatt M, Keloharju M. What makes investors trade?[J]. The Journal of Finance, 2001, 56(2): 589-616.
[7]. Barber B M, Odean T. Boys will be boys: Gender, overconfidence, and common stock investment[J]. The quarterly journal of economics, 2001, 116(1): 261-292.
[8]. Li J, Yu J. Investor attention, psychological anchors, and stock return predictability[J]. Journal of Financial Economics, 2012, 104(2): 401-419.
[9]. George T J, Hwang C Y. The 52‐week high and momentum investing[J]. The Journal of Finance, 2004, 59(5): 2145-2176.
Cite this article
Yang,Z. (2023). The impact of investors’ attention on stock price. Advances in Economics, Management and Political Sciences,6,124-135.
Data availability
The datasets used and/or analyzed during the current study will be available from the authors upon reasonable request.
Disclaimer/Publisher's Note
The statements, opinions and data contained in all publications are solely those of the individual author(s) and contributor(s) and not of EWA Publishing and/or the editor(s). EWA Publishing and/or the editor(s) disclaim responsibility for any injury to people or property resulting from any ideas, methods, instructions or products referred to in the content.
About volume
Volume title: Proceedings of the 2022 International Conference on Financial Technology and Business Analysis (ICFTBA 2022), Part 2
© 2024 by the author(s). Licensee EWA Publishing, Oxford, UK. This article is an open access article distributed under the terms and
conditions of the Creative Commons Attribution (CC BY) license. Authors who
publish this series agree to the following terms:
1. Authors retain copyright and grant the series right of first publication with the work simultaneously licensed under a Creative Commons
Attribution License that allows others to share the work with an acknowledgment of the work's authorship and initial publication in this
series.
2. Authors are able to enter into separate, additional contractual arrangements for the non-exclusive distribution of the series's published
version of the work (e.g., post it to an institutional repository or publish it in a book), with an acknowledgment of its initial
publication in this series.
3. Authors are permitted and encouraged to post their work online (e.g., in institutional repositories or on their website) prior to and
during the submission process, as it can lead to productive exchanges, as well as earlier and greater citation of published work (See
Open access policy for details).
References
[1]. Kahneman D. Attention and effort[M]. Englewood Cliffs, NJ: Prentice-Hall, 1973.
[2]. Peng L, Xiong W. Investor attention, overconfidence and category learning[J]. Journal of Financial Eco-nomics, 2006, 80(3): 563-602.
[3]. Barberis N, Shleifer A, Vishny R. A model of investor sentiment[J]. Journal of financial economics, 1998, 49(3): 307-343.
[4]. Hsieh S F, Chan C Y, Wang M C. Retail investor attention and herding behavior[J]. Journal of Empirical Finance, 2020, 59: 109-132.
[5]. Baker M, Wurgler J. Investor sentiment in the stock market[J]. Journal of economic perspectives, 2007, 21(2): 129-152.
[6]. Grinblatt M, Keloharju M. What makes investors trade?[J]. The Journal of Finance, 2001, 56(2): 589-616.
[7]. Barber B M, Odean T. Boys will be boys: Gender, overconfidence, and common stock investment[J]. The quarterly journal of economics, 2001, 116(1): 261-292.
[8]. Li J, Yu J. Investor attention, psychological anchors, and stock return predictability[J]. Journal of Financial Economics, 2012, 104(2): 401-419.
[9]. George T J, Hwang C Y. The 52‐week high and momentum investing[J]. The Journal of Finance, 2004, 59(5): 2145-2176.