


1. Introduction
The global economic landscape continues its evolution, with an increasing inclination of individuals towards the acquisition of financial products [1] The year 2020, marked by the COVID-19 pandemic, deeply affected the global economy, leading to a widespread recession and challenges in production and employment worldwide. Governments responded with significant fiscal and monetary stimulus efforts to alleviate economic pressures. While aiding partial recovery, these actions raised concerns like inflation and fiscal sustainability [2, 3].
In the fund sector, global assets under management continue to grow, driven by investor demand for diverse investment choices and professional management. Sustainability and adherence to ESG standards are becoming increasingly important. Yet, challenges like market uncertainty, low interest rates, and intense competition compel fund management firms to innovate in both investments and business models. Stringent regulations also persist to enhance transparency and protect investor interests.[4]
In summation, the global economy and the landscape of fund development have undergone profound shifts in recent years. While the COVID-19 pandemic brought forth its share of challenges, it also spurred innovation and opportunities. The fund industry remains adaptable to evolving market conditions and investment trends to cater to investor needs. Nevertheless, diligent attention to the global economic recovery and the stability of financial markets remains imperative for an informed assessment of future developmental trends [5].
Hedge funds, in the literal sense, denote 'funds whose risks have been hedged.' However, hedge funds employ a diverse array of trading methodologies, encompassing hedging, arbitrage, and speculative strategies, all aimed at generating substantial returns. These concepts transcend the traditional risk mitigation and return assurance scope. Notably, the legal threshold for launching and establishing a hedge fund is considerably lower compared to a mutual fund, elevating the risk profile further.
A relative value hedging strategy represents a financial investment approach rooted in capitalizing on price differentials among various assets, securities, or markets. At its core, this strategy relies on the simultaneous purchase of one asset (or assets) and the shorting of another asset (or assets), enabling investors to profit from relative price movements while remaining insulated from overarching market trends [6].
The Bridgewater Pure Alpha Fund, managed by Bridgewater Associates, is a renowned hedge fund led by David Harding. The fund focuses on global macroeconomic analysis to identify trends and opportunities across diverse markets, aiming to achieve alpha—returns that outperform market benchmarks—by strategically investing based on macroeconomic insights. It avoids depending on specific market or asset movements and instead targets broader economic trends [4].
This study delves into the methodologies and impacts of employing relative value hedging strategies in hedge funds. Historical stock price data of four firms linked to artificial intelligence technology—namely, GOOGL, MSFT, NVDA, and TESLA—have been employed to attempt to establish a hedge fund characterized by a singular trading approach and a smaller scale. Backtesting is utilized to affirm the efficacy of relative value hedging strategies in mitigating risk and enhancing profits for hedge funds.
2. Methodology
Asset Selection: Picked correlated assets - stocks from the same industry, treasury bonds, and interest rate swaps for relative value hedging. Selected four AI-focused tech firms after thorough consideration. Calculated historical price-earnings ratios for GOOGL, MSFT, NVDA, and TESLA to guide long or short positions. Used Portfolio Visualizer to construct a relative value hedge fund portfolio. Employed Stata for backtesting various indicators. This section makes the following assumptions:
(1) For small-scale investment operations, this article sets the initial investment budget at $100,000.
(2) To simplify the portfolio construction portion of the relative value strategy, this research artificially specifies short positions: long positions = 4:6.
(3) Small investments correspond to short-term investments. In order to properly test the effect of the relative value hedging strategy, the short period the research chose will avoid periods of major economic turbulence [7].
2.1. Data Source
Obtain historical stock price data of the above companies from investing websites [8]
Retrieve industry price-to-earnings ratios from Simplywallst [9].
2.2. Variable Definition
Relative Value Calculation: Use the following formula to calculate relative value:
For stocks: relative value = (target company’s P/E - industry average P/E) / industry average P/E
Table 1: Variables’ definition.
Variable name | Explanation |
P/E | A company's price-to-earnings ratio, used to assess the valuation of its stock. |
P/B | A company's price-to-book ratio measures the relationship between stock price and net assets. |
R | Dividend yield. This is the ratio of a company's dividend payments to its stock price. A higher dividend yield may indicate a lower valuation. |
w | Portfolio weights |
i | Income |
r | Win rate |
2.3. Model Settings: Risk Parity Model
Constructing a relative value hedge fund benefits from a risk parity model. It enhances risk diversification and capital allocation, improving risk management and returns. Here are reasons why using a risk parity model is useful in this strategy [10]:
(1) Equilibrium risk diversification: Risk parity balances asset risks in portfolios, preventing outsized impacts.
(2) Reduce concentration risk: It diversifies positions, mitigating excessive risk concentration.
(3) Maintain market neutrality: Ensures market-neutral returns with balanced long and short positions.
The risk parity model lacks a single, universal formula, as it adapts to diverse investment strategies and asset combinations. Nevertheless, a general conceptual expression for balancing risk allocation among assets or securities is as follows:
First, consider a portfolio containing N different assets or securities. The weights of each asset are \( {w_{1}}, {w_{2}}, …, {w_{N}} \) . The sum of the total weights is 1, that is,
\( {w_{1}}+{w_{2}}+…+{w_{N}}=1 \) (1)
Second, assume that the risk of each asset (usually expressed as standard deviation or volatility) is \( {σ_{1}}, {σ_{2}}, …, {σ_{N}} \) respectively.
Then, the core idea of the risk parity model is to allocate capital so that each asset contributes equally to the overall risk. This can be expressed in the following way:
\( {w_{1}}*{σ_{1}}= {w_{2}}* {σ_{2}}= … = {w_{N}}* {σ_{N}} \) (2)
This equation can use numerical methods to determine weights that balance the risk weights of portfolio assets.
2.4. Summary Statistics
It can be seen from the figure1 that the stocks of these companies outperformed the S&P500 overall between 2019-2022 and showed a continuous upward trend.
Figure 1: Share price data of 4 companies (2019-2022). |
Data source: Investing [9] |
Photo credit: Original |
3. Empirical Results
This section uses stata to calculate quarterly returns, the following table presents the quarterly returns from 2019 to 2022 for NVDA, GOOGL, MSFT, TSLA, S&P500 (Index) and a portfolio constructed according to a relative value hedging strategy.
Table 2: Quarterly Yield.
NVDA | GOOGL | MSFT | TSLA | Index | Portfolio | |
2019-Jan-01 | 0.311 | 0.116 | 0.160 | -0.073 | -0.224 | 0.278 |
2019-Apr-01 | -0.073 | -0.074 | 0.133 | -0.196 | -0.048 | 0.414 |
2019-Jul-01 | 0.079 | 0.130 | 0.043 | 0.105 | 0.064 | 0.057 |
2019-Oct-01 | 0.313 | 0.095 | 0.129 | 0.583 | -0.125 | -0.623 |
2020-Jan-01 | 0.203 | -0.105 | 0.059 | 0.398 | 1.094 | -0.698 |
2020-Apr-01 | 0.399 | 0.217 | 0.270 | 0.793 | -0.024 | -0.552 |
2020-Jul-01 | 0.382 | 0.043 | 0.048 | 0.810 | -0.101 | -1.161 |
2020-Oct-01 | -0.018 | 0.189 | 0.065 | 0.541 | -0.225 | -0.297 |
2021-Jan-01 | 0.051 | 0.175 | 0.066 | 0.009 | -0.157 | 0.298 |
2021-Apr-01 | 0.422 | 0.174 | 0.144 | 0.043 | -0.171 | 0.101 |
2021-Jul-01 | 0.049 | 0.095 | 0.043 | 0.144 | 0.049 | -0.015 |
2021-Oct-01 | 0.391 | 0.087 | 0.183 | 0.356 | -0.165 | -0.320 |
Average | 0.209 | 0.095 | 0.112 | 0.293 | -0.003 | -0.210 |
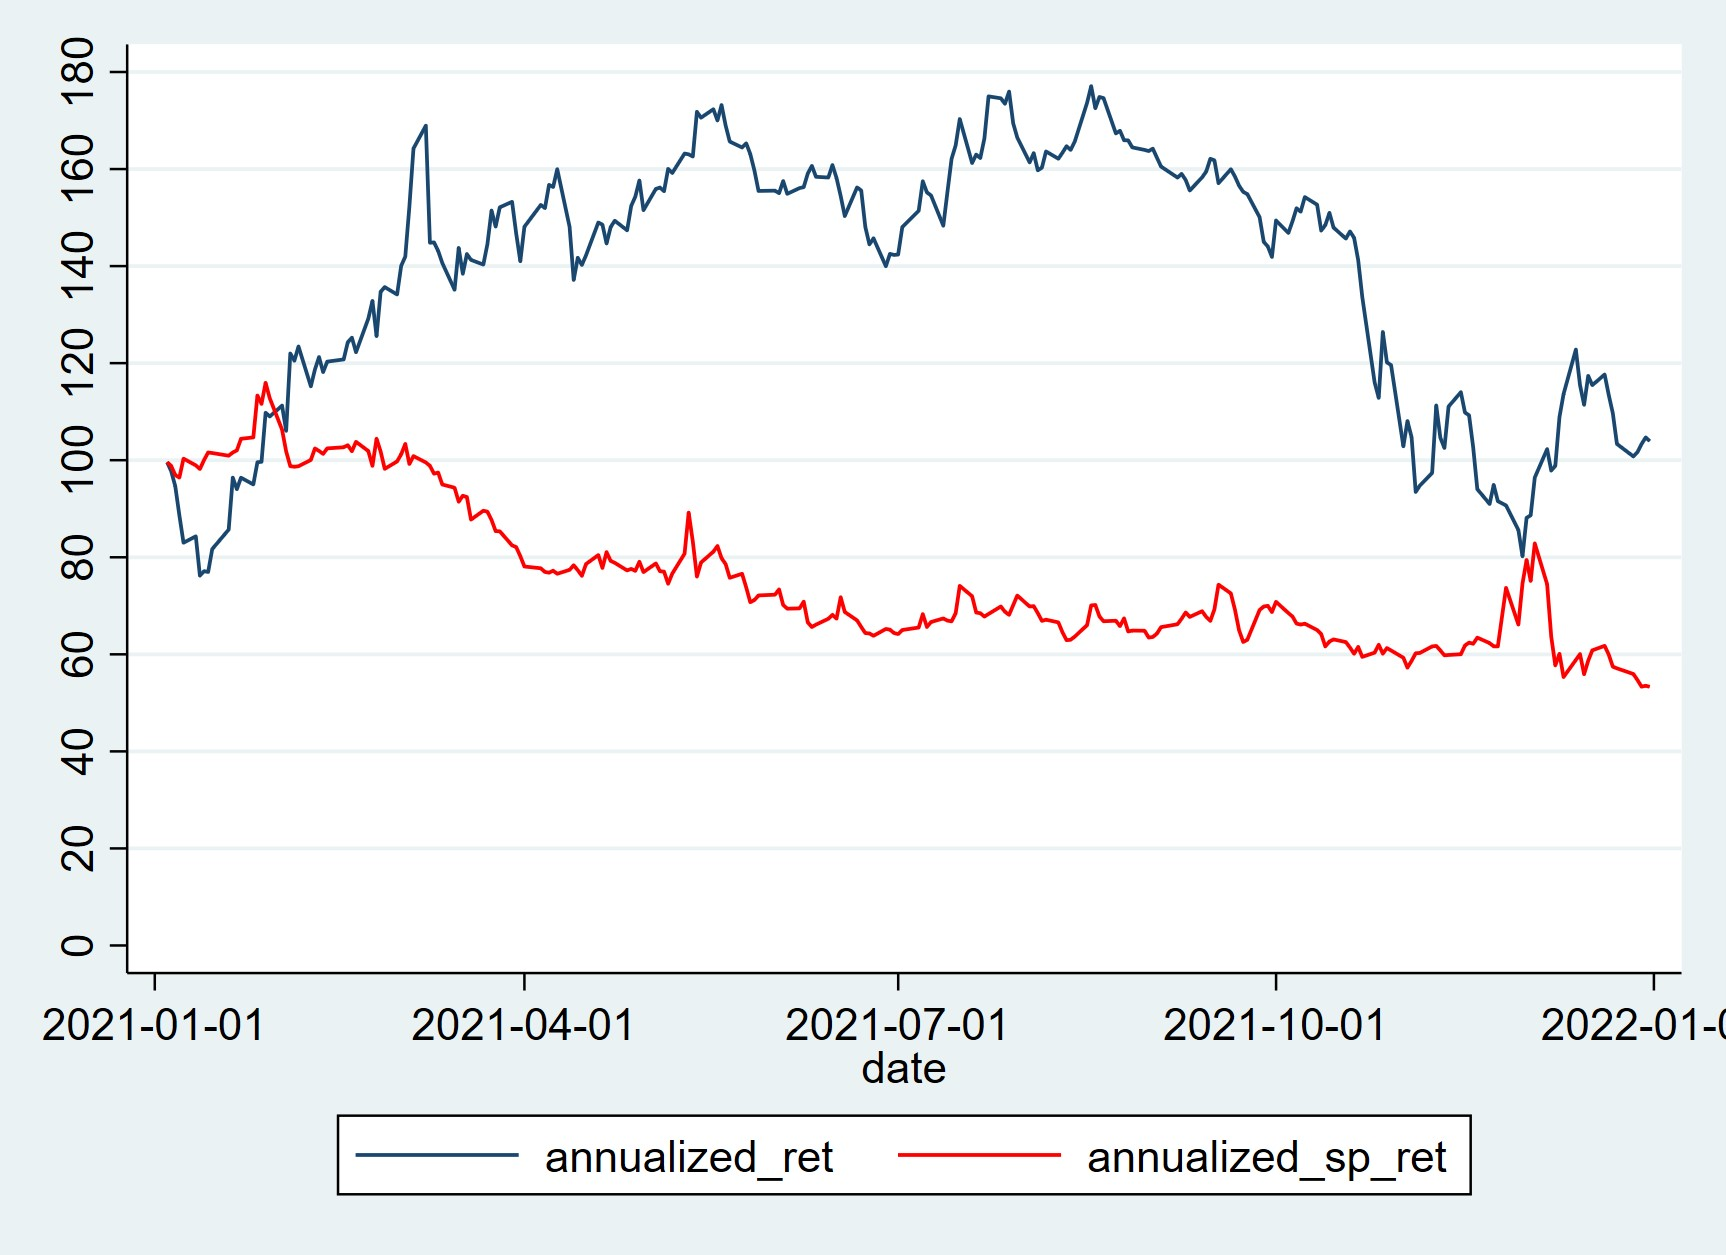
Portfolio results for 2019-2022 were disappointing; risk unchanged, returns below normal. Considering that the investment cycle should not be too long in the concept of small investors, the data in 2021 was selected for a more concise test.Then, this research used Stata to calculate annual rate of return, monthly income, winning rate and draw the following graph:
(1) Annualized Returns: The line chart mirrors annual income, showcasing risk reduction and income enhancement with the relative value hedging strategy.
|
Figure 2: Annualized Return Rates. |
Photo credit: Original |
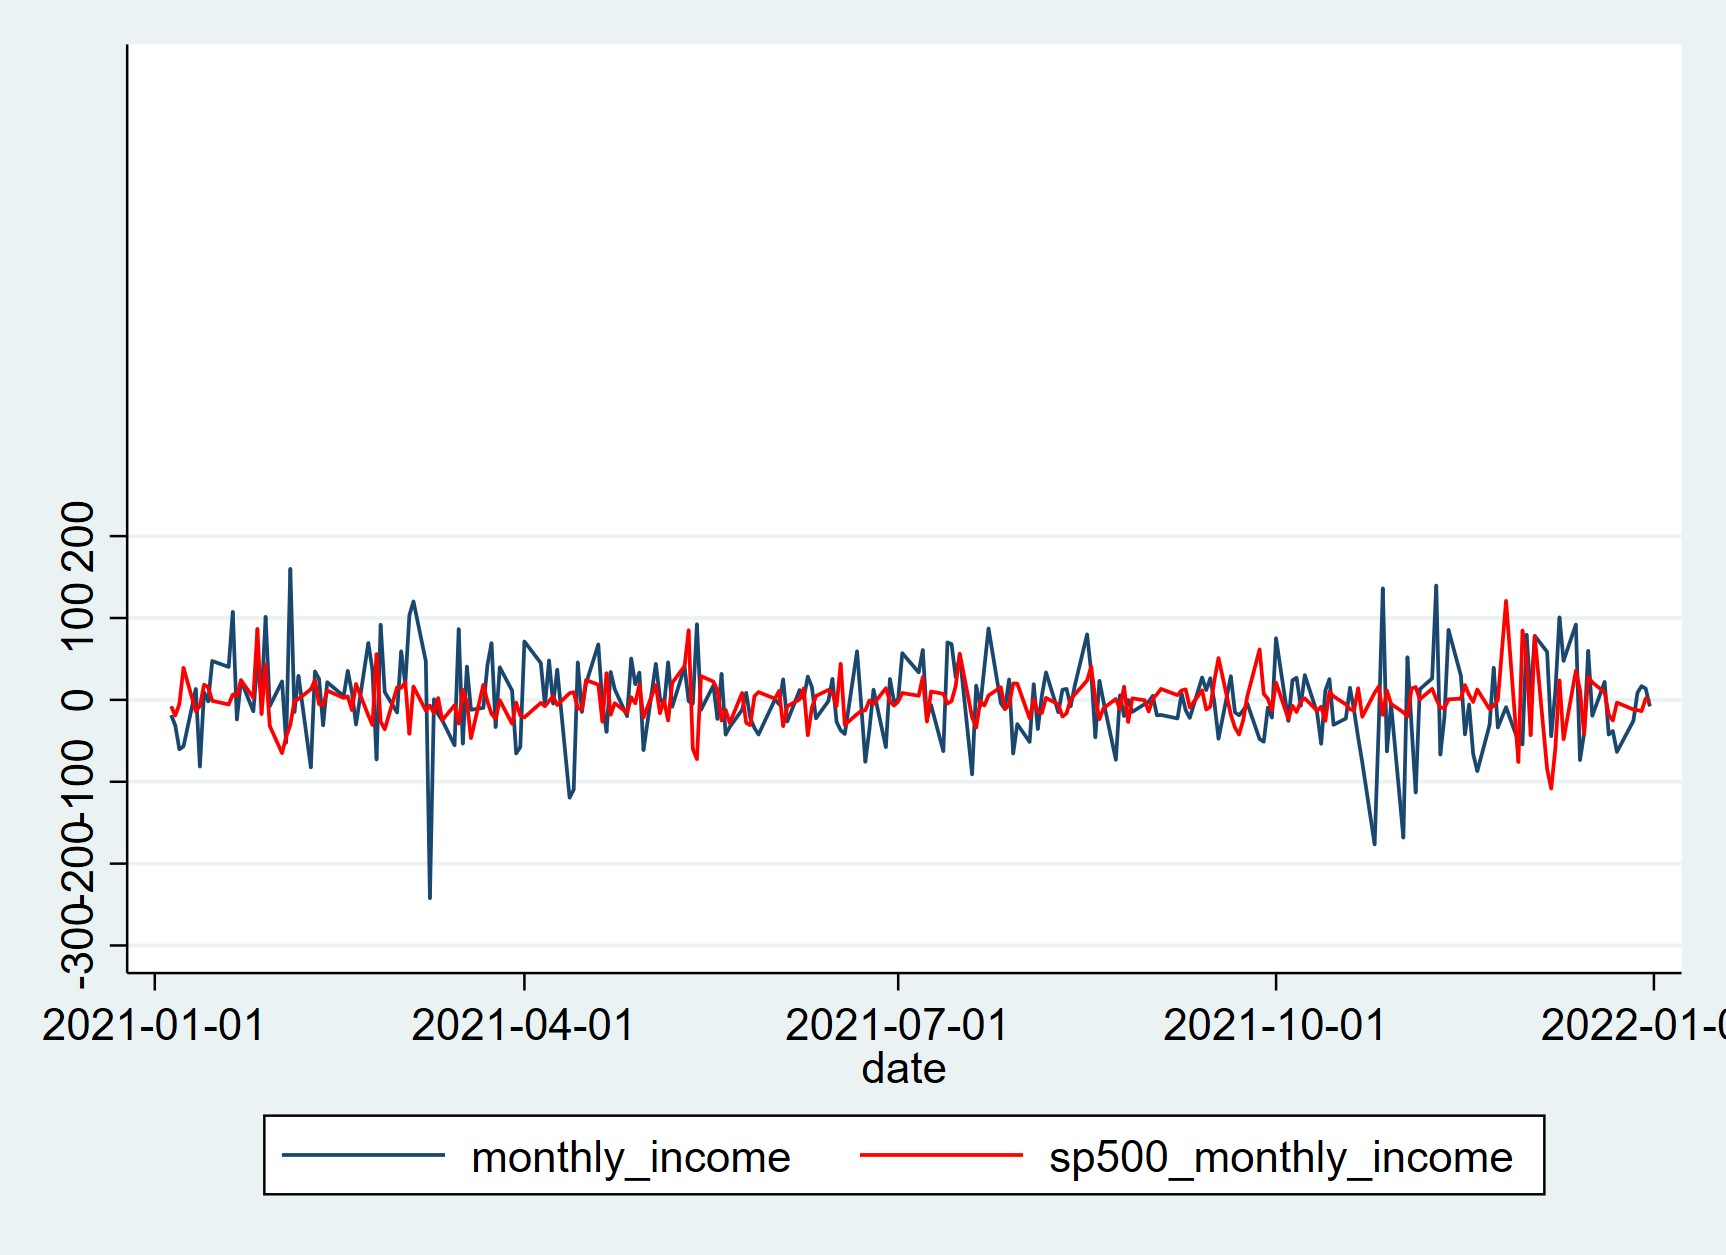
(2) Monthly Income: Analyzing monthly income, the hedge fund's performance appears moderate compared to the S&P 500.
|
Figure 3: Monthly Income. |
Photo credit: Original |
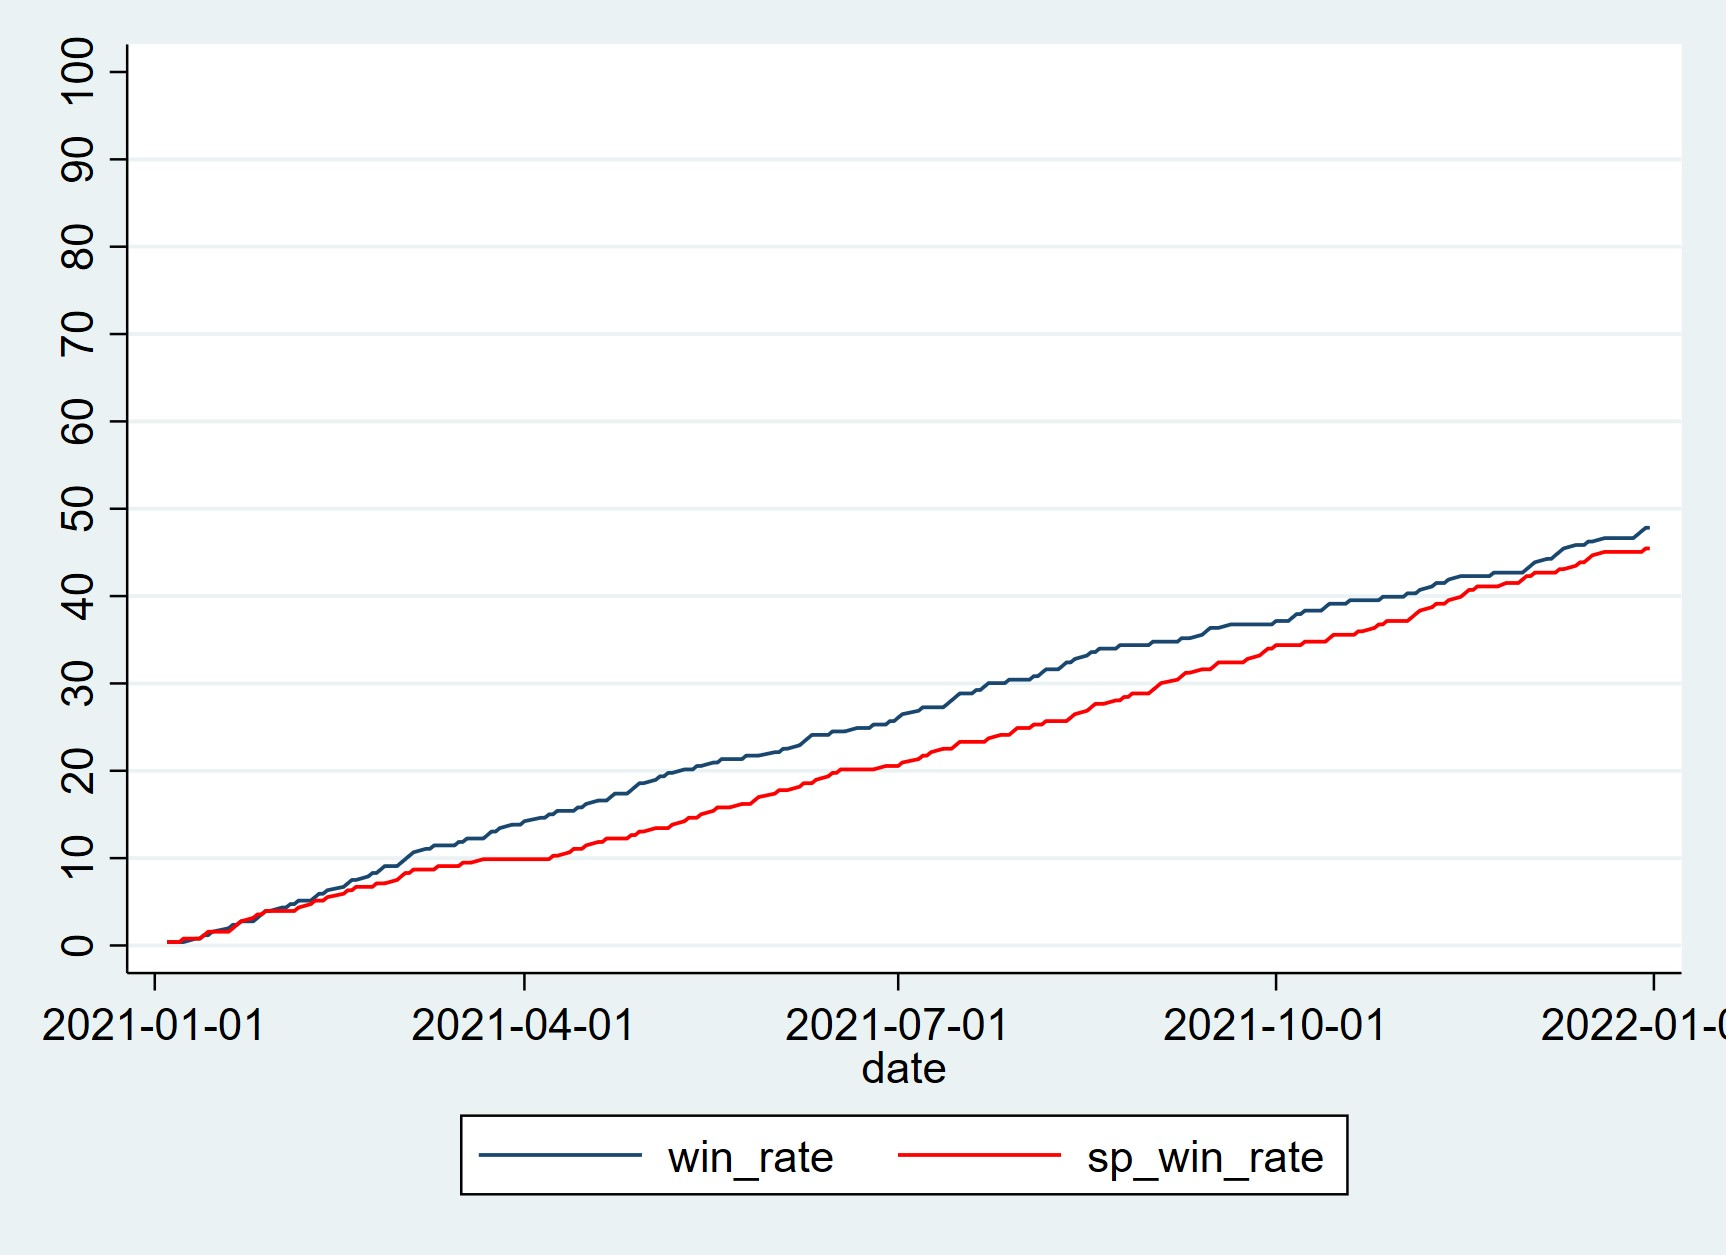
(3) Win Rate: The hedge fund consistently outperforms the S&P 500, indicating effective risk control with a relative value approach and lower vulnerability to market fluctuations.
|
Figure 4: Win Rates. |
Photo credit: Original |
4. Conclusion
The research can conclude that relative value hedge funds profit from asset price differences, independent of market trends, providing a huge financial advantage.
(1) Diverse Positions: Relative value hedge funds span stocks, bonds, commodities, forex, reducing specific portfolio risks. Their long-short approach fosters market neutrality for steady returns, drawing investors by lowering overall portfolio volatility.
(2) Market-Independent Gains: Unlike conventional strategies, relative value funds profit irrespective of market trends. They leverage asset price gaps, yielding returns in all market conditions.
(3) Robust Risk Control: Rigorous risk management includes stop-loss and take-profit strategies, guarding against excessive losses, a crucial aspect during market volatility.
This paper used a simple method to construct a small, highly usable short-term fund based on the relative value hedging strategy. While verifying the effectiveness of the relative value hedging strategy, it also provides a reference for people to participate in financial activities independently.
References
[1]. Vinod Garg. (2023). Pradhan Mantri Jan-Dhan Yojana (PMJDY): A Review of Financial Inclusion for Economic Development. Journal of Global Economy, Business and Finance (1), 2-5.
[2]. Kaehler Juergen & Weber Christoph S.(2023). Inflation in the aftermath of financial crises. Economic Modelling.
[3]. Gergely Baksay & Gábor P. Kiss. (2023). Fiscal Sustainability in Focus. Public Finance Quarterly (1).
[4]. Wang Siying. (2023). Research on hedge fund investment strategies (Master's thesis, Dongbei University of Finance and Economics), 24-32.
[5]. Stafylas Dimitrios, Andrikopoulos Athanasios & Tolikas Konstantinos. (2023). Hedge fund performance persistence under different business cycles and stock market regimes. North American Journal of Economics and Finance.
[6]. Folsom David,Hasan Iftekhar,Shen Yinjie (Victor) & Zhou Fuzhao.(2022).Hedge fund activism and internal control weaknesses. China Accounting and Finance Review (4).
[7]. Christensen Jens H. E. & Krogstrup Signe. (2022). A Portfolio Model of Quantitative Easing. The Quarterly Journal of Finance (04), 10-13.
[8]. Investing Homepage. https://cn.investing.com/
[9]. Symplywall Homepage. https://simplywall.st/dashboard
[10]. Lee Tae Kyun & Sohn So Young. (2023). Alpha-factor integrated risk parity portfolio strategy in global equity fund of funds. International Review of Financial Analysis, 2-5.
Cite this article
Liu,J. (2023). Construction and Analysis of Small-Cap Hedge Funds Based on Relative Value Hedging Strategies. Advances in Economics, Management and Political Sciences,64,288-293.
Data availability
The datasets used and/or analyzed during the current study will be available from the authors upon reasonable request.
Disclaimer/Publisher's Note
The statements, opinions and data contained in all publications are solely those of the individual author(s) and contributor(s) and not of EWA Publishing and/or the editor(s). EWA Publishing and/or the editor(s) disclaim responsibility for any injury to people or property resulting from any ideas, methods, instructions or products referred to in the content.
About volume
Volume title: Proceedings of the 2nd International Conference on Financial Technology and Business Analysis
© 2024 by the author(s). Licensee EWA Publishing, Oxford, UK. This article is an open access article distributed under the terms and
conditions of the Creative Commons Attribution (CC BY) license. Authors who
publish this series agree to the following terms:
1. Authors retain copyright and grant the series right of first publication with the work simultaneously licensed under a Creative Commons
Attribution License that allows others to share the work with an acknowledgment of the work's authorship and initial publication in this
series.
2. Authors are able to enter into separate, additional contractual arrangements for the non-exclusive distribution of the series's published
version of the work (e.g., post it to an institutional repository or publish it in a book), with an acknowledgment of its initial
publication in this series.
3. Authors are permitted and encouraged to post their work online (e.g., in institutional repositories or on their website) prior to and
during the submission process, as it can lead to productive exchanges, as well as earlier and greater citation of published work (See
Open access policy for details).
References
[1]. Vinod Garg. (2023). Pradhan Mantri Jan-Dhan Yojana (PMJDY): A Review of Financial Inclusion for Economic Development. Journal of Global Economy, Business and Finance (1), 2-5.
[2]. Kaehler Juergen & Weber Christoph S.(2023). Inflation in the aftermath of financial crises. Economic Modelling.
[3]. Gergely Baksay & Gábor P. Kiss. (2023). Fiscal Sustainability in Focus. Public Finance Quarterly (1).
[4]. Wang Siying. (2023). Research on hedge fund investment strategies (Master's thesis, Dongbei University of Finance and Economics), 24-32.
[5]. Stafylas Dimitrios, Andrikopoulos Athanasios & Tolikas Konstantinos. (2023). Hedge fund performance persistence under different business cycles and stock market regimes. North American Journal of Economics and Finance.
[6]. Folsom David,Hasan Iftekhar,Shen Yinjie (Victor) & Zhou Fuzhao.(2022).Hedge fund activism and internal control weaknesses. China Accounting and Finance Review (4).
[7]. Christensen Jens H. E. & Krogstrup Signe. (2022). A Portfolio Model of Quantitative Easing. The Quarterly Journal of Finance (04), 10-13.
[8]. Investing Homepage. https://cn.investing.com/
[9]. Symplywall Homepage. https://simplywall.st/dashboard
[10]. Lee Tae Kyun & Sohn So Young. (2023). Alpha-factor integrated risk parity portfolio strategy in global equity fund of funds. International Review of Financial Analysis, 2-5.