


1. Introduction
Disparity, despite its infamous name, may correlate with economic growth. Dollar and Kraay find that the income of the poor tends to rise and fall with average income, implying that inequality does not affect growth [1]. On the other hand, Ostry find that lower net inequality is robustly correlated with faster and more durable growth [2]. Yet, uncontrolled inequality may tend to unequal benefit of growth. For instance, Ravallion finds that higher initial inequality reduces the poverty elasticity of growth, meaning that growth benefits the poor less when inequality is high [3], while some suggested that changes in poverty can be attributed to changes in mean income, relative distribution, and population composition [4]. It is thus reasonable to conclude that the extent of disparity is crucial in determining its economic potential, stressing the role of policies in influencing the distribution of income and wealth in society. Empirical studies have shown that both institutions and policies matter for global economic disparity. For example, Acemoglu show how institutions that protect property rights and limit the power of elites foster economic development and reduce inequality [5]. Similarly, Milanovic shows how different policy regimes have different effects on inequality within and between countries [6]. In addition, globalization and technological change have complex and heterogeneous effects on global economic disparity. Feenstra and Hanson show how trade liberalization and skill-biased technological change increase the demand for skilled workers relative to unskilled workers [7]. Likewise, Goldberg and Pavcnik review how trade and technology affect poverty and inequality in developing countries [8]. The attempt of this essay is therefore to examine what stance should China adopt in global disparity. The essay is separated into four part, introduction, application, stance, and policy, each incorporating data and analysis to evaluate the different opportunities and risks of these aspects for China and its partner countries.
2. Economic Impact of Global Disparity
Economic disparity is the unequal distribution of income and opportunity between different groups in society. This could happen not only to individuals but also to nations worldwide. Although the world’s wealth is growing, the entity that is trapped in poverty is not very likely to climb up.The disparity between developed and less developed countries has been consistent from 1820 to 2018[9].
The economic impact of disparity is detrimental to the growth of global GDP and the total welfare of humankind. This essay aims to articulate the impact brought by disparity, the stance we recommend China to take, the practical tools to handle, plus the benefit & risk for those actions.
2.1. Lack of world economy motor in long run
2.1.1. Solow model
Solow model is a macro growth function that has input of labor, physical capital, and productivity level. National output function: y = f(k) , Human capital = L(labor) x E(education level), physical capital = k( capital per capita)Xo(population), productivity level= A(ideas of way to allocate resources)[10].
The capital per capita is the most decisive factor that directly influences national output. National output increases when capital per capita increases. However, the growth rate of capital per unit capital will gradually decrease when nations have a larger amount of accumulated Capital and reach a steady state.
Besides the diminishing marginal return of capital, capitals naturally go through depreciation at a function of time because they either need repair or will naturally wear out. When net new investment (national saving * saving rate) that’s directly correlated to the national income curve, meet with the capital devaluation curve. Countries will eventually enter a steady-state level of capital per capita, and when the level of capital per capita stops at a constant value, the output will end the catching up growth phase and enter a steady-state that only experienced cutting-edge growth.
2.1.2. Application
The Solow model illustrates how developing countries with less original capital have more potential to grow their capital per capita and will have a higher economic growth rate. When applying the model to the world economy, our advising team realizes that developing countries could be the motor that stimulus global economic growth. China and India are two developing countries that are 2nd and 5th in GDP ranking [11], and their growth rate in 2010-2020 is 7.91% and 5.9% while the global during 2010-2020 growth rate is only 2.84% [12]. China and India's growth rate will exceed the world average in the period, and their large economic volume and high growth rate make them become the factors that push the world economy to grow in the past decade.
However, when the disparity between the rich and the poor is large, developing countries have no way to participate in the global economic cycle or participate in very few components. Poverty traps in poor countries cause low national income and low market confidence, which results in low investment levels on capital. A lot of developing countries also may have capital flights problems and a lack of inward FDI. The inadequate investment slows down the accumulation of the capital of these developing countries, and the catching-up growth phase cannot be reached. China and India cannot be the motor of the world economy forever because when capital per labor increases, the growth rate of capital per capita decreases, therefore growth rate of GDP per capita will also decrease. The world needs countries that have less capital accumulation to become the new motors of the world economy that provide new markets for the world. Countries’ economy is highly connected by various trade in the modern era, if poor developing countries fail to be responsible for pushing world economy growth, developed countries’ growth rate will also slow down.
2.2. Economic Impact of Migrant Crisis
Developed countries need to withstand the economic and social impact of immigration. Since human instinct is to seek benefit. When disparity is at present, it creates a lot of immigration problems, many of which are illegal. For example, during the 2015 Europe migrant crisis, Sweden took in approximately 163,000 refugees, and this led to a dramatic increase in the crime rate of 27.79 percent [13]. The governments of countries receiving refugees had to increase the spending ratio on public security, causing a decrease in social welfare.
On the other hand, the outflow of these young and middle-aged laborers will lead to a decrease in the country's fertility rate. In the long run, the emergence of a series of social problems such as a decrease in the employee population and an aging population will decrease the labor supply. For instance, the fertility rate in Syria is currently 2.84 births per woman, which is lower than in recent years. This decreasing fertility rate trend is expected to continue and is expected to be between 1.4 births to 2 births per woman by 2025 [14]. As a result, without foreign aid, some developing countries would be difficult to promote its economic growth.
2.3. Global Crisis of Pandemic
Under the threat of COVID-19, poor countries will make the global fight against the epidemic more difficult. As a result, the recovery of the global economy is nowhere in sight. Because of poverty, their medical conditions are poor, and the infection rate and death rate are higher. This decreases the labor supply of the country. For example, Peru, a less developed country located in western South America, has a total of 210 thousand coronavirus deaths [15].
Under these circumstances, many people who are rich enough will do everything possible to flee to developed countries for better treatment. This makes it easier for the epidemic to spread to other areas. For example: at the outbreak of COVID-19, India's billionaires’ private jets almost took off at the same time to the developed countries for refuge. Some people will choose to smuggle. As United News Network reported, when cases in Laos and Cambodia broke out, Vietnam would be on high alert to prevent smuggling [16].
3. Recommended Stance – Global Perspective
Taking a global stance would increase China’s export output by investing in the potential of purchasing power of developing countries. China’s value of export is heavily determined by developing countries' economic growth. China is the world’s largest export country, with almost 2.6 trillion U.S. dollars, constituting 19 percent of the GDP in 2021 [17]. By taking a more global perspective stance, providing development aid to developing countries would improve their economy, therefore achieving higher GDP. This leads to an increase in purchasing power of these developing countries, allowing them to import more of China’s goods.
In addition, collaboration in trade, according to the comparative advantage theory, would benefit the people of both countries; cooperation in finance may resist certain risks from the fluctuation of interest & exchange rate; assistance in anti-epidemic can enable the global economy to recover as soon as possible.
Although providing development aid would have a short-term cost of a decrease in government spending in China, there would be an economic benefit in the long run, which is that China can have access to lower-priced or scarce resources from other developing countries. For example, the Belt and Road (explained in 5.1) can grant China access to natural resources, such as the Simandou mine, at relatively low operating costs by building relations with developing countries and facilitating transportation [18]. These development projects with developing countries can shift the long-run aggregate supply to the right, resulting in an outward shift in the production possibilities curve.
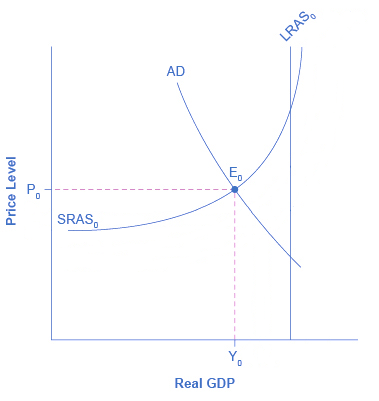 Figure 1: Interactive graph [19].
Even though people might argue that Isolationist policies like tariffs protect local producers, the Isolationist stance of countries will limit natural resources supply and decrease global market share for their local producers. When a government imposes a tariff on another country, the price of natural resources that are imported from that country increase too. The producer will face a higher producing cost which will decrease their producer surplus like how free trade does. Also, the tariff-originated country will likely get a tariff imposed on them in return. This can decrease local producer profit gained from international trade because their product will face a rise in price in the foreign market, which means a decreased amount of quantity demanded. The US started a trade war with China in 2018 by increasing tariffs on a list of chines products. China imposed a tariff in return, and according to a spokesperson for the American Farm Bureau, farmers have lost the vast majority of what was once a $24 billion market in China” as a result of Chinese retaliatory actions [20].
As a result, we propose to launch thorough and deep strengthen cooperation with developing countries around the world, rather than unilateralism and isolationism. This stance is beneficial to both parties and is more beneficial to the prosperity and stability of the world.
4. Tools to Carry Out Stance of Global Stance
4.1. Belt and Road Initiative
The “Silk Road Economic Belt” is referred to as the "Belt": It starts from mainland China and ends in Europe along the land-based Silk Road: one is to reach Europe via Central Asia and Russia; the other is from Xinjiang to the Indian Ocean, Central Asia and West Asia via Pakistan Reach countries along the Persian Gulf and the Mediterranean Sea. The “Belt” connects the Asia-Pacific region and Europe, and the Central Asia region that passes through it.
The Belt and Road Initiative, which is along the maritime Silk Road. From mainland China, is crosses the South China Sea from the coastal ports to the Indian Ocean, extending to Europe, or from the coastal ports of mainland China to the South China Sea to the South Pacific.
4.1.1. Benefits of Belt and Road Initiative
In terms of Backed Lending System, China has invested in 51 projects including transportation and warehousing, mining, finance insurance, construction, and manufacturing in Kazakhstan with a total investment of more than 27 billion US dollars. These projects have created 20000 jobs in Kazakhstan [21].
A practical approach for mutual benefits is a resourced backed lending system. It is a system that allows all repayment made directly in natural resources or natural resource-related forms.” [22]. This system allows developing countries to attract foreign investment much easier because the resources in the developing countries guarantee return for the investor which largely decreases the risk to invest in developing countries. China actively used this lending system in past loans, and they should insist on using it because China gains a lot of useful resources they need for return. China lent Ghana 67 billion RMB to build hospitals, colleges, and even offices for the national security department. Ghana later pays back loans by selling the right to extract aluminum in Ghana to China with a 50% price deduction. Aluminum resources are scarce in China but are also essential for China’s next step development because it is listed in the list of strategic minerals published by the Chinese government in 2016. Other African developing countries also possess 89% of gold, 16% Uranium in the whole world, which are also on the list. This spurns China to continue investment in Africa.
In terms of Lower Cost and Better Efficiency for Transportation and Trade, After the inner Mongolia Iran railroad was built in 2018, the sunflower seed oil that has high demand in Iran can be transported to Iran directly from the sunflower oil-producing site inner Mongolia. The railroad connects China's Xinjiang province to Iran's capital, Tehran, and the Persian Gulf, providing a more direct and efficient transportation option for goods traveling between China and Iran, as well as other countries in the region, reducing transportation costs and time for goods traveling between China and Iran [23]. The rise of trade protectionism, mainly in the United States, has made trade facilitation conditions appear particularly important in the complicated international competition. Therefore, exploring the impact of trade facilitation on China's trade is crucial. According to the Asian Development Bank report, the Belt and Road Initiative has the potential to reduce trade costs by 1.1 to 2.2 percent for participating countries, which could translate into significant economic gains [24]. The report also highlights the potential benefits of the initiative for poverty reduction and environmental sustainability.
In terms of Economic growth by the movement of human resources, International students can be a major source of income for the government. England earns more than 28 billion pounds for accepting international students to their schools in a year [25]. Students' expenses on tuition and consumer goods because of the multiplier effect can bring more value to a country's economy than it shows on paper. China is the largest supplier of international students in the world, with a more convenient way to travel to developing countries on the Belt and Road after the construction of railroads and other infrastructures, a growing number of international students is a predictable future.
In terms of Economic growth by tourism, In terms of tourism, during the 13th Five-Year Plan, China sends 150 million Chinese tourists to countries along the Belt and Road and spend 200 billion US dollars on tourism. At the same time, 85 million tourists from countries along the Belt and Road visited China and spend a total of 110 billion US dollars [26]. Tourism has stimulated the development of the tertiary industry. Tourists' demand for food, entertainment, and accommodation creates more jobs for local people. The decline in the unemployment rate will increase the national growth rate (Okun's law).
4.1.2. Risk of Belt and Road
The instability of the region may jeopardize economic cooperation. For example, China’s long-term ambition to reduce its dependence on Australian iron ore suffered a major setback lately when Guinea’s junta ordered the immediate suspension of all activities at the massive Simandou mine.
4.2. Bilateral local currency swap agreement
A bilateral local currency swap agreement refers to an agreement signed between the central bank (monetary authority) of one country (region) and the central bank (monetary authority) of another country (region), stipulating that under certain conditions, either party can exchange a certain amount of local currency for equivalent value. The counterparty’s currency is used for bilateral trade and investment settlement or to provide short-term liquidity support for the financial market. After the expiration, both parties exchange their local currency, and the user of the funds pays the corresponding interest at the same time.
4.2.1. Reduce transaction risks
Establishing currency swap agreements with more developing countries’ measures may reduce transaction risks caused by exchange rate fluctuations. Bilateral currency swap agreements (BCSA) can effectively prevent international trade from being disrupted by exchange rate changes. Under this framework, the interest rate and exchange rate of the exchanged money are fixed.
A constant exchange rate allows a country to preserve its comparative advantage in the prices of its products from being disrupted by changes in the exchange rate. At the same time, the reduction of exchange rate risk has encouraged more companies to conduct cross-border business and investment. Liu, by modeling the trade data between China and the countries that have BCSA, found that the establishment of this framework can effectively promote China's import and export by smoothing exchange rate changes [27]. It is worth noting that BCSA is a mutual agreement, so both business parties will benefit from it.
BSCA facilitates the internationalization of RMB. Internationalization of RMB has always been a substantial goal for China from a currency perspective, as it reduces exchange rate risk by reducing the necessity for holding reserved currency. Yet, China’s capital account liberalization is considerably less developed and due to a continuous trade surplus, the liquidity of foreign RMB property is relatively low. These two factors consequently limit the foreign economic body from employing RMB trade settlement. BCSA from this perspective can reinforce the international movement of RMB to offset the lack in these elements and thus in the short and medium-term, continue the internationalization of RMB. Particularly when the level of capital account liberalization in the partner nation is comparatively high, through BCSA, China can further expand the RMB’s access to foreign financial markets augmenting foreign RMB settlement and participation of RMB in the foreign financial market [28].
4.2.2. Offshore labor-intensive industry to developing countries with lower labor cost
China is now at an interface between developing and developed countries. Relying on the labor-intensive manufacturing industry, China experiences rapid growth in the past 40 years and now becomes the second biggest economy in the world. However, as the economy grows, the labor cost gradually rises. Thus, it is essential for China to shift their focus industry from a labor-intensive industry that has low added value product to technology-intensive industries that have high added value product [29].
4.2.3. Benefit
Earning profit from a country’s advantages in product development and retailing provides a more sustainable growth [30]. The technical or commercial skills needed in these two phases makes it hard for other to find a substitute for the advantages, and these two phases of creating a product also require fewer energy resources, that is beneficial because the price and value of the developing and retailing phase will not be too interdependent with the fluctuation of resources price.
A suitable way the Chinese government can complete this transition is by moving labor intense manufacturing industry to other developing countries with a large population. Developing countries with large populations will have advantages of lower labor costs, so producing their decreased cost of production. China will then focus on providing machinery, design, guidelines, or other products that serve the product development process to guide production in developing countries. In this way, China efficiently accomplishes the shift from low added value phase to high added value phase of production without sacrificing access to cheaply manufactured products. (Human capital-break poverty trap) The manufacturing sector that China built in developing countries will also promote developing countries to produce in full potential by providing more employment, and when developing countries have an increase in national income, their demand for China’s product will naturally increase and our export will increase [31].
4.2.4. Risk
However, offshoring labor-intensive production lines to other countries might be risky. If China's supply of manufacturing goods highly reliant on other developing countries, their economy will become mutually interdependent with developing countries’ economy. This means that if developing countries face unexpected rise in cost of natural resources or human capital, China will experience a negative supply shock in the manufacturing market and the price of manufacturing good increase and quantity decrease. Some of the manufacturing goods that serve as intermediate products will further shift supply of other industries to the left and result in a decrease of GDP. However, various means to mitigate these risks can be effective. Diversification of supply chain, advancement in manufacturing technologies, and innovation in high-value industries, can all reduce reliance of China on other developing countries and propel more sustainable economic growth [32].
5. Conclusion
The paper argues that the global economic gap is not conducive to the world economy and human well-being, and China should adopt a global perspective and cooperate with developing countries to narrow the gap and promote mutual benefit and win-win. This paper suggests some possible ways for China to implement this stance, such as the Belt and Road Initiative, bilateral currency swap agreements, and the outsourcing of labor-intensive industries. The shortcoming of this study is that there is no large-scale empirical study, and more comprehensive judgments and conclusions will be made in the future by combining more data.
References
[1]. Dollar D., Kraay A., Growth Is Good for the Poor. Journal of Economic Growth 7(3):195-225 (2002)
[2]. Ostry J.D., Berg A., Tsangarides C.G., Redistribution, Inequality, and Growth. IMF Staff Discussion Note SDN/14/02 (2014)
[3]. Ravallion M., Growth, Inequality and Poverty: Looking Beyond Averages. World Development 29(11):1803-1815 (2001)
[4]. Bourguignon F., The Poverty-Growth-Inequality Triangle. Working Paper No. 125 (2004)
[5]. Acemoglu D., Johnson S., Robinson J.A., Institutions as a Fundamental Cause of Long-Run Growth. Handbook of Economic Growth 1:385-472 (2005)
[6]. Milanovic B., Global Inequality: A New Approach for the Age of Globalization. Harvard University Press (2016)
[7]. Feenstra R.C., Hanson G.H., Foreign Direct Investment and Relative Wages: Evidence from Mexico’s Maquiladoras. Journal of International Economics 42(3-4):371-393 (1997)
[8]. Goldberg P.K., Pavcnik N., Distributional Effects of Globalization in Developing Countries. Journal of Economic Literature 45(1):39-82 (2007)
[9]. Roser, M. (n.d.). GDP per capita. Our World in Data. Retrieved March 21, 2022.
[10]. Economicurtis. (n.d.). Solow growth model - videos - economicurtis. Google Sites. Retrieved March 21, 2022.
[11]. worldometer. (n.d.). GDP by country. GDP ranking. Retrieved March 20, 2022.
[12]. worldbank. (n.d.). GDP growth (annual %) - India. world GDP Data. Retrieved March 20, 2022.
[13]. Adamson, G. Migrants and Crime in Sweden in the Twenty-First Century. Soc 57, 9–21 (2020).
[14]. worldpopulationreview. (n.d.). Syria population data. Cato.org. Retrieved March 21, 2022.
[15]. Statista Research Department, S. R. D. (2022, March 14). China: Covid-19 vaccination doses 2022. Statista.
[16]. Border control tightened as Vietnam eyes Cambodia, Laos outbreaks.” VnExpress International. April 27, 2021.
[17]. Ma, Y. (2022). China: Share of exports in GDP 2021. Statista. Retrieved March 20, 2022.
[18]. Ker, P. (2020). China's African iron ore adventure will be filler, not killer. Australian Financial Review.
[19]. Jun, O. K. (n.d.). B) market equilibrium; demand and supply - microeconomics ind.. assignment. Google Sites. Retrieved March 21, 2022.
[20]. Hass, R., & Denmark, A. (2022). More pain than gain: How the US-china trade war hurt America. Brookings. Retrieved March 20, 2022.
[21]. Liu, W. (2018). The Belt and Road Initiative: China's leading role in global Governance. Carnegie Endowment for International Peace. Retrieved March 20, 2022.
[22]. Hwang, J., Mihalyi, D., & Adam, A. (2020). Resource-backed loans: Pitfalls and potential. Resource-Backed Loans: Pitfalls and Potential. Retrieved March 20, 2022.
[23]. Yii, K. J., Bee, K.-Y., Cheam, W.-Y., Chong, Y. L., & Lee, C.-M. (2018). Is Transportation Infrastructure Important to the One Belt One Road (OBOR) Initiative? Empirical Evidence from the Selected Asian Countries. Sustainability.
[24]. Li, J., & Xu, J. (2021). Economic impact of transportation infrastructure investment under the Belt and Road Initiative. Asia Europe Journal, 19(1), 1-24.
[25]. Hillman, N. (2021). The costs and benefits of international higher education students to the UK economy. HEPI. Retrieved March 21, 2022.
[26]. National Development and Reform Commission. (2016). 13th Five-Year Plan for Economic and Social Development of the People's Republic of China (2016-2020).
[27]. Liu, Z. Q., Zhang, J., & Zhang, H. B. (2020, December 8). Research on Bilateral Currency Swap Agreement and China's Export Growth Based on The Perspective of Exchange Rate Fluctuation Risk.
[28]. Dixon, C. (2014). The Internationalisation of the Renminbi (Rmb).
[29]. Li, M. (2018, December 1). "smiling curve" theory | download scientific diagram. Figure 2 - available via license: Creative Commons Attribution 3.0 Unported Content may be subject to copyright. Retrieved March 20, 2022.
[30]. Kurniawan, R. (2012). The influence of retailing mix performance and customer relationship marketing on customer loyalty.
[31]. Zhang, X. (2022). Value Chain and Technology-Based Complexity Analysis of China’s Manufacturing Exports. Mathematical Problems in Engineering
[32]. Lahane, S., & Kant, R. (2021). Evaluation and ranking of solutions to mitigate circular supply chain risks. Sustainable Production and Consumption.
Cite this article
Huang,J. (2024). Effect of Global Economic Disparity on World Economy and Human Welfare. Advances in Economics, Management and Political Sciences,66,268-275.
Data availability
The datasets used and/or analyzed during the current study will be available from the authors upon reasonable request.
Disclaimer/Publisher's Note
The statements, opinions and data contained in all publications are solely those of the individual author(s) and contributor(s) and not of EWA Publishing and/or the editor(s). EWA Publishing and/or the editor(s) disclaim responsibility for any injury to people or property resulting from any ideas, methods, instructions or products referred to in the content.
About volume
Volume title: Proceedings of the 3rd International Conference on Business and Policy Studies
© 2024 by the author(s). Licensee EWA Publishing, Oxford, UK. This article is an open access article distributed under the terms and
conditions of the Creative Commons Attribution (CC BY) license. Authors who
publish this series agree to the following terms:
1. Authors retain copyright and grant the series right of first publication with the work simultaneously licensed under a Creative Commons
Attribution License that allows others to share the work with an acknowledgment of the work's authorship and initial publication in this
series.
2. Authors are able to enter into separate, additional contractual arrangements for the non-exclusive distribution of the series's published
version of the work (e.g., post it to an institutional repository or publish it in a book), with an acknowledgment of its initial
publication in this series.
3. Authors are permitted and encouraged to post their work online (e.g., in institutional repositories or on their website) prior to and
during the submission process, as it can lead to productive exchanges, as well as earlier and greater citation of published work (See
Open access policy for details).
References
[1]. Dollar D., Kraay A., Growth Is Good for the Poor. Journal of Economic Growth 7(3):195-225 (2002)
[2]. Ostry J.D., Berg A., Tsangarides C.G., Redistribution, Inequality, and Growth. IMF Staff Discussion Note SDN/14/02 (2014)
[3]. Ravallion M., Growth, Inequality and Poverty: Looking Beyond Averages. World Development 29(11):1803-1815 (2001)
[4]. Bourguignon F., The Poverty-Growth-Inequality Triangle. Working Paper No. 125 (2004)
[5]. Acemoglu D., Johnson S., Robinson J.A., Institutions as a Fundamental Cause of Long-Run Growth. Handbook of Economic Growth 1:385-472 (2005)
[6]. Milanovic B., Global Inequality: A New Approach for the Age of Globalization. Harvard University Press (2016)
[7]. Feenstra R.C., Hanson G.H., Foreign Direct Investment and Relative Wages: Evidence from Mexico’s Maquiladoras. Journal of International Economics 42(3-4):371-393 (1997)
[8]. Goldberg P.K., Pavcnik N., Distributional Effects of Globalization in Developing Countries. Journal of Economic Literature 45(1):39-82 (2007)
[9]. Roser, M. (n.d.). GDP per capita. Our World in Data. Retrieved March 21, 2022.
[10]. Economicurtis. (n.d.). Solow growth model - videos - economicurtis. Google Sites. Retrieved March 21, 2022.
[11]. worldometer. (n.d.). GDP by country. GDP ranking. Retrieved March 20, 2022.
[12]. worldbank. (n.d.). GDP growth (annual %) - India. world GDP Data. Retrieved March 20, 2022.
[13]. Adamson, G. Migrants and Crime in Sweden in the Twenty-First Century. Soc 57, 9–21 (2020).
[14]. worldpopulationreview. (n.d.). Syria population data. Cato.org. Retrieved March 21, 2022.
[15]. Statista Research Department, S. R. D. (2022, March 14). China: Covid-19 vaccination doses 2022. Statista.
[16]. Border control tightened as Vietnam eyes Cambodia, Laos outbreaks.” VnExpress International. April 27, 2021.
[17]. Ma, Y. (2022). China: Share of exports in GDP 2021. Statista. Retrieved March 20, 2022.
[18]. Ker, P. (2020). China's African iron ore adventure will be filler, not killer. Australian Financial Review.
[19]. Jun, O. K. (n.d.). B) market equilibrium; demand and supply - microeconomics ind.. assignment. Google Sites. Retrieved March 21, 2022.
[20]. Hass, R., & Denmark, A. (2022). More pain than gain: How the US-china trade war hurt America. Brookings. Retrieved March 20, 2022.
[21]. Liu, W. (2018). The Belt and Road Initiative: China's leading role in global Governance. Carnegie Endowment for International Peace. Retrieved March 20, 2022.
[22]. Hwang, J., Mihalyi, D., & Adam, A. (2020). Resource-backed loans: Pitfalls and potential. Resource-Backed Loans: Pitfalls and Potential. Retrieved March 20, 2022.
[23]. Yii, K. J., Bee, K.-Y., Cheam, W.-Y., Chong, Y. L., & Lee, C.-M. (2018). Is Transportation Infrastructure Important to the One Belt One Road (OBOR) Initiative? Empirical Evidence from the Selected Asian Countries. Sustainability.
[24]. Li, J., & Xu, J. (2021). Economic impact of transportation infrastructure investment under the Belt and Road Initiative. Asia Europe Journal, 19(1), 1-24.
[25]. Hillman, N. (2021). The costs and benefits of international higher education students to the UK economy. HEPI. Retrieved March 21, 2022.
[26]. National Development and Reform Commission. (2016). 13th Five-Year Plan for Economic and Social Development of the People's Republic of China (2016-2020).
[27]. Liu, Z. Q., Zhang, J., & Zhang, H. B. (2020, December 8). Research on Bilateral Currency Swap Agreement and China's Export Growth Based on The Perspective of Exchange Rate Fluctuation Risk.
[28]. Dixon, C. (2014). The Internationalisation of the Renminbi (Rmb).
[29]. Li, M. (2018, December 1). "smiling curve" theory | download scientific diagram. Figure 2 - available via license: Creative Commons Attribution 3.0 Unported Content may be subject to copyright. Retrieved March 20, 2022.
[30]. Kurniawan, R. (2012). The influence of retailing mix performance and customer relationship marketing on customer loyalty.
[31]. Zhang, X. (2022). Value Chain and Technology-Based Complexity Analysis of China’s Manufacturing Exports. Mathematical Problems in Engineering
[32]. Lahane, S., & Kant, R. (2021). Evaluation and ranking of solutions to mitigate circular supply chain risks. Sustainable Production and Consumption.