


1. Introduction
Investment management is complicated, but capital allocation and portfolio management are crucial, especially for pension funds. Pension investment portfolios safeguard retirees and beneficiaries' finances and ambitions. The famous mean-variance model, a cornerstone of current portfolio theory, is used to analyze such portfolios in this assignment. Harry Markowitz's mean-variance model balances risk and return and is still used for portfolio optimization. This model considers asset correlations, co-variances, anticipated returns, and risks. Portfolio weight optimization allows investors to maximize returns while managing risk, which aligns with pension fund management goals.[1] The task involves analyzing equities from research and technology, medical care, and new energy industries. We must underline that good pension fund management relies on portfolio theory as we begin our examination. The next parts will explain the mean-variance model, data gathering, and industry comparisons, and finish with a thorough analysis of our results' real-world implications. This journey emphasizes portfolio management's role in pension recipients' financial destiny.
2. Literature Review
Recent research compares robust portfolio selection optimization methods. This study tests multiple resilient optimization models based on common risk indicators using 2005–2020 US market data. The authors intend to fill a literature gap by empirically evaluating robust optimization models in portfolio selection.[2]
A detailed analysis on optimizing the stock portfolios of active Tehran Stock Exchange businesses based on price projection is presented. The authors begin by reviewing stock portfolio optimization and risk research history. Next, the authors provide a technological process, Markov decision-making, and machine learning learning algorithm-based multi-objective stock portfolio selection and optimization model.[3]
Research on portfolio optimisation of financial commodities with energy futures is important to the literature and the field. They examine the effects of diversifying commodity futures portfolios with five energy futures. The study has a complete literature review, data and technique overview, study results, and implications section. [4]
Arcuri, Gandolfi, and Laurini focus on institutional investors and propose a unique asset allocation strategy for risk-averse investors with long-term goals like the Italian Foundations of Banking Origin (FBOs). Their research relies on the Robust Conditional VaR (R-CVaR) technique, which accounts for tail risk and addresses many Markowitz model issues. R-CVaR beats the Markowitz portfolio even using a mean-variance measure.[5]
Wu et al. optimized portfolios and risk budgets using machine learning. They studied how AI may simplify portfolio structures and deconstruct risk into risk factor commitments. The complex interplay between classic portfolios and neural networks contrasted with typical dimensionality reduction approaches. Kenneth R. French-Data monthly Net Asset Value was used to examine risk budgeting and portfolio techniques on 21 assets. Long-only portfolios were complicated by boundary constraints. The study found that machine learning portfolio PCA and PLS factors favor factor intermediates over auto-encoders. In financial conditions, neural networks outperformed sophisticated architectures, especially amid market volatility.[6]
Modern financial tools changed conventional economies throughout the Fourth Industrial Revolution, according to Ma et al.. Rapid financial and technology advances necessitate new investment approaches that embrace digital financial innovations, according to this research.At the same risk threshold, bitcoin portfolios beat traditional portfolios. Ethereum was more diverse than Bitcoin, highlighting the need of portfolio diversification.[7]
Navarro et al. 2023 examined how the COVID-19 epidemic affected the Philippine stock market. Technical Analysis, K-means Clustering, and the Mean-Variance Portfolio Optimization Model were used to develop TAKMV. The research analysed 2018 and 2020 Philippine Stock Market data to optimise portfolio returns and minimise risk.[8]
Padhi et al. presented a two-pronged stock market forecasting strategy. Their method helps traders and investors make better decisions in the volatile stock market.Batch processing hampers stock market analysis, the report said. The authors recognize these challenges and propose a two-pronged strategy employing machine learning advances. In the first phase, the mean-variance model limited portfolio stock choices to decrease investment risk. Hybrid machine learning using the "perceptron" and "passive-aggressive algorithm" predicted stock price fluctuations.[9]
Chen et al. explored how data uncertainty influences portfolio selection and how the MAD model might aid wise choices. Distributionally resilient MAD (DR-MAD) is created using the Wasserstein measure and MAD model in their study. Despite its non-convexity, this model is comparable to two finite-dimensional linear programs, giving it the same resolution as the normal MAD model.This DR-MAD model is compared against 1/N, the regular MAD, and the mean-variance model using S&P 500 constituent equities in various market conditions.[10]
3. Background of Model
The mean-variance model, introduced by Harry Markowitz in 1952, is a foundational concept in modern portfolio theory[11]. It seeks to determine the optimal portfolio by analyzing the trade-off between expected returns and risk. Here's a concise explanation:
3.1. Expected Returns
This is the anticipated profit from an investment. For a portfolio with 'n' assets, the expected return is given by:
\( E(Rp)=\sum _{i=1}^{n}wiE(Ri) \) ……. (1)
3.2. Variances
Variance measures the dispersion of returns around the mean. For a single asset, it indicates the risk associated with that asset. For a portfolio, the variance is:
\( σ_{p}^{2}=\sum _{i=1}^{n}wi2σi2+\sum _{i=1}^{n}\sum _{j=1,i≠1}^{n}wiwjσiσjρij \) …… (2)
Where \( σ_{i}^{2} \) is the variance of asset 'i', and ῤij is the correlation coefficient between assets 'i' and 'j'.
3.3. Covariances
Covariance measures the degree to which two assets' returns move in tandem. A positive covariance indicates that the assets tend to move together, while a negative one means they move inversely.
3.4. Risk-Returns Trade-off
The model emphasizes that higher expected returns come with higher risk (variance). Investors must decide the level of risk they're willing to accept for a potential return.
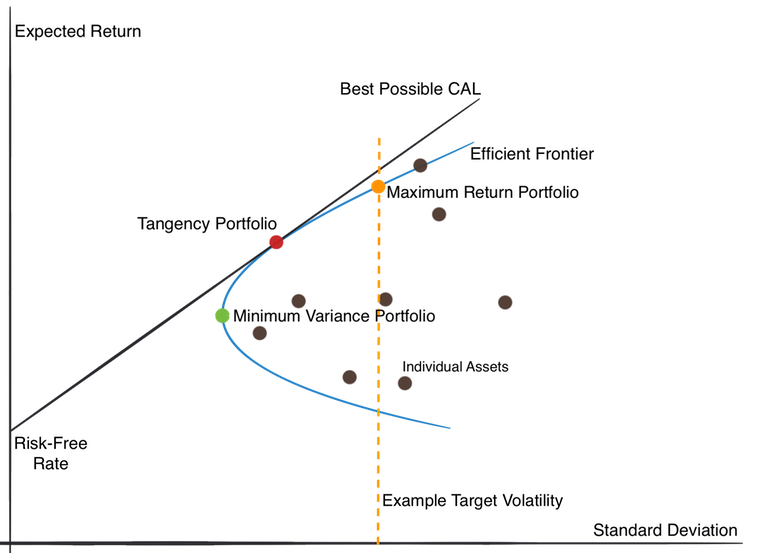
Figure 1: Risk Frontier
The model's objective is to find the optimal portfolio that offers the highest expected return for a given level of risk. This is represented graphically by the efficient frontier, in Figure 1 a curve on a graph where the x-axis represents risk (standard deviation) and the y-axis represents expected returns. The optimal portfolio lies on this curve, maximizing returns for each level of risk.
4. Data Analysis
Below are the list of companies, As per at table 1, the roster includes venerable companies such as IBM and United Airlines Holdings (UAL), along with innovative titans such as Netflix and Tesla. Tennant Minerals NL (TMS) provides a dash of diversity, highlighting the complexities of portfolio management in the resource industry.
Table 1: List of Companies
Company | Industry |
IBM | Technology |
Netflix | Entertainment |
Tesla | Automotive |
TMS (Tennant Minerals NL) | Resources |
UAL (United Airlines Holdings) | Air Travel |
4.1. Individual Stock Basis
Here's a tabular representation of the individual stock metrics from using Equation 1 and 2.
Table 2: Mean and Variance of Selected Stocks
Stock | Mean Return(%) | Variance(%) |
IBM | 0.36 | 0.635 |
Netflix | 0.59 | 2.73 |
Tesla | -2.52 | 3.74 |
TMS | -0.96 | 0.962 |
UAL | 1.95 | 2.88 |
4.2. Explanation
Each stock's mean and variance are shown in Table 2. The mean return shows the average investment profit or loss. UAL was the most lucrative stock throughout the time evaluated due to its largest positive return. Tesla is the least profitable with a negative mean return. Variance, which measures stock price volatility, indicates risk. Tesla is riskiest due of its large volatility. IBM has the lowest volatility and may be the most steady.
To visually compare the stocks, this paper plots figure 2 for both average returns and variances.
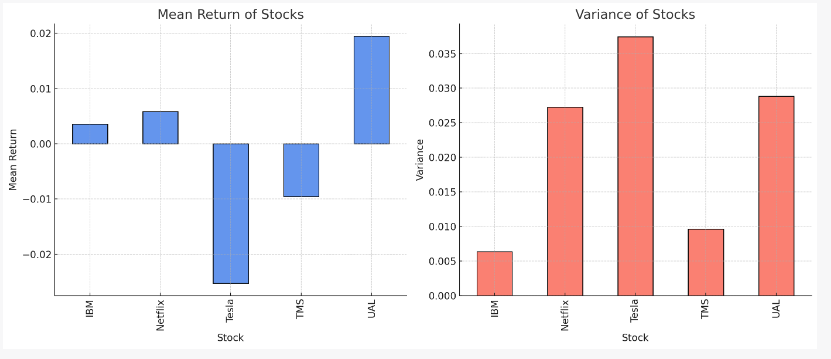
Figure 2: Bar Chart
The above bar charts graphically display the following stock performance metrics:
1. The first graph displays the average returns of the stocks throughout the selected time period. The largest positive return belongs to UAL, while the lowest belongs to Tesla, showing underperformance.
2. The second graph shows the stock market's volatility. Volatility increases as the variation increases. Tesla, Netflix, and UAL have larger standard deviations than IBM and TMS, indicating that they may be more volatile.
4.3. Portfolio Analysis using the Mean-Variance Model
Among the multitude of portfolios, the "Minimum Risk Variance Portfolio" stands out as a one-of-a-kind combination. As the name suggests, this portfolio combines assets so as to minimize the resulting risk (variance).
Table 3: Minimum Risk Variance Portfolio Metrics
Particulars | Value |
Expected Retum | -3.55% |
Standard Deviation | 7.13% |
Sharpe Ratio | -0.21 |
The indicators that pertain to the Minimum Risk Variance Portfolio are laid out in Table 3. The low standard deviation of this portfolio is indicative of the fact that it carries the least amount of risk overall. Nevertheless, the predicted return is somewhere in the negative range, which makes this portfolio less appealing to investors who are looking for income.
Despite having the lowest risk, this portfolio's negative return presents a dilemma for investors pursuing positive yields.
Table 4: Optimal Sharpe Ratio Portfolio Metrics
Particulars | Value |
Expected Retum | 7.03% |
Standard Deviation | 10.43% |
However, the characteristics of the Optimal Sharpe Ratio Portfolio are explained in Table 4. The 0.16 Sharpe ratio of this portfolio is quite impressive. This means that the portfolio provides a return of 0.16 units above the risk-free rate for every unit of risk taken. The portfolio's low volatility and high projected return make it a top pick for investors.
In essence, this portfolio promises the most alluring risk-adjusted return, making it a frontrunner among its peers.
In conclusion, while the allure of minimal risk beckons investors towards the minimum risk variance portfolio, its negative return is a deterrent. In contrast, the portfolio crowned with the highest Sharpe ratio presents equilibrium of risk and return, marking it as the epitome of efficiency in the given set.
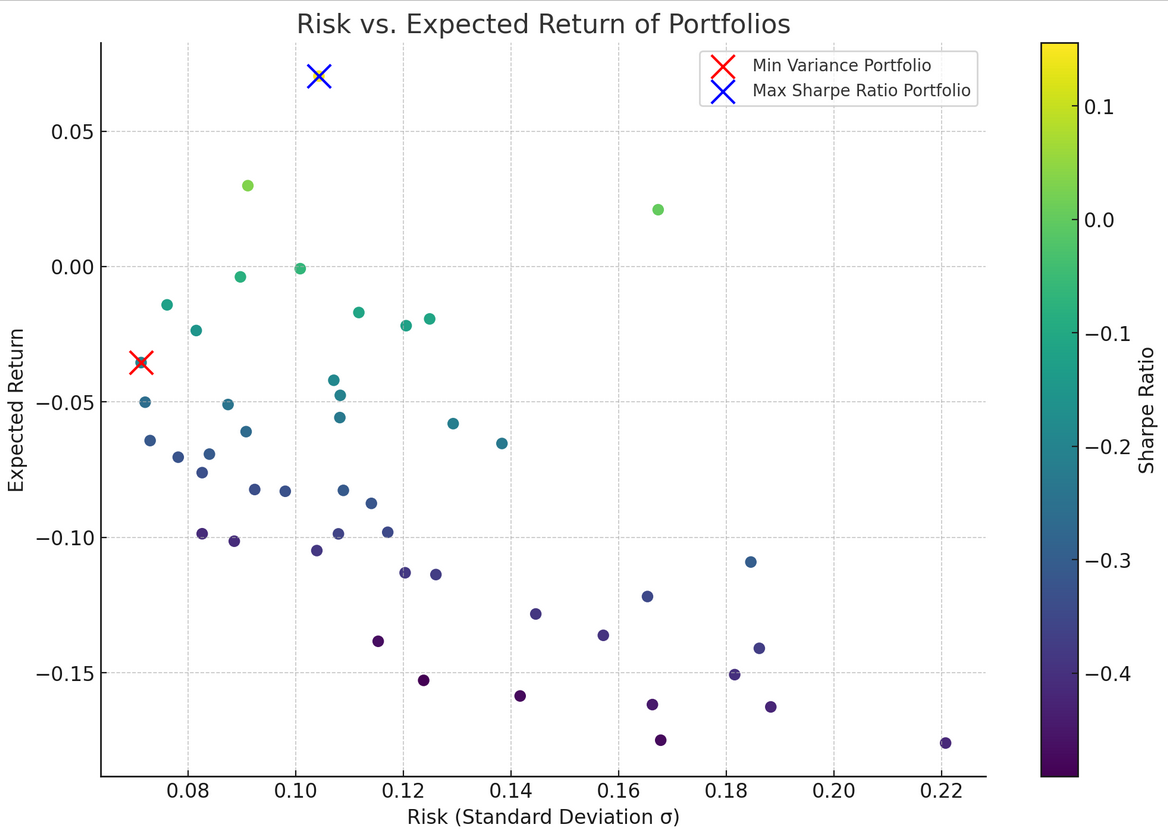
Figure 3: Scatter Plot of Risk and Return
The relationship between risk and return for various portfolios is shown in the scatter plot in Figure 3. The scatter plot above shows the risk (standard deviation, σ) versus expected return for various portfolios. The color of each point represents its Sharpe ratio, with warmer colors indicating higher Sharpe ratios.
The following are the most important findings and explanations, as shown by the tables:
(1) All portfolios have a built-in risk-reward trade-off: A different portfolio is represented by each dot on the scatter plot. The basic concept of finance is shown by their placement: more risk may lead to higher rewards. Stock returns are notoriously unpredictable, as seen by the wide variation in profits for equivalent degrees of danger. The objective of a well-constructed portfolio is to identify the combinations that maximize returns at each level of risk.
(2) Portfolio with the Smallest Possible Variation (Table 3): On the risk-reward diagram, the red portfolio stands out as the safest option. Return-focused investors may be put off by the negative return despite the reduced risk profile.
(3) Portfolio with the Highest Possible Sharpe Ratio (Shown in Table 4): This blue portfolio has the highest risk-adjusted returns, as measured by its impressive Sharpe ratio. It is the most well-rounded portfolio since it seeks to maximize profits while mitigating risk.
The portfolio with the highest Sharpe ratio had a value of approximately 0.16, which falls into the "acceptable but not outstanding" category. It means that for every unit of risk taken, the investor is expected to achieve 0.16 units of return above the risk-free rate.
Let's visualize the distribution of Sharpe ratios for the portfolios to see how they compare (figure 4).
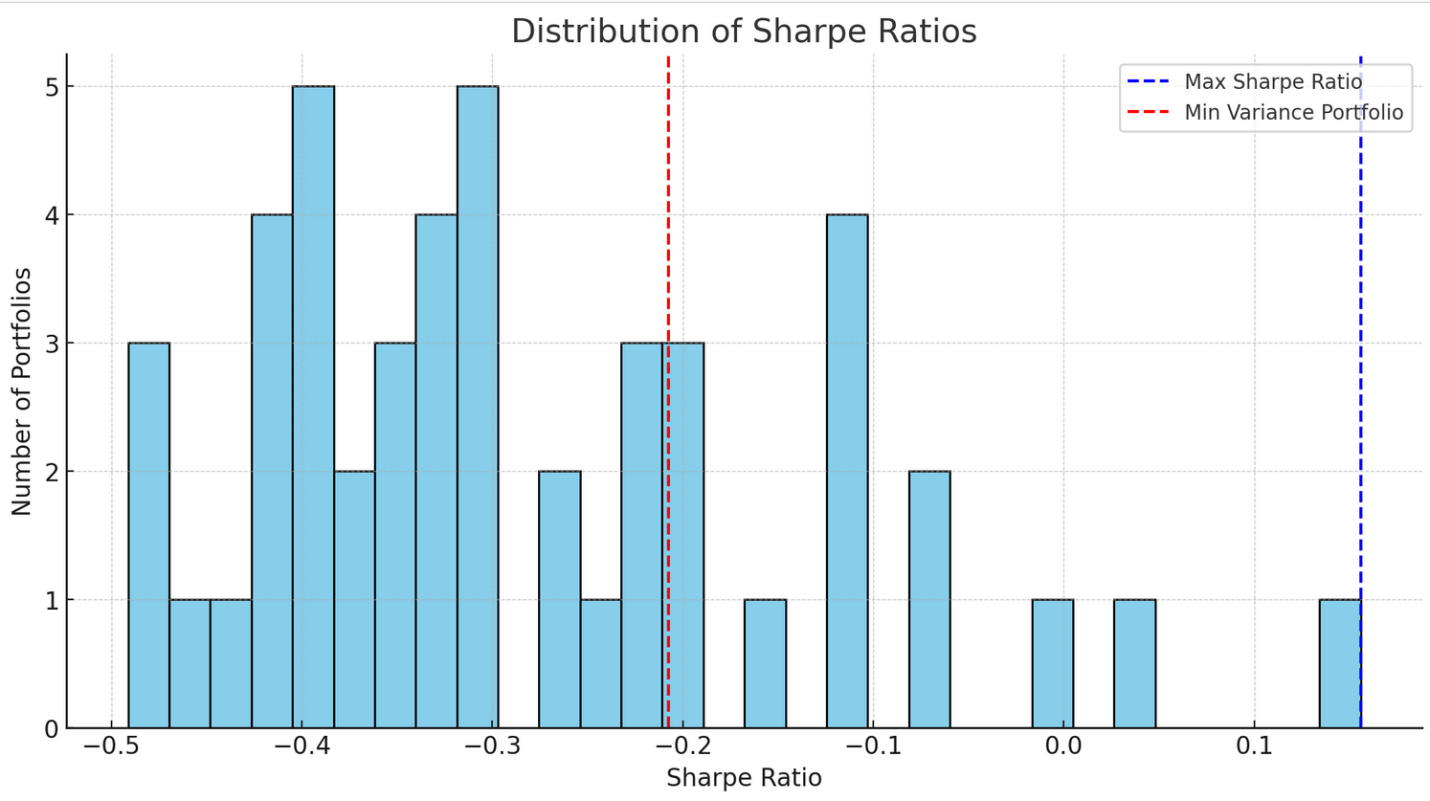
Figure 4: Histogram of Sharpe Ratio
The histogram above illustrates the distribution of Sharpe ratios for the various portfolios:
(4) Distribution Peak: The majority of portfolios have a Sharpe ratio between -0.2 and 0.2. Given the risk assumed, this spread indicates that the majority of portfolios offer returns in the vicinity of the risk-free rate.
(5) Maximum Sharpe Ratio: The dotted blue line represents the portfolio with the highest Sharpe ratio (approximately 0.16). This portfolio stands out because it offers one of the best risk-adjusted returns among the group, although it still falls into the "acceptable but not outstanding" category.
(6) The red dashed line represents the Sharpe ratio for the minimum variance portfolio. Negative Sharpe ratio is cause for concern. It suggests that despite its minimal risk, this portfolio is anticipated to underperform the risk-free rate.
In summary, the Sharpe ratio offers a lens to judge the attractiveness of investments by taking both return and risk into account. While absolute returns can be enticing, it's the risk-adjusted returns (as given by the Sharpe ratio) that provide a more comprehensive picture.
4.4. Optimal Portfolio Model
Portfolio Volatility Calculation: Portfolio volatility (or standard deviation) was computed using:
Portfolio Volatility=√wT × Covariance Matrix × w
where w is the vector of portfolio weights
4.4.1. Expected Portfolio Return Calculation
Table 5: Portfolio Return
Stock | Weight (wi | Expected Return ofStock | Contribution to PortfolioReturn |
IBM | 18.7821% | 0.3571% | 0.0671% |
Netflix | 14.8077% | 0.5859% | 0.0868% |
Tesla | 2.6682% | -2.5235% | -0.0673% |
TMS | 1.1330% | -0.9560% | -0.0108% |
UAL | 62.6090% | 1.9493% | 1.2205% |
4.4.2. Portfolio Volatility Calculation
Table 6: Volatility Analysis
Stock | Covariance Contribution | Weight (wi) | Volatility Contribution |
IBM | 0.4930% | 18.7821% | 0.0926% |
Netfli x | 0.5714% | 14.8077% | 0.0846% |
Tesla | 0.8899% | 2.6682% | 0.0237% |
TMS | 0.4838% | 1.1330% | 0.0055% |
UAL | 1.9604% | 62.6090% | 1.2274% |
4.4.3. Sharpe Ratio Calculation
The Sharpe ratio is calculated as in Table 5 and Table 6:
Sharpe Ratio=Expected Portfolio Return−Risk-Free RatePortfolio VolatilitySharpe Ratio
=Portfolio VolatilityExpected Portfolio Return−Risk-Free Rate
Given:
(1) Expected Portfolio Return: 1.2961%
(2) Risk-Free Rate: 1.0%
(3) Portfolio Volatility: 11.9741%
As shown in figure 5, the Sharpe ratio for the optimal portfolio is: 0.0247
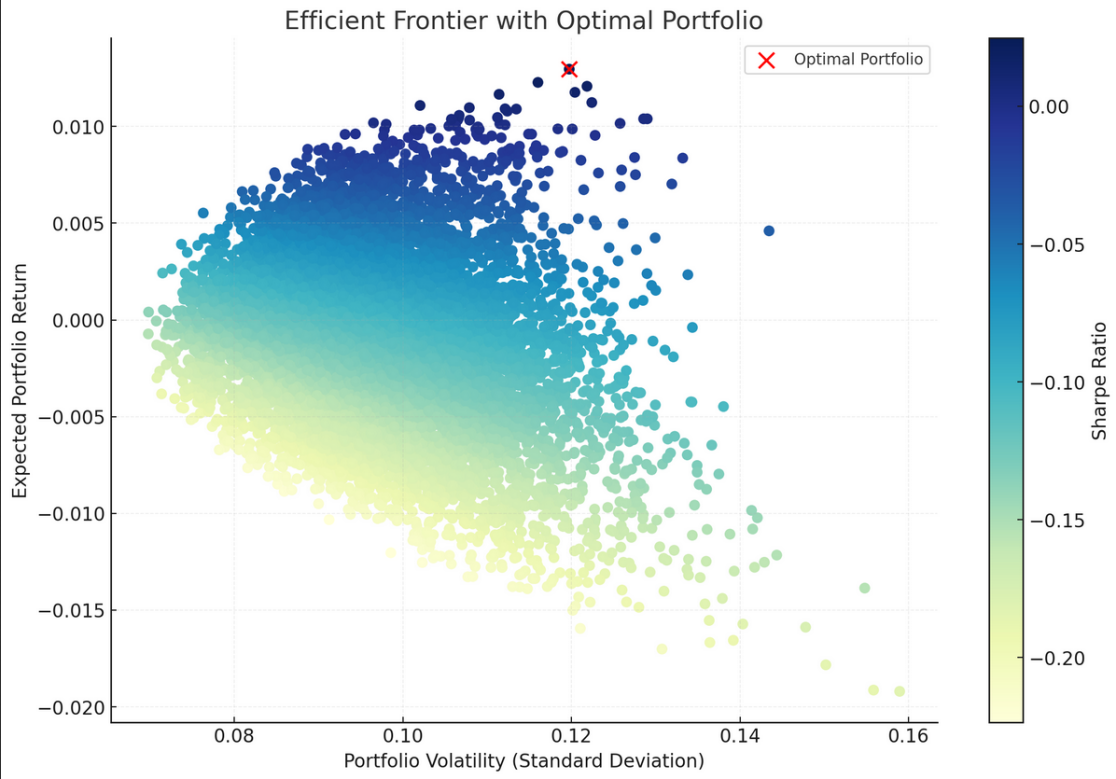
Figure 5: Efficient Frontier of Portfolio
5. Discussion of Pension Fund
The findings from the mean-variance optimization and the Sharpe ratio analysis offer valuable insights for pension fund managers:
5.1. Optimal Portfolio Selection
Our analysis highlighted a portfolio dominated by UAL (62.6%) with a smaller emphasis on IBM and Netflix, and minimal weights on Tesla and TMS. This composition offers the best risk-adjusted return among the simulated portfolios. For pension funds, this implies that a strategic allocation of assets, even among diverse companies, can achieve optimal returns while managing risk.
5.2. Diversification
The importance of diversification is underscored by the varied contributions of different stocks to the optimal portfolio. Even if certain stocks (like Tesla) have shown negative returns, their inclusion in a portfolio can still offer risk diversification benefits. Pension funds should ensure diversification across sectors to buffer against sector-specific downturns.
5.3. Risk Management
The Sharpe ratio's emphasis on risk-adjusted returns is a crucial metric for pension funds. It's not just about maximizing returns; it's about achieving those returns with minimal risk. Especially for pension funds, where the primary goal is the long-term security of retiree assets, managing volatility and downside risk is paramount.
5.4. Evolving Business Models
Companies like IBM, Netflix, and Tesla represent different business models and sectors. While IBM has a legacy in technology infrastructure, Netflix represents the new-age entertainment sector, and Tesla stands as a beacon for future mobility. Investing in such diverse companies allows pension funds to tap into both traditional and emerging growth areas, balancing stability with innovation.
5.5. Rebalancing
Given the volatile nature of markets, it's essential for pension funds to periodically review and rebalance their portfolios. The optimal portfolio today might not remain optimal in the future.
In conclusion, for pension funds, the mantra should be diversification and diligent risk management. The analysis underscores the importance of striking a balance between chasing returns and managing risks, ensuring the long-term security of beneficiaries' assets. Investing across diverse companies, sectors, and business models can offer both growth opportunities and risk mitigation.
6. Conclusion
Mean-variance modelling arises as an indispensable instrument for optimising portfolio performance in the complex domain of pension fund management. This study highlights its crucial function, especially when analysing diverse equities like IBM, Netflix, Tesla, TMS, and UAL. The risk and return profiles of these diversely-sectoral enterprises are distinct. By employing the mean-variance model, fund managers can achieve a balance between risk mitigation and return potential. In addition, the insights provided by the Sharpe ratio emphasise the significance of measuring risk-adjusted returns rather than absolute returns. The two most important takeaways for pension funds are sector diversification and prudent risk management. These dual strategies ensure that portfolios not only pursue growth opportunities but also protect the beneficiaries' long-term interests. As retirees and prospective beneficiaries place their faith in pension funds, the implementation of such comprehensive financial models becomes imperative to ensure their secure and prosperous financial futures.
While useful, this research may have overlooked alternative optimization tactics and larger market dynamics in favor of its primary emphasis on a subset of enterprises using the mean-variance approach. The impact of extraneous variables such as political instability and economic upheaval was not discussed. To conduct a more thorough investigation, future studies should take into account both of these factors and other theories.
References
[1]. Chaweewanchon, A., & Chaysiri, R. (2022). Markowitz Mean-Variance Portfolio Optimization with Predictive Stock Selection Using Machine Learning. International Journal of Financial Studies, 10(3), Article 3.
[2]. Georgantas, A., Doumpos, M., & Zopounidis, C. (2021). Robust optimization approaches for portfolio selection: A comparative analysis. Annals of Operations Research, 1–17.
[3]. Mazraeh, N. B., Daneshvar, A., zaj, M., & Roodposhti, F. R. (2022). Stock Portfolio Optimization Using a Combined Approach of Multi Objective Grey Wolf Optimizer and Machine Learning Preselection Methods. Computational Intelligence and Neuroscience, 2022, 5974842.
[4]. Wang, L., Ahmad, F., Luo, G., Umar, M., & Kirikkaleli, D. (2021). Portfolio optimization of financial commodities with energy futures. Annals of Operations Research, 313(1), 401–439.
[5]. Arcuri, M. C., Gandolfi, G., & Laurini, F. (2022). Robust portfolio optimization for banking foundations: A CVaR approach for asset allocation with mandatory constraints. Central European Journal of Operations Research, 31(2), 557–581.
[6]. Wu, L., Ahmad, M., Qureshi, S. A., Raza, K., & Khan, Y. A. (2022). An analysis of machine learning risk factors and risk parity portfolio optimization. PLOS ONE, 17(9), e0272521.
[7]. Ma, Y., Ahmad, F., Liu, M., & Wang, Z. (2020). Portfolio optimization in the era of digital financialization using cryptocurrencies. Technological Forecasting and Social Change, 161, 120265.
[8]. Navarro, M. M., Young, M. N., Prasetyo, Y. T., & Taylar, J. V. (2023). Stock market optimization amidst the COVID-19 pandemic: Technical analysis, K-means algorithm, and mean-variance model (TAKMV) approach. Heliyon, 9(7), e17577.
[9]. Padhi, D. K., Padhy, N., Bhoi, A. K., Shafi, J., & Yesuf, S. H. (2022). An Intelligent Fusion Model with Portfolio Selection and Machine Learning for Stock Market Prediction. Computational Intelligence and Neuroscience, 2022, 7588303.
[10]. Chen, D., Wu, Y., Li, J., Ding, X., & Chen, C. (2022). Distributionally robust mean-absolute deviation portfolio optimization using wasserstein metric. Journal of Global Optimization, 1–23.
[11]. Fu, Y. (2019). On Generalizations of Mean–Variance Model. Journal of Physics: Conference Series, 1168, 052011.
Cite this article
Yang,Y. (2024). Utilizing the Mean-Variance Model to Optimize Pension Investment Portfolios: A Detailed Analysis of Key Industries. Advances in Economics, Management and Political Sciences,70,52-62.
Data availability
The datasets used and/or analyzed during the current study will be available from the authors upon reasonable request.
Disclaimer/Publisher's Note
The statements, opinions and data contained in all publications are solely those of the individual author(s) and contributor(s) and not of EWA Publishing and/or the editor(s). EWA Publishing and/or the editor(s) disclaim responsibility for any injury to people or property resulting from any ideas, methods, instructions or products referred to in the content.
About volume
Volume title: Proceedings of the 2nd International Conference on Financial Technology and Business Analysis
© 2024 by the author(s). Licensee EWA Publishing, Oxford, UK. This article is an open access article distributed under the terms and
conditions of the Creative Commons Attribution (CC BY) license. Authors who
publish this series agree to the following terms:
1. Authors retain copyright and grant the series right of first publication with the work simultaneously licensed under a Creative Commons
Attribution License that allows others to share the work with an acknowledgment of the work's authorship and initial publication in this
series.
2. Authors are able to enter into separate, additional contractual arrangements for the non-exclusive distribution of the series's published
version of the work (e.g., post it to an institutional repository or publish it in a book), with an acknowledgment of its initial
publication in this series.
3. Authors are permitted and encouraged to post their work online (e.g., in institutional repositories or on their website) prior to and
during the submission process, as it can lead to productive exchanges, as well as earlier and greater citation of published work (See
Open access policy for details).
References
[1]. Chaweewanchon, A., & Chaysiri, R. (2022). Markowitz Mean-Variance Portfolio Optimization with Predictive Stock Selection Using Machine Learning. International Journal of Financial Studies, 10(3), Article 3.
[2]. Georgantas, A., Doumpos, M., & Zopounidis, C. (2021). Robust optimization approaches for portfolio selection: A comparative analysis. Annals of Operations Research, 1–17.
[3]. Mazraeh, N. B., Daneshvar, A., zaj, M., & Roodposhti, F. R. (2022). Stock Portfolio Optimization Using a Combined Approach of Multi Objective Grey Wolf Optimizer and Machine Learning Preselection Methods. Computational Intelligence and Neuroscience, 2022, 5974842.
[4]. Wang, L., Ahmad, F., Luo, G., Umar, M., & Kirikkaleli, D. (2021). Portfolio optimization of financial commodities with energy futures. Annals of Operations Research, 313(1), 401–439.
[5]. Arcuri, M. C., Gandolfi, G., & Laurini, F. (2022). Robust portfolio optimization for banking foundations: A CVaR approach for asset allocation with mandatory constraints. Central European Journal of Operations Research, 31(2), 557–581.
[6]. Wu, L., Ahmad, M., Qureshi, S. A., Raza, K., & Khan, Y. A. (2022). An analysis of machine learning risk factors and risk parity portfolio optimization. PLOS ONE, 17(9), e0272521.
[7]. Ma, Y., Ahmad, F., Liu, M., & Wang, Z. (2020). Portfolio optimization in the era of digital financialization using cryptocurrencies. Technological Forecasting and Social Change, 161, 120265.
[8]. Navarro, M. M., Young, M. N., Prasetyo, Y. T., & Taylar, J. V. (2023). Stock market optimization amidst the COVID-19 pandemic: Technical analysis, K-means algorithm, and mean-variance model (TAKMV) approach. Heliyon, 9(7), e17577.
[9]. Padhi, D. K., Padhy, N., Bhoi, A. K., Shafi, J., & Yesuf, S. H. (2022). An Intelligent Fusion Model with Portfolio Selection and Machine Learning for Stock Market Prediction. Computational Intelligence and Neuroscience, 2022, 7588303.
[10]. Chen, D., Wu, Y., Li, J., Ding, X., & Chen, C. (2022). Distributionally robust mean-absolute deviation portfolio optimization using wasserstein metric. Journal of Global Optimization, 1–23.
[11]. Fu, Y. (2019). On Generalizations of Mean–Variance Model. Journal of Physics: Conference Series, 1168, 052011.