


1. Introduction
A portfolio is a collection of stocks, bonds, financial derivatives, etc. held by investors or financial institutions. The purpose is to diversify risk. A portfolio can be viewed as a combination on several levels. The first level of portfolio, due to the dual needs of safety and profitability, consider the combination of risky and risk-free assets, for the sake of safety need to combine risk-free assets, for the sake of profitability need to combine risky assets. The second level of portfolio is to consider how to combine risky assets. Since any combination of two poorly or negatively correlated assets will yield a risky return greater than the risky return of the individual assets, a constant combination of poorly correlated assets will keep the efficient frontier of the portfolio away from risk.
The main steps in the portfolio construction process are to first define the investment objective, then develop a long-term strategy, and finally assess the risk of the portfolio. Tactical asset allocation is one of the long-term investment strategies based on client risk appetite and market liquidity. Meb Faber proposed a timing model in his journal Quantitative Approaches to Tactical Asset Allocation, first published in 2007 and updated in 2013, which is one of the most representative and most cited systems to date [1]. According to the journal, this quantitative marketing timing model can be used to manage risk to enhance returns across different asset classes such as stocks, bonds and futures, which means that it can be applied to enhance the portfolio construction process.
The process of portfolio construction is made up of the steps described below. First, the range of securities suitable for selection needs to be defined. For most scheme investors the focus of their attention is on the major asset classes of common stocks, bonds and money market instruments. Currently, these investors have included alternative asset classes such as international equities and non-U.S. dollar bonds, giving the investment a global character. Some investors have included real estate and venture capital to further broaden the scope of their investments. While the number of asset classes remains limited, the number of securities within each asset class can be quite large. For example, managers of common stock certificates typically operate at least 2 0 0 0 types of stocks, with the average number ranging from 4 0 0 to 5 0 0 types, while some are as high as 1 0 0 0 or more.
Second, investors also need to demand an expectation of the potential rate of return for each security and asset type and the risk they are taking. In addition, it is more important that such estimates be clearly stated so that comparisons can be made as to which of the many securities and asset classes are more attractive. The value of the portfolio resulting from the investments made depends to a large extent on the quality of these selected securities. Noting the importance of this stage, we describe later the pricing models and techniques for calculating risk-return expectations for securities and asset classes. The third stage of the portfolio construction process, the actual optimization, must include the selection of the various securities and the determination of the weights of the securities within the portfolio. In the process of assembling the various securities together to form the required portfolio, it is necessary not only to take into account the risk-return characteristics of each security, but also to estimate the possible interactions of these securities over time. As we have noted, the Markowitz model provides a conceptual framework and analytical methodology for determining the optimal portfolio in an objective and polished manner.
2. Tactical Asset Allocation
Tactical asset allocation(TAA) has always been treated as a broad definition of multi-asset portfolio strategy and has always been used for comparison with strategic asset allocation; both of the strategies are based on modern portfolio theory and seek an extra alpha return within an acceptable range of risk. Strategic asset allocation regularly re-balances the multi-asset portfolio across various asset classes to maintain close to the specified allocation under all market conditions. On the contrary, TAA is a more active strategy to take advantage of market trends by shifting and adjusting the long-term percentage of assets of the portfolio based on the short-term forecast. Selecting the level of risk is also crucial to the selection of strategy; according to Wai Lee's study about why asset allocation should be tactically managed, he started with Sharpe's survey about the relationship between risk tolerance and investor's asset allocation choices [2]. One of the few seminal studies in putting asset allocation decisions into a presentable framework is Sharpe.
Implicitly based on a one-period model, Sharpe argues that, given the same investment opportunity set, investors with different attitudes toward risk will have different responses to asset allocation decisions. Sharpe compares and contrasts strategic asset allocation, tactical asset allocation (TAA), and portfolio insurance strategies. An investor will stay with a constant-mix strategic portfolio, provided that relative risk tolerance does not change and expected returns, risks, and correlations are all believed to be constant. When the investor attempts to predict expected returns and covariance matrix, or when these parameters are considered to be time-varying, however, the investor will choose tactical asset allocation. Constant relative risk tolerance is the condition in common in both strategic and tactical asset allocation strategies [2]. The author also pointed out that the pros of choosing TAA for investors are when considering the unpredictability and uncertainty of future return, with a changing investment opportunity set, a risk-averse investor will hold risky assets not only for the favourable risk premium and diversification but also for inter-temporal hedging [2].
3. Meb Faber’s Timing Model
Once the market forms a trend, it can often last for a while. If the trend is identified, portfolio managers could build models to follow the trend. Trend/timing strategies could also be very quantitative. By observing market performance and back-testing, some buy and sell signals can be extracted. Many indicators of technical analysis mainly apply trend timing strategies. The effectiveness of trend strategies is determined based on quantitative indicators such as factors. The relatively simple factors include a large number of volume and price factors (closing price, moving averages, volatility, etc.).
To deep dive into Faber's timing model, investors would find out the simple mechanism of using moving average price crossovers and also its long process of testing. To sum up, the model as follows:
BUY RULE:
Buy when monthly price > 10-month SMA
SELL RULE:
Sell and move to cash when monthly price < 10-month SMA.
1. All entry and exit prices are on the day of the signal at the close. The model is only updated once a month on the last day of the month. Price fluctuations during the rest of the month are ignored.
2. All data series are total return series, including dividends, updated monthly.
3. Cash returns are estimated with 90-day Treasury bills and margin rates are evaluated with the broker call rate.
4. Taxes, commissions, and slippage are excluded [3].
Faber chose to follow the 10-month SMA look-back period based on the 200-day moving average, examined the timing effect of the S&P Index and the investment portfolios constructed with five different assets, and found that it was not outstanding in improving returns. Still, the results of testing show that the timing method could efficiently reduce the draw-down of returns. When using a simple buy-and-hold model as an example to compare with Faber's timing model, the testing shows that the timing model efficiently reduces the draw-down of returns; the following table from Extrategic Dashboard will show the results more clearly [3]:
Table 1: Faber US Equities — 1973 to 2023: Timing vs Buy and Hold. ((“Extrategic Dashboard - Faber Tactical Asset Allocation (Updated)”).
Timing | Buy and Hold | |
Starting equity | $100,000,00 | $100,000.00 |
Ending equity | $12,350,267.56 | $15,694,209.61 |
Time elapsed | 50 years, 8 months | 50 years, 8 months |
Compound Annual Growth Rate % | 9.97% | 10.49% |
Max % draw-down | (32.95%) | (55.25%) |
MAR ratio | 0.30 | 0.19 |
Win rate% | 57.1% | 0.0% |
Longest draw-down duration | 32.9 months | 73.5 months |
Average trades per year | 0.69 | 0.00 |
The max draw-down of the timing model is -32.95% till 2023, which is lower than the simple buy and hold strategy’s -55.25% is investing in the US equities portfolio. The Managed Accounts Reports(MAR) ratios equal the average annual return divided by the most significant decline, calculated based on month-end data, which means the rate of return is greater than the maximum loss. Faber’s timing model performs better than the buy-and-hold model since its MAR ratio is 0.3, which is greater than 0.19. although the timing model’s compound Annual Growth Rate is a little bit lower than the buy and hold strategy’s, it is also enough to illustrate the risk aversion ability of Faber’s timing model.
According to Faber, the timing system has fewer occurrences of both significant gains and large losses, with correspondingly higher circumstances of small gains and losses. The system is a model that signals when an investor should be long a riskier asset class with potential upside and when to be out and sitting in cash. It is this move to a lower-volatility asset class (T-bills) that drops the overall risk and draw-down of the portfolio. Most importantly, it avoids the far left tail of significant adverse losses [4].
Faber also mentioned some practical considerations for investors when applying the model: management fees, taxes, commissions, etc., in the paper. The management of principal portfolios like ETFs and mutual funds is in the range of 0.1% to 0.7%. Many all-ETF portfolios can be formed for approximately 0.1% to 0.3% [4]. According to this, the following part will use an all-ETF portfolio as an example to test the timing model applied in the Chinese capital market. Taxes could be the cost that the investors consider if they are trading via taxable accounts; Faber figured that if investors increasing turnovers would “results in a high number of short-term capital losses, and a large percentage of long-term capital gains [4]” based on Gannon and Blum’s model, which will lead to possible less cost of tax for investors.
4. Applying Faber’s Timing Model to Chinese Capital Market
Since China has developed capital markets years later than the US, asset price fluctuations are relatively more severe. Although many Chinese scholars have studied timing models based on the local capital market, there are relatively few studies examining the timing effect and combining it with asset allocation as a reference. So, when applying Faber’s timing model to the Chinese market, portfolio managers and investors should consider the difference between the capital markets and the economic environment. Due to the complexity of China’s stock market, and according to the last part of this paper, choosing an ETF that includes the performance of stocks in China as an underlying asset while testing the timing model would be more intuitive for potential investors.
Since the MSCI China index provides a representative sample of the entire China investing market, covering A-shares, H-shares, B-shares, Red chips and P chips, as well as local stocks listed in Hong Kong, even local companies started to develop MSCI China index-related funds and ETFs. So, the following TAA model test results from Jan 2019 to Aug 2023 for KraneShares MSCI All China ETF (KALL), which tracks the price performance of the MSCI China All Shares Index and the company is professional at investing in critical factors about China, are based on 10 calendar month simple moving average. Trades are executed using the end-of-month close price each month based on the end-of-month signals by applying Faber’s timing model. The period was constrained by the available data for KraneShares MSCI All China ETF (KALL) (Aug 2018 - Aug 2023).
Table 2: Performance Summary of Faber’s timing vs Buy and hold using KALL as underlying asset.
Faber’s | Buy and hold | |
Initial balance | $10,000 | $10,000 |
Final balance | $8,416 | $8,174 |
CAGR | (4.59%) | (5.35%) |
Stdev | 15.68% | 26.97% |
Best Year | 23.41% | 31.87% |
Worst Year | (26.09%) | (25.02%) |
Max.Draw-down | (36.38%) | (51.30%) |
Market correlation | 0.25 | 0.29 |
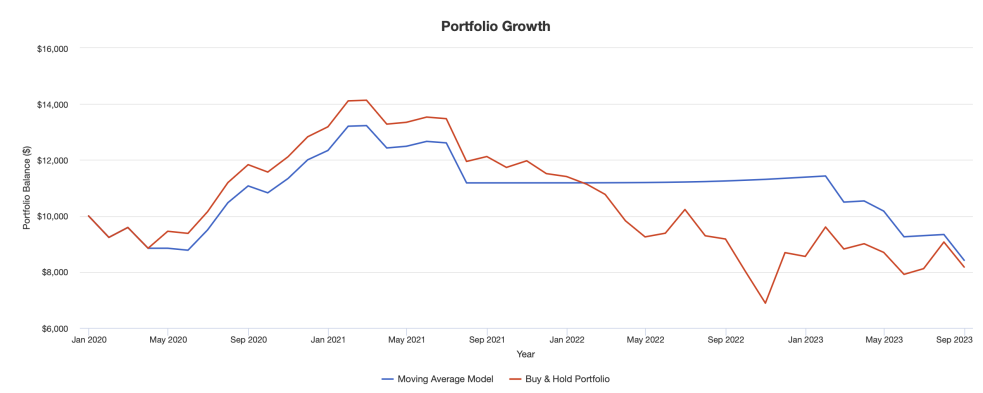
Figure 1: Portfolio growth of Faber’s timing vs Buy and hold using KALL as underlying asset.
5. Discussion
Clearly, It can be seen that although Faber's timing model cannot exceed the buy and hold model in terms of return, it can reduce the percentage of maximum draw-down efficiently from the table above, which is -36.38% when applying the timing model comparing to -51.3% when applying simple buy and hold strategy. Also, the timing model efficiently decreased the volatility since the standard deviation is 15.68%, which is much lower than the buy-and-hold models. Even the return could be better for average investors since the volatility and specificity of China's stock market in recent years should also be taken into account, the timing model performed rather than simply investing in the ETF itself.
In order to better explain the risk aversion of Faber's timing model and how it could help to improve portfolio construction, Liang Zhou and Xiaofeng Wei evaluated the model by applying it to a multiple asset portfolio composed by China's local index: According to portfolio theory, adequate diversification can be achieved through asset allocation investment risk [5]. Therefore, choose the CSI 300 Index, CSI 500 Index, China Bond New Wealth Composite Index, Nanhua Industrial Products Index, and Nanhua Agricultural Products Index to construct investment portfolios in order to achieve the purpose of diversifying investment risks. Before completing the investment portfolio, we first tested the tactical asset allocation effect of four indexes other than the index. The timing model resulted in an average return (annualized rate of return, Sharpe ratio, return draw-down ratio) higher than the original index. In contrast, risk factors (annualized volatility, maximum draw-down) are lower than the initial index [5]. Zhou and Wei combined relatively diversified underlying assets:
(1) The correlation coefficient of the return rate between the China Bond Index and the stock index is about -0.01.
(2) The correlation coefficient between the return rate and the futures index is about -0.1.
(3) The correlation coefficient between the futures index and the stock index is about 0.2.
The trading rules were designed to conduct independent trading on the five indexes, with an average allocation of 20% of funds for each index, so the performance benchmark was set as 0.2 × CSI 300+0.2 × CSI 500+0.2 × ChinaBond Index +0.2 × Nanhua Industrial Products Index+0.2 × Nanhua Agricultural Products Index. Through initial asset allocation, the return rate is higher than the average annualized return rate of the five indexes from 2010 to 2017, and the volatility rate is 11.52%, which is lower than the average annualized volatility rate of the five indexes (15.72%). These data verified the effectiveness of portfolio construction and proved it could effectively reduce systemic risk.
After applying Faber's timing model to the portfolio, Zhou and Wei resulted in an annualized rate of return of 12.45% from 2010 to 2017, which was much higher than the benchmark's 2.36%. Also, the annualized volatility was reduced from 11.52% to 7.61%; the maximum draw-down was decreased from 24.72% to 13.38%. Therefore, the Sharpe ratio of the timing model is as high as 1.3064, which is higher than the Sharpe ratio of every index configuration. The return rate of the worst year of the timing model is 3.95%, which is far higher than the benchmark's -17.88%; at the same time, the best year is 25.54%, which is also higher than the benchmark's 14.76%, the result well reflected timing model could reduce the overall risk and draw-down of the portfolio.
As this paper discussed tactical asset allocation before, the strategy involves adjusting the long-term percentage of assets of the portfolio based on the short-term forecast; further adjustments were made by Zhou and Wei to the allocation of the portfolio in order to achieve a better timing effect, which also to be more adaptable to the local market at that time. Changed the allocation strategy to allocate 50% of funds to each of the two assets, then adjust the proportion of holding different amounts of investments in different periods to 33%, 33%, 33% for having three other assets, and 25%, 25%, 25%, 25% for holding four different assets, with same timing model.
Compared with the last testing result, the annualized return rate of the new portfolio increased to 21.71%, but the annualized volatility and maximum draw-down also increased to 11.63% and 19.62%, respectively. Overall, although the new portfolio that maximizes capital utilization efficiency also increases risk, it is still controlled within a relatively low-risk range and is more prominent in improving returns. Therefore, it is suitable for investors who pursue returns as high as possible to choose TAA that adjusts more frequently.
6. Conclusion
Combining asset allocation with timing models can achieve better results for portfolios, even in a highly complex and relatively under-performing market like China. Zhou and Wei’s experiment on the timing model was conducted in 2017, and the economy has begun to show signs of recession after COVID-19, which could also be seen from the negative return of KALL, the ETF evaluated before. My concerns as an investor in the participation of investing portfolio would be how to control the maximum draw-down when facing possible economic recession effectively. Meb Faber also offered investors a good solution about this in his other study: Do the extremes in valuation signal bubbles and generational buying opportunities? The US in 1920, the UK in 1974, the Netherlands in 1981, South Korea in 1984, 1985, and 1997, Thailand in 2000, Ireland in 2008, and Greece in 2011.
Can you imagine investing in any of these markets in those years? In every instance, the news flow was horrendous, and many of these countries were in total crisis. Now, what would happen if you invested in these seemingly deplorable markets, the literal worst of the most disgusting geopolitical headlines? He found out that investing in the cheapest countries produces four to seven percentage points of outperformance and an equal amount of underperformance for the overvalued countries. This means there would be chances, but choosing the correct timing of buying and selling determines the ratio of risk and returns. Comparing global equity markets on a relative basis allows the portfolio manager to create portfolios of cheap stock markets while avoiding or even shorting expensive markets.
If the tactical asset allocation and Faber’s timing model could be well applied to the portfolio, which means effectively controlling purchase costs and risks, as Warren Buffett famously said, “price is what you pay, value is what you get”, more appropriate strategy design can be carried out in the actual long-term investment process, such as appropriately leveraging bonds or futures, thereby maximizing the return-to-risk ratio.
References
[1]. Faber, Meb. “A Quantitative Approach to Tactical Asset Allocation.” Papers.ssrn.com, The Journal of Wealth Management, 11 Feb. 2007, papers.ssrn.com/sol3/papers.cfm?abstract_id=962461. Accessed 1 Feb. 2013.
[2]. Lee, Wai. Theory and Methodology of Tactical Asset Allocation. New Hope, Pennsylvania, Frank J. Fabozzi Associates, 15 Aug. 2000, p. 9-10.
[3]. “Extrategic Dashboard - Faber Tactical Asset Allocation (Updated).” Extradash.com, extradash.com/en/strategies/models/5/faber-tactical-asset-allocation/. Accessed 16 Sept. 2023.
[4]. Faber, Meb, “Global Value: Building Trading Models with the 10 Year CAPE” , August 14, 2012. Cambria Quantitative Research, No. 5, August 2012, Available at SSRN: https://ssrn.com/abstract=2129474
[5]. Zhou, Liang, and Xiaofeng Wei. “Faber’s Tactical Asset Allocation and Timing Effect Test Based on Chinese Capital Market Data.” Financial Development Research, vol. 72, no. 07, 19 Mar. 2019, pp. 72–78, https://doi.org/10.19647/j.cnki.37-1462/f.2019.03.010.
Cite this article
Wang,K. (2024). How Meb Faber Timing Model Inspired Improving Portfolio Construction in China. Advances in Economics, Management and Political Sciences,72,75-81.
Data availability
The datasets used and/or analyzed during the current study will be available from the authors upon reasonable request.
Disclaimer/Publisher's Note
The statements, opinions and data contained in all publications are solely those of the individual author(s) and contributor(s) and not of EWA Publishing and/or the editor(s). EWA Publishing and/or the editor(s) disclaim responsibility for any injury to people or property resulting from any ideas, methods, instructions or products referred to in the content.
About volume
Volume title: Proceedings of the 2nd International Conference on Management Research and Economic Development
© 2024 by the author(s). Licensee EWA Publishing, Oxford, UK. This article is an open access article distributed under the terms and
conditions of the Creative Commons Attribution (CC BY) license. Authors who
publish this series agree to the following terms:
1. Authors retain copyright and grant the series right of first publication with the work simultaneously licensed under a Creative Commons
Attribution License that allows others to share the work with an acknowledgment of the work's authorship and initial publication in this
series.
2. Authors are able to enter into separate, additional contractual arrangements for the non-exclusive distribution of the series's published
version of the work (e.g., post it to an institutional repository or publish it in a book), with an acknowledgment of its initial
publication in this series.
3. Authors are permitted and encouraged to post their work online (e.g., in institutional repositories or on their website) prior to and
during the submission process, as it can lead to productive exchanges, as well as earlier and greater citation of published work (See
Open access policy for details).
References
[1]. Faber, Meb. “A Quantitative Approach to Tactical Asset Allocation.” Papers.ssrn.com, The Journal of Wealth Management, 11 Feb. 2007, papers.ssrn.com/sol3/papers.cfm?abstract_id=962461. Accessed 1 Feb. 2013.
[2]. Lee, Wai. Theory and Methodology of Tactical Asset Allocation. New Hope, Pennsylvania, Frank J. Fabozzi Associates, 15 Aug. 2000, p. 9-10.
[3]. “Extrategic Dashboard - Faber Tactical Asset Allocation (Updated).” Extradash.com, extradash.com/en/strategies/models/5/faber-tactical-asset-allocation/. Accessed 16 Sept. 2023.
[4]. Faber, Meb, “Global Value: Building Trading Models with the 10 Year CAPE” , August 14, 2012. Cambria Quantitative Research, No. 5, August 2012, Available at SSRN: https://ssrn.com/abstract=2129474
[5]. Zhou, Liang, and Xiaofeng Wei. “Faber’s Tactical Asset Allocation and Timing Effect Test Based on Chinese Capital Market Data.” Financial Development Research, vol. 72, no. 07, 19 Mar. 2019, pp. 72–78, https://doi.org/10.19647/j.cnki.37-1462/f.2019.03.010.