


1. Introduction
Since 2019, COVID-19 has spread all over the world. On February 23, 2023, China officially announced its exit from the pandemic. On May 5 of the same year, the World Health Organization announced that the epidemic would no longer constitute a “public health emergency of international concern.” However, the economy of China has become worse because of COVID-19. One of the impacts is the reduction of consumption. In China, all industries are affected, and people tend to reduce consumption, which means people might deposit money in the bank rather than spend it [1]. Due to the limited disposable income and the negative attitude towards economic prospects, people might reduce confidence and refuse to purchase goods.
Further, household wealth might fall. Because trade and commerce were disrupted, consumers could not purchase goods they needed offline. Individuals began to use online shopping to get those products. Even the pandemic has brought the development of e-commerce forward by four to five years [2].
However, social media plays a vital role in e-commerce. Many people use social media to share their shopping experiences and look for product information [3]. In addition, digital marketing allows customers to search and get suitable information via different platforms. Therefore, brands have increased their advertising budget on social media. A survey showed that from February 2020 to June 2020, the budgets spent on social media increased from 13.3% to 23.2% in total marketing budgets [4].
Along with COVID-19 and the wide use of social media by individuals and companies, a new chapter is beginning for the worldwide mobile advertising sector. In the USA, almost 70% of people claimed to use Facebook, and more than 80% admitted to watching videos on YouTube in 2021, with significantly higher percentages among the younger generation [5]. Another research pointed out that, as of the end of 2021, nearly 57% of people were using at least one social media [6]. As such, more and more companies have shifted from traditional media advertising platforms to social media as advertising platforms and are increasingly investing in social media advertising, which accounts for a larger share of their advertising budget. Likewise, businesses must select from various social media to run efficient marketing efforts [7].
Previous literature has focused on measuring online advertising value and attitude because, in the absence of clear standards and limited investment budgets, advertisers need guidance to make investment strategies accordingly. Each advertising campaign has specific target audiences and different social media platforms determined based on specific goals [8]. The advertising value model is the most cited model, which was come up with by Ducoffe [9]. It can effectively examine internet users’ attitudes toward online advertising. It uses the three advertising characteristics to describe the antecedents of the formation of advertising value and reveals the correlation between advertising value and advertising attitude. In this model, Lee and Cho considered that information and Entertainment can boost consumers’ appreciation for advertisements [10]. They play a significant part in establishing consumers’ advertising attitudes. Irritation suggests commercials make advertising viewers feel bothered, outraged, or overly controlled. An excessive amount of information can be considered irritating and can hurt advertising attitudes [11].
However, more about the epidemic’s impact and disposable income on social media advertising value, advertising attitudes, and purchasing intention must be known. If this impact exists, the changes in relevant factors brought about by this global event cannot be ignored in future research. Utilizing the advertisement value model, this paper studies the factors affecting social media advertisements’ value and audiences’ advertising attitudes. Because advertising aims to sell products and enhance brand image, it is critical to assess advertising value and audiences’ purchasing intention and behavior [12]. On the one hand, if audiences hold a more positive attitude towards advertisements, they are more willing to buy the goods [13]. On the other hand, a positive advertising attitude can be enhanced by high perceived credibility and promote the emergence of consumer behavior [14]. Therefore, in this paper, perceived credibility also became a consideration factor.
According to the above statement, this paper collects personal information. It uses the advertising value model and perceived credibility to assess the advertising attitude level in Chinese residents’ social media ads. It analyzes the epidemic’s impact and disposable income on advertising attitude and purchase intention. For this purpose, this paper modified the advertisements model used in previous studies to reflect the Chinese residents’ attitudes toward social media ads.
This paper has the following three contributions to social media advertising theory or the advertising industry:
(1) Starting from the post-pandemic era for the first time, the finding in this paper will be helpful to know if COVID-19 has affected the advertising value model’s indicators. And, shown by the results, the more an individual feels that COVID-19 has an impact on him personally, the more that person will have a negative tendency toward advertising value, advertising attitude, and purchase intention;
(2) This paper provides an angle for later scholars to use this model in China. In this paper, only perceived credibility affects advertising value, but other measurement dimensions in advertising value model have no effect;
(3) The findings of this paper will help advertisers develop advertising strategies in the post-pandemic era.
2. Theories and Hypotheses
2.1. Advertising Value Model and Advertising Credibility
Ducoffe’s advertising value model can calculate perceived advertising value and perceived advertising attitude. In Ducoffe’s study, informativeness, entertainment, and irritation of advertisements also need to be collected to evaluate advertisements [9]. Furthermore, informativeness and entertainment are considered beneficial aspects of online advertisements, whereas irritation reflects advertising audiences’ unfavorable perception of poorly presented advertisements. Ducoffe’s descriptions are as follows.
Advertising value includes advertising audiences’ perception of the relative value and utility.
Informativeness means that audiences can find product-relevant information from advertising, which is convenient.
Entertainment aims to make advertisements more pleasant. While watching the advertisements, advertising audiences will be interested.
Irritation indicates the annoying aspects of advertising, such as deception, perplexity, and enticement.
Advertising credibility is the level of trust in an advertisement by its audience [15]. This is the perception of the authenticity of its content. Credible advertising reassures consumers and increases the beneficial influence on advertising value.
This paper presents the following hypotheses:
H1a. Perceived informativeness (INF) positively affects advertising value (ADV).
H1b. Perceived entertainment (ENT) positively affects advertising value (ADV).
H1c. Perceived irritation (IRR) negatively affects advertising value (ADV).
H1d. Perceived credibility (CRE) positively affects advertising value (ADV).
2.2. Purchase Intention, Advertising Attitude and Advertising Value
Purchase intention refers to how likely a customer is to purchase the product mentioned in the future after viewing an advertisement [16]. Past research has demonstrated that the purchasing intention of advertising audiences is directly or indirectly influenced by their perception of the advertising value. Advertising attitude means the degree to which advertising audiences perceive advertising to be helpful and valuable to them. When users attribute this subjective evaluation to the advertising value, they develop a positive or negative attitude toward it [17]. Purchase intention will also be affected by the advertising attitude. When the attitude towards advertising is positive, purchasing intention will increase accordingly [18].
Thus, this paper proposes the following hypothesis:
H2a. Advertising value (ADV) positively affects advertising attitude (AAT).
H2b. Advertising value (ADV) positively affects purchase intention (PIN).
H3. Advertising attitude (AAT) positively affects purchase intention (PIN).
2.3. Other Factors and Location
Like previous discussions, past research has demonstrated that COVID-19 has caused adverse effects. Residents in China have begun to reduce the consumption. However, whether the disposable income and the influence caused by COVID-19 affect the advertising value, attitude, and even purchase intention is unknown. Likewise, whether people living in different cities show different responses is unknown. Because the INF, ENT, IRR, and CRE were considered to influence advertising value. Thus, this paper proposes the following hypotheses:
H4a. City affects Perceived informativeness (INF).
H4b. City affects Perceived entertainment (ENT).
H4c. City affects Perceived irritation (IRR).
H4d. City affects Perceived credibility (CRE).
H5a. Disposable income (INC) affects Perceived informativeness (INF).
H5b. Disposable income (INC) affects Perceived entertainment (ENT).
H5c. Disposable income (INC) affects Perceived irritation (IRR).
H5d. Disposable income (INC) affects Perceived credibility (CRE).
H6a. Influence caused by COVID-19(ICC) affects Perceived informativeness (INF).
H6b. Influence caused by COVID-19(ICC) affects Perceived entertainment (ENT).
H6c. Influence caused by COVID-19(ICC) affects Perceived irritation (IRR).
H6d. Influence caused by COVID-19(ICC) affects Perceived credibility (CRE).
Due to the need for the “One Belt and Road” construction, Chengdu, the capital of Sichuan Province, was selected as a key development city [19]. So, Chengdu has rapidly developed and become a new first-tier city in China. However, only some of the cities in Sichuan province developed, like Chengdu. Due to the different geographical characteristics and national policy priorities, the development of each city has also shown differences [20]. Due to the uneven development of cities in Sichuan, the naturally formed gradient can be used as a gradient division for research. Therefore, this paper takes Sichuan as an example for research.
3. Data Collecting
3.1. Measurement Development
Delivered via social media, a questionnaire had been developed to collect data from Sichuan residents. The measurement of research model construction is adapted from previous relevant research. After doing a literature review, the author organized the measurement items of this paper. It is shown in Table 1. Each questionnaire question was designed with a five-level Likert scale, and respondents were requested to answer all the questions. Each answer level shows the degree of respondents’ agreement toward this question (1 refers to strong opposition; 5 refers to strong agreement). Only the questions items related to IRR utilize the reverse scoring method, which means if respondents choose to strongly agree, their answer would be given one score.
Table 1: Variable name and question item.
Variable name | Question item |
INF= Informativeness | |
inf1 | Advertisements on social media contain sufficient information |
inf2 | Advertisements on social media provide the necessary information |
inf3 | Advertisements on social media provide present information that is highly timely |
ENT= Entertainment | |
ent1 | Advertisements on social media are entertaining |
ent2 | Advertisements on social media are comfortable |
ent3 | Advertisements on social media are lighthearted |
IRR= irritation | |
irr1 | The number and content of social media advertisements are annoying |
irr2 | Social media advertising insults intelligence in terms of content |
irr3 | Social media advertising is too numerous in terms of quantity |
CRE= Perceived credibility | |
cre1 | Social media advertising content can serve as a reference for my consumption |
cre2 | The credibility of social media advertising content is high |
cre3 | I believe in advertisements on social media |
ADV=Advertising value | |
adv1 | Advertisements on social media are very valuable |
adv2 | Advertisements on social media are very useful |
adv3 | Social media advertising is very important |
PIN= Purchase intention | |
pin1 | Social media advertising always arouses my purchasing desire |
pin2 | I bought the item because I watched the advertisements |
pin3 | I am more likely to purchase products due to advertising than in the past |
AAT= Advertising attitude | |
aat1 | I think social media is good as an advertising medium |
aat2 | I like to see advertisements on social media |
aat3 | Compared to the past, I have a more positive view of social media advertisements |
The basis for excluding invalid questionnaires is the following:
(1) The interviewee answers carefully, and there is no logical inconsistency in the answers before and after.
(2) Randomly insert attention detection questions through the system, such as what the first three words of a poem are.
(3) The interviewee takes longer to answer than the number of questions multiplied by four seconds.
(4) The answers’ IP addresses, phone numbers, and accounts are unique.
3.2. Descriptive Statistics
By the end of the survey, 254 valid questionnaires had been collected. Among 254 valid questionnaires, we further screened 219 questionnaires with IP addresses in Sichuan Province as the final ones for analysis. Table 2 shows the personal information of respondents, which is considered demographic characteristics.
Table 2: Demographic characteristics.
Division | Category | Frequency | % |
Gender | Male | 77 | 35.20% |
Female | 142 | 64.80% | |
Age | 22 years or less | 19 | 8.70% |
23-38 years | 140 | 63.90% | |
39-54 years | 52 | 23.70% | |
55 years or above | 8 | 3.70% | |
Education background | Junior high school education or below | 6 | 2.70% |
High school or technical secondary school education | 27 | 12.30% | |
College degree | 31 | 14.20% | |
Bachelor degree | 138 | 63.00% | |
Graduate degree or above | 17 | 7.80% | |
Period of use | Less than 1 year | 8 | 3.70% |
1-2 years | 11 | 5.00% | |
2-3 years | 22 | 10.00% | |
More than 3 years | 178 | 81.30% | |
Hours of use (per day) | Less than 1 hour | 15 | 6.80% |
1-3 hours | 101 | 46.10% | |
3-5 hours | 56 | 25.60% | |
More than 5 hours | 47 | 21.50% | |
Disposable income | 1000 yuan and below | 9 | 4.10% |
1001-3000 yuan | 39 | 17.80% | |
3001-5000 yuan | 53 | 24.20% | |
5001-7000 yuan | 48 | 21.90% | |
7001-9000 yuan | 29 | 13.20% | |
9001 yuan and above | 41 | 18.70% | |
Location | Chengdu, Sichuan | 111 | 50.70% |
Other cities, Sichuan | 108 | 49.30% |
The sample comprises 77 males (35.20%) and 142 females (64.80 percent). Many respondents (140, or 63.90%) are between 23 and 38. They are the main consumer force. Most respondents (138, or 63%) had a bachelor’s degree, followed by high or technical secondary school education (27, or 12.30%). 46.10% (101 respondents) spent 1-3 hours daily using social media, whereas 21.5% (47 respondents) spent more than 5 hours. Most respondents (178, 81.30%) have used social media for over three years. As for the monthly disposable income, most people are concentrated in the 3001-7000 yuan (46.10%), and most respondents (53, or 24.20%) have incomes ranging from 3001 to 5000 yuan. The respondents’ quantity of separated two groups (Chengdu and other cities in Sichuan) is relatively balanced for the location.
For the advertising value model, each measurement scale’s value is shown in Table 3. Overall, respondents generally rated social media advertising positively. It should be noted that social media advertising has caused distress to respondents, and this distress is mainly caused by quantity rather than content (only irr2’s average value = 3.32>3). For perceived credibility, respondents only acknowledge that social media advertising can serve as a reference for their consumption and are not certain that its content or advertising itself is trustworthy. The score of advertising attitude shows respondents think social media is an excellent platform to watch advertisements, and they hold a more positive attitude towards that. However, respondents are still determining if they like advertising. They may want to access social media advertising as long as it will not distress them.
Table 3: Measure scale’s value.
measure scale | average value | standard deviation | variance | measure scale | average value | standard deviation | variance |
INF | 3.68 | 0.86 | 0.73 | ENT | 3.54 | 0.98 | 0.97 |
inf1 | 3.64 | 0.95 | 0.89 | ent1 | 3.75 | 1.03 | 1.07 |
inf2 | 3.69 | 1.06 | 1.12 | ent2 | 3.35 | 1.12 | 1.26 |
inf3 | 3.72 | 1.05 | 1.09 | ent3 | 3.52 | 1.17 | 1.38 |
IRR | 2.89 | 0.99 | 0.99 | CRE | 3.22 | 0.94 | 0.88 |
Irr1 | 2.87 | 1.14 | 1.31 | cre1 | 3.58 | 0.94 | 0.89 |
Irr2 | 3.32 | 1.18 | 1.38 | cre2 | 3.07 | 1.10 | 1.22 |
Irr3 | 2.49 | 1.19 | 1.43 | cre3 | 3.02 | 1.13 | 1.28 |
ADV | 3.37 | 0.93 | 0.86 | PIN | 3.27 | 1.05 | 1.09 |
adv1 | 3.36 | 1.02 | 1.05 | pin1 | 3.33 | 1.05 | 1.11 |
adv2 | 3.48 | 1.01 | 1.02 | pin2 | 3.22 | 1.20 | 1.43 |
adv3 | 3.26 | 1.12 | 1.25 | pin3 | 3.26 | 1.20 | 1.44 |
AAT | 3.36 | 0.98 | 0.96 | ||||
aat1 | 3.64 | 0.96 | 0.93 | ||||
aat2 | 3.00 | 1.24 | 1.53 | ||||
aat3 | 3.44 | 1.16 | 1.35 |
The paper also counted the respondents’ perceptions of the degree of impact of the epidemic on individuals and the change in the frequency with which they buy goods due to social media advertisements compared to before the epidemic. This paper gave respondents a scale of 11 levels, ranging from negative to positive, to collect data and assigned scores of 1-11 for calculation. The result is shown in Table 4. Respondents report that their economic income level and quality of life improved compared to themselves before COVID-19 broke out. Moreover, purchase behaviors occurring because of social media advertising also slightly increase. This result shows an opposite phenomenon than other studies. So, the author separately checks all the data in different sample groups. The results are shown in Table 4. It reports that COVID-19 seems not to influence most individuals’ lives, or the influence caused by COVID-19 has been dismissed. Compared with the period before COVID-19 broke out, the frequency of purchase behaviors increased, although, in sample 4, the value shows a decrease in frequency with a slight degree (only a decrease of 0.06%).
Table 4: Subjective perception of changes before and after the epidemic.
average value | standard deviation | variance | |
Sample 1(Chengdu and other cities in Sichuan province) n=219 | |||
purchase behavior | 6.93 | 2.26 | 5.09 |
influence of COVID-19(ICC) | 6.38 | 2.19 | 4.80 |
Sample 2(Chengdu) n=111 | |||
purchase behavior | 6.96 | 2.29 | 5.25 |
influence of COVID-19(ICC) | 6.30 | 2.06 | 4.25 |
Sample 3(other cities in Sichuan province) n=108 | |||
purchase behavior | 6.89 | 2.23 | 4.96 |
influence of COVID-19(ICC) | 6.47 | 2.32 | 5.39 |
Sample 4(other cities in China but not in Sichuan province) n=35 | |||
purchase behavior | 5.94 | 2.74 | 7.53 |
influence of COVID-19(ICC) | 6.03 | 2.62 | 6.85 |
Notes: The higher the ICC value, the smaller the impact of COVID-19 on the living standard or income level of the respondents | |||
4. Results
4.1. Structural Model Estimation
First of all, this paper evaluated the measurement model [21]. Table 5 shows the results of the above indicators. The author uses composite reliability and Cronbach’s α to measure the reliability. Only if the composite reliability and Cronbach’s α values are more than 0.7 can the study be considered reliable. This measure model is reliable because all those values are more than 0.7.
Meanwhile, Average variance extracted (AVE) values are all more than 0.5, so the convergent validity is acceptable. Indicator loading should be more than 0.7, and all indicator loading values in this paper satisfy this requirement. In general, all results satisfy this requirement.
Table 6 shows the inter-construct correlations check. The square root of the AVE is shown on the main diagonal. According to the Fornell-Larcker criterion, if this value is more than all values on its corresponding rows and columns, it is said to have discriminant validity. In sum, the model in this paper shows sufficient validity and reliability.
Table 5: Reliability testing.
Indicator loading | Cronbach’α | Composite reliability | AVE | |
INF | 0.791 | 0.794 | 0.708 | |
inf1 | 0.879 | |||
inf2 | 0.864 | |||
inf3 | 0.777 | |||
ENT | 0.860 | 0.868 | 0.782 | |
ent1 | 0.847 | |||
ent2 | 0.908 | |||
ent3 | 0.898 | |||
IRR | 0.808 | 0.812 | 0.723 | |
Irr1 | 0.877 | |||
Irr2 | 0.852 | |||
Irr3 | 0.821 | |||
CRE | 0.859 | 0.874 | 0.781 | |
cre1 | 0.825 | |||
cre2 | 0.904 | |||
cre3 | 0.919 | |||
ADV | 0.857 | 0.859 | 0.779 | |
adv1 | 0.888 | |||
adv2 | 0.876 | |||
adv3 | 0.884 | |||
PIN | 0.894 | 0.859 | 0.827 | |
pin1 | 0.909 | |||
pin2 | 0.910 | |||
pin3 | 0.909 | |||
AAT | 0.840 | 0.847 | 0.764 | |
aat1 | 0.855 | |||
aat2 | 0.867 | |||
aat3 | 0.899 |
Table 6: The average variance extracted and inter-construct correlations.
AAT | ADV | CRE | ENT | INF | IRR | PIN | |
AAT | 0.874 | ||||||
ADV | 0.727 | 0.882 | |||||
CRE | 0.741 | 0.746 | 0.884 | ||||
ENT | 0.584 | 0.586 | 0.757 | 0.884 | |||
INF | 0.565 | 0.582 | 0.674 | 0.672 | 0.841 | ||
IRR | 0.364 | 0.262 | 0.403 | 0.423 | 0.185 | 0.85 | |
PIN | 0.756 | 0.736 | 0.732 | 0.597 | 0.570 | 0.339 | 0.910 |
4.2. Hypotheses Result
The structural model was analyzed for the 219 sample who lived in Sichuan when took this survey. Results are shown in Figure 1. In Figure 1, R2, path coefficients and T-value (in parentheses) are shown. The model fit is excellent (SRMR=0.057<0.08).
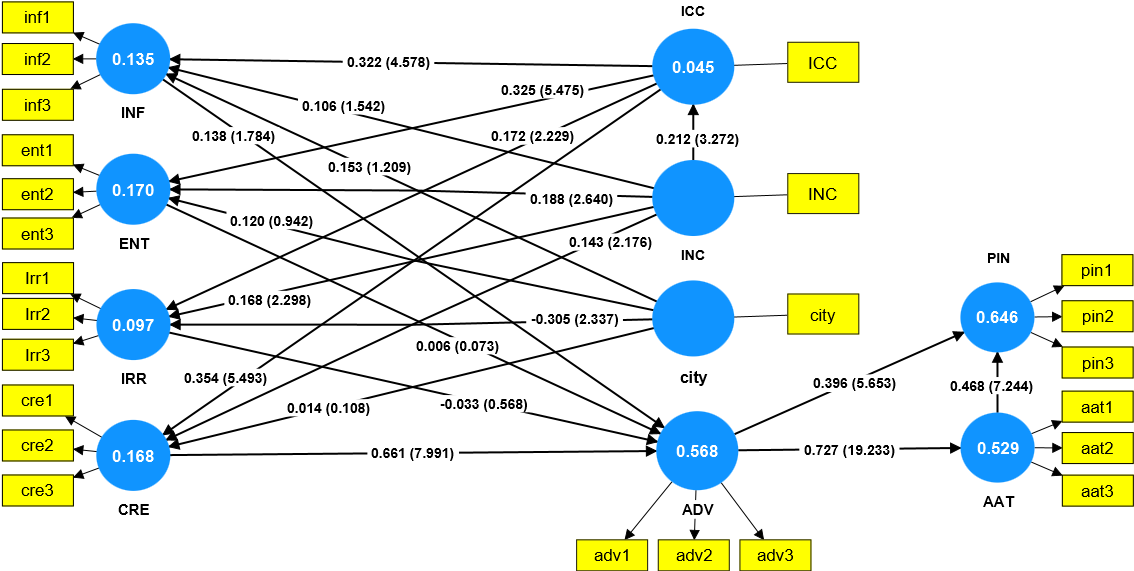
Figure 1: Full research model.
In Figure 1, one path corresponds to one hypothesis (except for INC->ICC). The bootstrapping procedure tests the t-values, path coefficient, and R2 for path and measurement dimension with Smart PLS 3.0. All R2 is above 0.02, and only two (IRR and ICC) are below 0.1; if the T-value is more than 1.96, the path is significant; if the path coefficient is positive, the influence is positive.
For all the hypotheses, the support results are shown in Table 7. For Table 7, except for the path coefficient of H4c, all the path coefficient is positive. This also suggests that people living in Chengdu are more sensitive to perceived irritation (“Chengdu” is set to 1, “Other Cities” is set to 2). This result reports that the influence caused by COVID-19(ICC), disposable income (INC), and city affect all or part of the advertising value indicators. However, only perceived credibility affects advertising value.
Finally, to find out if the indicator (CRE) would show specific indirect effects to let ICC, INC, and City eventually affect ADV, AAT, and PIN, the author checked the specific indirect effects’ value, and the support results are shown in Table 8. The city only affects perceived irritation, but it fails to indirectly affect advertising value, advertising attitude, and purchase behavior.
Table 7: Support results of hypotheses.
Hypotheses | Path coefficient | T-value | |
H1d | Perceived credibility (CRE) positively affects advertising value (ADV) | 0.661 | 7.991*** |
H2a | Advertising value (ADV) positively affects advertising attitude (AAT) | 0.727 | 19.233*** |
H2b | Advertising value (ADV) positively affects purchase intention (PIN) | 0.396 | 5.653*** |
H3 | Advertising attitude (AAT) positively affects purchase intention (PIN) | 0.468 | 7.244*** |
H4c | City affects Perceived irritation (IRR) | -0.305 | 2.337*** |
H5b | Disposable income (INC) affects Perceived entertainment (ENT) | 0.188 | 2.640*** |
H5c | Disposable income (INC) affects Perceived irritation (IRR) | 0.168 | 2.298*** |
H5d | Disposable income (INC) affects Perceived credibility (CRE) | 0.143 | 2.176*** |
H6a | Influence caused by COVID-19(ICC) affects Perceived informativeness (INF). | 0.322 | 4.578*** |
H6b | Influence caused by COVID-19(ICC) affects Perceived entertainment (ENT) | 0.325 | 5.475*** |
H6c | Influence caused by COVID-19(ICC) affects Perceived irritation (IRR) | 0.172 | 2.229*** |
H6d | Influence caused by COVID-19(ICC) affects Perceived credibility (CRE) | 0.143 | 2.176*** |
Notes: *** means p-value<0.05 | |||
Table 8: Specific indirect effects result.
Path | Path coefficient | T-value |
ICC -> CRE -> ADV | 0.234 | 4.445 |
ICC -> CRE -> ADV -> AAT | 0.170 | 4.114 |
ICC -> CRE -> ADV -> AAT -> PIN | 0.080 | 3.571 |
ICC -> CRE -> ADV -> PIN | 0.093 | 3.324 |
INC -> CRE -> ADV -> AAT | 0.069 | 2.101 |
INC -> CRE -> ADV | 0.095 | 2.056 |
INC -> CRE -> ADV -> AAT -> PIN | 0.032 | 2.032 |
5. Discussion
5.1. Discussion on Advertising Value Mode and Purchase Behavior
Overall, the advertising value model presented in this paper differs from previous studies. Informativeness, entertainment, and irritation are no longer factors affecting advertising value. Perceived credibility becomes the only factor that affects advertising value. Social media advertising audiences in the post-pandemic focus on perceived credibility, which means they can distinguish which are advertisements while hoping that the advertising content is trustworthy. During the COVID-19 pandemic, individuals’ consumption behavior was mostly panic consumption. The panic that causes this behavior stems from a fear of the unknown, and consumers will transform this fear of a lack of understanding of the crisis into behaviors considered comforting, providing safety, or relieving stress. This may also explain why the demand for credibility in advertising has increased because consumers cannot distinguish between real and false information in advertisements. This also can explain why the purchase behavior increased in this paper. As for why other factors no longer affect advertising value, it may be because when people’s demand for credibility sharply increases, the influence of other factors decreases.
For the advertisers, although, in this paper, irritation does not affect the advertising value, it is considered to have a negative effect. So, the frequency of advertising push should also be appropriately reduced to avoid causing consumer resistance to social media advertising. Meanwhile, advertisers should make the contents and texts more credible when creating advertisements rather than focusing solely on entertainment or informativeness.
5.2. Discussion on Influence Caused by COVID-19 and Disposable Income
The results show that the more significant the impact of COVID-19 on a person’s living standards or economic income, the more wary they will be about advertising on social media. For respondents, the more disposable income, the smaller the influence caused by COVID-19 on their living standards and income levels. This is because, during the COVID-19 pandemic, consumers will prioritize basic needs. That is, they will prioritize hoarding non-durable goods conducive to survival, such as food, water, and medicine. Low disposable income means weak purchasing power. Therefore, they need more money when they use their disposable income to purchase the above goods. At this point, consumers’ purchasing behavior will become more cautious. The manifestation of this change is the increasing demand for perceived credibility. Consumers will only engage in purchasing behavior when advertisements are trusted by consumers and products shown in social media advertisements are helpful.
5.3. Limitations and Future Work
This paper is only based on the Sichuan region and cannot represent the entire Chinese population. The economic conditions and income levels vary in different regions, and because of that, results may exhibit different tendencies. Meanwhile, in this sample, the proportion of female respondents is too high, but in some studies, it is believed that there are differences in advertising attitudes between men and women. In future research, the scope of the respondent’s region can be expanded to achieve more accurate measurements. Moreover, the rate of respondents’ gender should be more average.
To simplify the survey, the influence caused by COVID-19, only one problem has been designed and measured. With more questions, its explanatory power could be more substantial. Through it, we cannot directly find out the specific impact of the epidemic, which has caused changes in advertising attitudes, but only to prove that there is a correlation between them. In future work, more questions can be developed to measure the influence caused by COVID-19 to find the exact factor that affects audiences’ attitudes toward advertising. At the same time, the sample size should be expanded.
Meanwhile, whether the impact of ICC on advertising value is long-term still needs to be verified. Whether the basic factors of the advertising value model fail to affect advertising value needs to be verified.
6. Conclusion
Whether in their personal lives or economic circumstances, the pandemic has caused them to change to a greater or lesser extent, and current research has identified COVID-19 as an unprecedented event. In this paper, the author developed three new factors to measure the advertising value model and found that COVID-19 and disposable income influence advertising value, advertising attitude, and purchase intention via perceived credibility. This suggests that future researchers pay attention to the sustained impact of this epidemic. In addition, the findings suggest that fundamental elements of the advertising value model may no longer affect advertising value.
References
[1]. LIU, J. (2020, December). Statistical analysis on the change of economic condition in China under the influence of COVID-19. In 2020 international conference on big data economy and information management (BDEIM) (pp. 95-100). IEEE.
[2]. Heng Wei, L., Chuan Huat, O., and Arumugam, P. V. (2023). Social media communication with intensified pandemic fears: evaluating the relative impact of user-and firm-generated content on brand loyalty. Asia-Pacific Journal of Business Administration, 15(2), 161-187.
[3]. Dwivedi, Y. K., Ismagilova, E., Hughes, D. L., Carlson, J., Filieri, R., Jacobson, J., ... and Wang, Y. (2021). Setting the future of digital and social media marketing research: Perspectives and research propositions. International Journal of Information Management, 59, 102168.
[4]. Moorman, C., and McCarthy, T. (2021). CMOs: Adapt your social media strategy for a post-pandemic world. Harvard Business Review.
[5]. Pew Research Center (2021), Social media use in 2021, Pew Research Center, Retrieved from www.pewresearch.org/internet/2021/04/07/social-media-use-in-2021/
[6]. Liao, S. H., Widowati, R., and Lin, W. C. (2023). Data mining analytics investigate WeChat users’ behaviours: online social media and social commerce development. The Electronic Library, 41(2/3), 204-222.
[7]. Chi, H. H. (2011). Interactive digital advertising vs. virtual brand community: Exploratory study of user motivation and social media marketing responses in Taiwan. Journal of interactive advertising, 12(1), 44-61.
[8]. Belanche, D., Cenjor, I., and Pérez-Rueda, A. (2019). Instagram Stories versus Facebook Wall: an advertising effectiveness analysis. Spanish Journal of Marketing-ESIC, 23(1), 69-94.
[9]. Ducoffe, R. H. (1996). Advertising value and advertising on the web. Journal of advertising research, 36(5), 21-21.
[10]. Lee, H., and Cho, C. H. (2019). An empirical investigation on the antecedents of consumers’ cognitions of and attitudes towards digital signage advertising. International Journal of Advertising, 38(1), 97-115.
[11]. Hausman, A. V., and Siekpe, J. S. (2009). The effect of web interface features on consumer online purchase intentions. Journal of business research, 62(1), 5-13.
[12]. Furrer, O., Sudharshan, D., Tsiotsou, R. H., and Liu, B. S. (2016). A framework for innovative service design. The Service Industries Journal, 36(9-10), 452-471.
[13]. Chang, H. H., Lu, Y. Y., and Lin, S. C. (2020). An elaboration likelihood model of consumer respond action to facebook second-hand marketplace: Impulsiveness as a moderator. Information and Management, 57(2), 103171.
[14]. Wang, Y., and Genç, E. (2019). Path to effective mobile advertising in Asian markets: Credibility, entertainment and peer influence. Asia Pacific Journal of Marketing and Logistics, 31(1), 55-80.
[15]. Brackett, L. K., and Carr, B. N. (2001). Cyberspace advertising vs. other media: Consumer vs. mature student attitudes. Journal of advertising research, 41(5), 23-32.
[16]. Ko, H., Cho, C. H., and Roberts, M. S. (2005). Internet uses and gratifications: A structural equation model of interactive advertising. Journal of advertising, 34(2), 57-70.
[17]. Gvili, Y., and Levy, S. (2016). Antecedents of attitudes toward eWOM communication: differences across channels. Internet Research, 26(5), 1030-1051.
[18]. Herrando, C., and Martín-De Hoyos, M. J. (2022). Influencer endorsement posts and their effects on advertising attitudes and purchase intentions. International Journal of Consumer Studies, 46(6), 2288-2299.
[19]. Tsui, S., Wong, E., Chi, L., and Tiejun, W. (2017). One belt, one road. Monthly Review, 1.
[20]. Liu, Y., Yang, R., Sun, M., Zhang, L., Li, X., Meng, L., Wang, Y. and Liu, Q. (2022). Regional sustainable development strategy based on the coordination between ecology and economy: A case study of Sichuan Province, China. Ecological Indicators, 134, 108445.
[21]. Hair, J. F., Sarstedt, M., Ringle, C. M., and Mena, J. A. (2012). An assessment of the use of partial least squares structural equation modeling in marketing research. Journal of the academy of marketing science, 40, 414-433.
Cite this article
Zhu,H. (2023). Chinese Residents’ Attitudes Towards Social Media Advertising in the Post-pandemic Era: Taking Sichuan as an Example. Communications in Humanities Research,19,74-86.
Data availability
The datasets used and/or analyzed during the current study will be available from the authors upon reasonable request.
Disclaimer/Publisher's Note
The statements, opinions and data contained in all publications are solely those of the individual author(s) and contributor(s) and not of EWA Publishing and/or the editor(s). EWA Publishing and/or the editor(s) disclaim responsibility for any injury to people or property resulting from any ideas, methods, instructions or products referred to in the content.
About volume
Volume title: Proceedings of the 2nd International Conference on Interdisciplinary Humanities and Communication Studies
© 2024 by the author(s). Licensee EWA Publishing, Oxford, UK. This article is an open access article distributed under the terms and
conditions of the Creative Commons Attribution (CC BY) license. Authors who
publish this series agree to the following terms:
1. Authors retain copyright and grant the series right of first publication with the work simultaneously licensed under a Creative Commons
Attribution License that allows others to share the work with an acknowledgment of the work's authorship and initial publication in this
series.
2. Authors are able to enter into separate, additional contractual arrangements for the non-exclusive distribution of the series's published
version of the work (e.g., post it to an institutional repository or publish it in a book), with an acknowledgment of its initial
publication in this series.
3. Authors are permitted and encouraged to post their work online (e.g., in institutional repositories or on their website) prior to and
during the submission process, as it can lead to productive exchanges, as well as earlier and greater citation of published work (See
Open access policy for details).
References
[1]. LIU, J. (2020, December). Statistical analysis on the change of economic condition in China under the influence of COVID-19. In 2020 international conference on big data economy and information management (BDEIM) (pp. 95-100). IEEE.
[2]. Heng Wei, L., Chuan Huat, O., and Arumugam, P. V. (2023). Social media communication with intensified pandemic fears: evaluating the relative impact of user-and firm-generated content on brand loyalty. Asia-Pacific Journal of Business Administration, 15(2), 161-187.
[3]. Dwivedi, Y. K., Ismagilova, E., Hughes, D. L., Carlson, J., Filieri, R., Jacobson, J., ... and Wang, Y. (2021). Setting the future of digital and social media marketing research: Perspectives and research propositions. International Journal of Information Management, 59, 102168.
[4]. Moorman, C., and McCarthy, T. (2021). CMOs: Adapt your social media strategy for a post-pandemic world. Harvard Business Review.
[5]. Pew Research Center (2021), Social media use in 2021, Pew Research Center, Retrieved from www.pewresearch.org/internet/2021/04/07/social-media-use-in-2021/
[6]. Liao, S. H., Widowati, R., and Lin, W. C. (2023). Data mining analytics investigate WeChat users’ behaviours: online social media and social commerce development. The Electronic Library, 41(2/3), 204-222.
[7]. Chi, H. H. (2011). Interactive digital advertising vs. virtual brand community: Exploratory study of user motivation and social media marketing responses in Taiwan. Journal of interactive advertising, 12(1), 44-61.
[8]. Belanche, D., Cenjor, I., and Pérez-Rueda, A. (2019). Instagram Stories versus Facebook Wall: an advertising effectiveness analysis. Spanish Journal of Marketing-ESIC, 23(1), 69-94.
[9]. Ducoffe, R. H. (1996). Advertising value and advertising on the web. Journal of advertising research, 36(5), 21-21.
[10]. Lee, H., and Cho, C. H. (2019). An empirical investigation on the antecedents of consumers’ cognitions of and attitudes towards digital signage advertising. International Journal of Advertising, 38(1), 97-115.
[11]. Hausman, A. V., and Siekpe, J. S. (2009). The effect of web interface features on consumer online purchase intentions. Journal of business research, 62(1), 5-13.
[12]. Furrer, O., Sudharshan, D., Tsiotsou, R. H., and Liu, B. S. (2016). A framework for innovative service design. The Service Industries Journal, 36(9-10), 452-471.
[13]. Chang, H. H., Lu, Y. Y., and Lin, S. C. (2020). An elaboration likelihood model of consumer respond action to facebook second-hand marketplace: Impulsiveness as a moderator. Information and Management, 57(2), 103171.
[14]. Wang, Y., and Genç, E. (2019). Path to effective mobile advertising in Asian markets: Credibility, entertainment and peer influence. Asia Pacific Journal of Marketing and Logistics, 31(1), 55-80.
[15]. Brackett, L. K., and Carr, B. N. (2001). Cyberspace advertising vs. other media: Consumer vs. mature student attitudes. Journal of advertising research, 41(5), 23-32.
[16]. Ko, H., Cho, C. H., and Roberts, M. S. (2005). Internet uses and gratifications: A structural equation model of interactive advertising. Journal of advertising, 34(2), 57-70.
[17]. Gvili, Y., and Levy, S. (2016). Antecedents of attitudes toward eWOM communication: differences across channels. Internet Research, 26(5), 1030-1051.
[18]. Herrando, C., and Martín-De Hoyos, M. J. (2022). Influencer endorsement posts and their effects on advertising attitudes and purchase intentions. International Journal of Consumer Studies, 46(6), 2288-2299.
[19]. Tsui, S., Wong, E., Chi, L., and Tiejun, W. (2017). One belt, one road. Monthly Review, 1.
[20]. Liu, Y., Yang, R., Sun, M., Zhang, L., Li, X., Meng, L., Wang, Y. and Liu, Q. (2022). Regional sustainable development strategy based on the coordination between ecology and economy: A case study of Sichuan Province, China. Ecological Indicators, 134, 108445.
[21]. Hair, J. F., Sarstedt, M., Ringle, C. M., and Mena, J. A. (2012). An assessment of the use of partial least squares structural equation modeling in marketing research. Journal of the academy of marketing science, 40, 414-433.