


1. Introduction
Industry upgrading is a key step to promote economic development in most countries, especially low and middle-income countries. By improving industries, countries can build effective techniques which can be really useful for countries to develop and improve their societies. Also, as industries improve, more job opportunities can be provided to citizens who do not have static income or are facing financial issues.
However, it has been hard to analyze this question because of data limitations on production input details. In this paper, the data is from the movie industry which provides detailed movie production data to shed light on this important question.
Movie production requires high standards of skills to produce high-quality movies. As technology has improved, movie quality has changed from black and white to 3D. The improvement in the movie industry is significant. What’s more, as an entertaining medium, movies are involved in everyone's daily life. Therefore, using movie industry data can be an obvious and understandable way to understand a country's industry development improvements.
In recent years, the number of movies produced by the domestic movie industry has expanded rapidly, becoming a billion-dollar industry. A dataset is constructed based on all movies shown in China between 2009 and 2018 by scraping all movie information from the Douban website, including the production country, release date, production team, and more.
Firstly, it shows that foreign movie ratings are higher than domestic movies. Furthermore, the composition is different. It finds that foreign moviemakers produce far more fiction movies than domestic producers. The number of fiction movies produced abroad is significantly different from the number produced domestically.
Fiction movies are a special type that requires more technical skills and financial support, especially large elite movie production teams. Based on the production team data, it finds that the size of visual effects team of foreign movies is significantly larger than domestic ones. This could be a factor in how foreign teams produce large amounts of fiction movies in short periods.
However, the domestic movie market has been catching up in the past few years. Compared to foreign movies, domestic films have largely improved in both quantity and number of visual effects teams. They catch up by hiring foreign visual effects team members. To quickly improve their own skills, hiring foreign experts seems the most efficient way to catch up to foreign movie industry technology in a short time.
These results provide insights into the channels behind industry upgrading. It shows that domestic movie producers caught up by hiring foreign visual effects teams. This successfully achieved the goal of matching foreign movie technology and significantly improving the domestic industry.
The paper proceeds as follows: Section II summarizes relevant literature and discusses contributions. Section III describes the context and data. The main analysis results are presented in Section IV. Section V presents conclusions.
2. Literature Review
Industry upgrading and technological catch-up have been widely studied in the economic development literature. A large body of research examines how developing countries can upgrade their industries and close the gap with more advanced economies[1,2,3,4]. Different channels and strategies for capability building have been proposed, including technology licensing, joint ventures, immigrant talent, and returnee entrepreneurs[5,6,7].
One important upgrading channel involves learning from other firms, both domestic and foreign. Learning often occurs through movement of skilled personnel between organizations[8]. By hiring experts from more advanced companies, laggard firms can acquire new technical and managerial knowledge. This builds capabilities and allows catch-up[9].
However, empirical analysis of knowledge transfers through expert hiring has been limited by data constraints on firm production, inputs, and human resources. Granular data on the composition of talent is especially scarce. The movie industry provides a rich setting to analyze these mechanisms because productions involve specialized technical skills and detailed credits data is available[10,11,12].
This paper contributes to the literature on industry upgrading by examining the case of China's film industry. Chinese domestic films have historically lagged in quality and technical capabilities compared to foreign films. Using unique data on film credits and production teams, it shows that how Chinese firms upgraded by hiring foreign visual effects experts. This facilitated rapid catch-up in the fictional film segment, requiring the most advanced technical skills. The analysis provides micro-level evidence on how strategic personnel moves can drive technological capability building, complementing prior quantitative studies.
3. Context
Every year, around 160 movies are shown in China. Of these, 40% are domestic and 60% are foreign movies. This is a more than five-billion dollar industry. Over the past ten years, the number of movie firms has also increased dramatically in China. However, the ratings and average box office returns of domestic movies have consistently been lower than foreign films.
The dataset was built by web-scraping movie information from Douban, the largest online community for reviewing movies in China. For each movie, the data was collected on its release date, production location, rating, and production team details through the website. This information helps me evaluate the quality of each movie and their investments, including production team choices. Furthermore, the box office data was scraped for each movie from Maoyan to reflect market demand and performance.
Figure 1 plots the total number of movies shown between 2009 and 2018. Figure 2 separates them into domestic and foreign films. It shows the number of domestic movies is significantly higher than imported foreign films. More importantly, while the number of foreign movies stayed constant at around 55 during this period, the number of domestic movies increased steadily from 70 in 2009 to 120 in 2015.
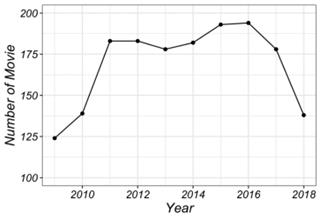
Figure 1: Total number of movies shown between 2009 and 2018
Figure1 uses the data from the Douban website, which plots the number of movies shown in each year between 2009 and 2018.
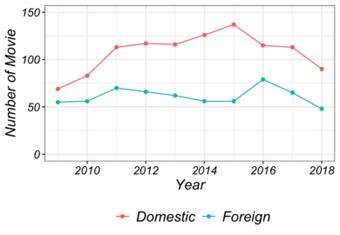
Figure 2: Total number of movies between domestic and foreign films
Figure2 uses the data from the Douban website, which plots the number of movies shown in each year between 2009 and 2018, and separate them by whether they are produced by domestic movie production firms or foreign producers.
4. Empirical Analysis
4.1. Comparison between Domestic and Foreign Movies
The analysis is started by comparing the average scores across movies from the Douban website, in order to find audience preferences between domestic and foreign films. In addition, audience votes also show differences of popularity between domestic and foreign movies.
Figure 3 shows the correlation between average scores of domestic and foreign movies from 2010 to 2018. The average score, as a proxy for movie quality, is significantly higher for foreign films than domestic ones. Similarly, Figure 4 plots the Douban votes received by both domestic and foreign movies. From the graph, it can be observed that foreign movies are more popular than domestic ones, with both having an increasing trend. Domestic movies in particular have a more remarkable upward trend than foreign films. In 2018, the average domestic movie vote caught up to foreign films.
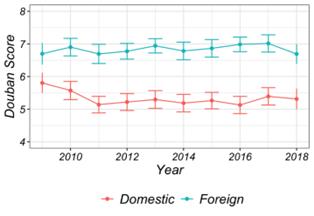
Figure 3: The correlation between average scores of domestic and foreign movies from 2010 to 2018
Figure3 uses the score of each movie from Douban website. Each movie’s score is calculated as the average of all audiences’ ratings between 2 and 10. The average scores between domestic movies and foreign movies are compared from 2009 until 2018.
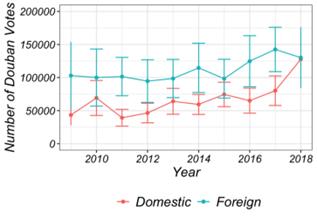
Figure 4: The correlation between Douban votes from 2010 to 2018
Figure4 uses the data on the number of votes from Douban website. Each movie has its own voting numbers according to the audience. The higher number of votes represents higher popularity among the audience. The number of votes on Douban are compared for both domestic movies and foreign movies from 2009 until 2018.
It next turns to Douban website votes to find differences between domestic and foreign movies. Figure 4 shows the correlation between Douban votes from 2010 to 2018. Foreign movies most likely get 100,000 - 150,000 votes, higher than domestic films. However, in 2018, the votes became nearly equal between both.
More interestingly, it finds both domestic and foreign movies prefer producing fiction films over other genres. Figure 5 shows the fiction movie percentage among domestic and foreign films from 2010 to 2018. Foreign movies produce significantly more fiction films than domestic ones. In 2014, around 50% of foreign movies were fiction, the highest percentage. Meanwhile, the figure shows the percentage of fiction films from domestic producers has increased over time.
Based on these results, it can be seen significant differences between domestic and foreign movies. Specifically, it shows that foreign films tend to get higher scores and votes on Douban compared to domestic ones. Since fiction movies require advanced technology, foreign films produce far more than domestic ones based on observation. But it can also be seen that domestic movies start to produce more fiction films year-over-year. Next section will analyze fiction movie production details to symmetrically show further differences between domestic and foreign films.
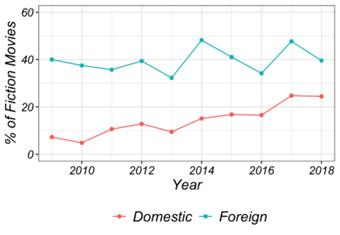
Figure 5: The fiction movie percentage among domestic and foreign films from 2010 to 2018.
Figure5 is according to the data of the number of fiction movies from Douban website. Fiction movies are identified as whether they are included in the fiction category or not on Douben website. According to the data start from 2009 to 2018, the percentage of fiction movies is calculated among all movies shown each year for domestic movies and foreign movies separately.
4.2. Production of Fiction Movies
This section compares the size of visual teams between fiction and non-fiction movies. The correlation between the number of visual team members and movie scores is also observed.
First, it compares visual team sizes for fiction and non-fiction films. Figure 6 shows the correlation between visual team member numbers for fiction and non-fiction movies from 2010 to 2018. Fiction movies have significantly more visual team members than non-fiction ones.
Figure 6: Number of Visual Team Members
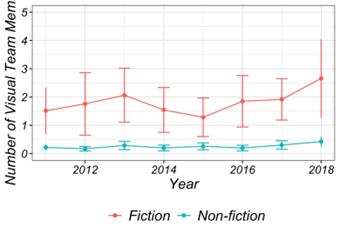
Figure 6: Number of Visual Team Members
Figure6 shows the number of visual team members for each movie. Through the figure, it compares two different categories: non-fiction versus fiction. According to the data from 2011 through 2018, the number of visual team members in fiction is significantly higher in non-fiction movies.
Figure7 describes the visual team size difference between foreign and domestic fiction films. Foreign movies have much larger teams than domestic ones. Additionally, team sizes have increased over time for both. Figures 6 and 7 together suggest foreign films are more likely to produce fiction movies than domestic ones. To determine movie quality, scores are crucial. So scores between movies with larger vs smaller visual teams are compared.
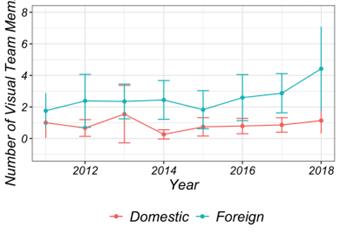
Figure 7: Number of Visual Team Members. (Within fiction movies)
Figure7 shows the number of visual team members for each fiction movie. Through the figure, it compares two different categories: foreign versus domestic. According to the data from 2011 through 2018, the number of visual team members in foreign fiction movies is significantly higher in domestic fiction movies.
Figures 8 and 9 plot the correlation between movie scores and number of visual team members. Figure 8 shows films with larger teams have significantly higher scores than others. Figure 9 is consistent, showing fiction films on average have larger teams and score higher.
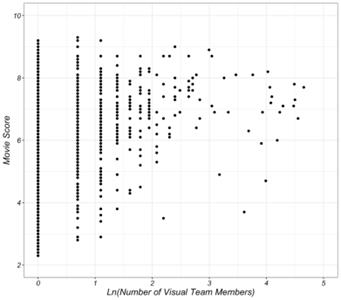
Figure 8: Number of Visual Team Members and Movie Scores.
Figure8 shows the correlation between movie scores and the number of visual team members. Each dot represents one movie. This figure shows that as the number of visual team members increases, the movie score also increases.
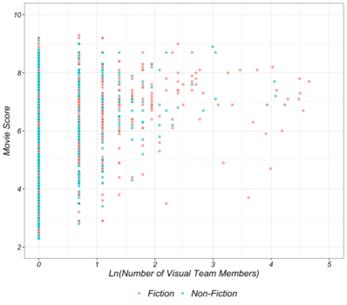
Figure 9: Number of Visual Team Members and Movie Scores. Fiction versus Non-fiction.
Figure9 shows the correlation between movie scores and the number of visual team members. Each dot represents one movie. This figure shows that as the number of visual team members increases, the movie score also increases. The red dots and the blue dots each represent fiction and non-fiction. Through the graph, both fiction and non-fiction movies exhibit positive correlations between the number of visual team members and movie scores.
Based on these results, it shows that fiction movies are a more technology-intensive category compared to other movie types. Domestic filmmakers are behind foreign ones in this dimension. Next section will explore how domestic filmmakers catch up in this specific category.
4.3. Production of Domestic Fiction Movies
Now it focus on how domestic movies started catching up to foreign ones in fiction film production, showing a large increase in domestic fiction movies. To demonstrate this, fiction movie quantities between domestic and foreign films are compared.
Figure 10 shows domestically produced fiction movies increased from 2009 to 2018, indicating domestic producers made more fiction films than before. In 2017, the maximum number of domestic fiction films were produced. In 2010, domestic movies had the least fiction films. Since the domestic curve is increasing, examining visual team sizes also shows domestic films catching up and improving technically with foreign ones.
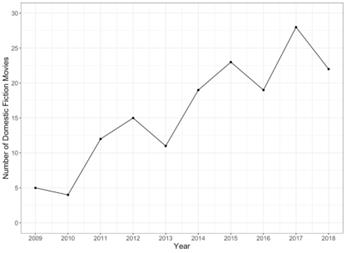
Figure 10: Number of Domestic fiction movies across years.
Figure10 plots the number of domestic fiction movies starting from 2009 until 2018
Figure 11 shows as time passed, more visual team members were added. The curve's upward slope indicates this. Big jumps occurred in 2010-2011 and 2016-2017. In 2014, total team members were lowest.
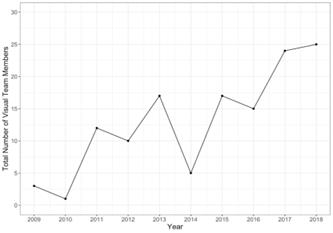
Figure 11: Total number of visual team members between 2009 and 2018.
Figure11 plots the total number of visual team members between 2009 and 2018 among domestic fiction movies.
Figure 12 shows the number of local visual team members first decreased then increased until 2013. The symmetric curve lacks large fluctuations. Local members were equal in 2011 and 2015. Though the graph shows little yearly difference, local members still only comprise around a quarter of total team members.
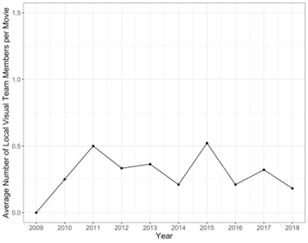
Figure 12: Average number of foreign visual team members per movie between 2009 and 2018.
Figure12 plots the number of visual team members who are local residents (Chinese teams) between 2009 and 2018 among all domestic fiction movies.
In summary, it shows domestic movies gradually caught up to foreign filmmakers in fiction film production. The next section will analyze the strategies domestic filmmakers used to catch up.
4.4. Learning from Foreign Firms
My analysis has established several facts comparing domestic and foreign fiction films: (1) Foreign movie quality is higher than domestic, based on consumer ratings. (2) This difference is most significant for fiction films, the most technical type requiring large visual teams. (3) Foreign studios produce more fiction films. (4) Though domestic fiction films are fewer than foreign ones, the number is increasing. It will be interesting to determine what drives this domestic growth trend. As a first step, differences in visual team composition are examined.
Figure 13 shows the number of foreign visual team members. For example, in 2013, foreign members reached a maximum of 60% of teams. However, In 2010, there were no foreign members. This suggests an intention to bring in more foreign talent to improve technology and produce more fiction films.
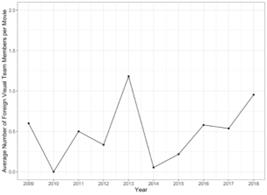
Figure 13: Average number of foreign visual team members per movie between 2009 and 2018.
Figure13 plots the number of visual team members who are not local residents (non-Chinese teams) between 2009 and 2018 among all domestic fiction movies.
Comparing figure 12 and 13 show that first that foreign visual members have consistently exceeded domestic ones. Second, from 2015-2018, local members decreased while foreign members increased.
Combining these patterns, domestic firms appear to produce more fiction films by hiring more foreign team members. This aligns with the "learning from others" channel widely discussed in literature.
5. Conclusion
This project provides insights into the channels behind industry upgrading. Detailed movie production data is used to understand the upgrading process in China's film industry over the past decade.
It finds that foreign filmmakers produce far more fiction movies than domestic ones. Fiction films require advanced technical skills and large visual effects teams. Analysis shows foreign movie visual teams are larger than domestic ones. It demonstrates that domestic films caught up by hiring foreign visual effects team members.
These results shed light on the mechanisms behind industry upgrading. Hiring foreign talent enabled domestic filmmakers to rapidly catch up to foreign technical expertise and boost domestic fiction film capabilities. This significantly upgraded China's movie industry overall.
In summary, my analysis illuminates how strategic hiring of foreign experts can facilitate domestic industry upgrading and technical knowledge transfer. The film industry data provides unique insights into these human resource channels for closing capability gaps between domestic and foreign producers.
References
[1]. Hobday, M. (1995). "East Asian latecomer firms: Learning the technology of electronics." World development 23(7): 1171-1193.
[2]. Hobday, M. (2003). "Innovation in Asian industrialization: A Gerschenkronian perspective." Oxford Development Studies 31(3): 293-314.
[3]. Kim, W., Shi, Y., & Gregory, M. (2004). Transition from imitation to innovation: lesions from a Korean multinational corporation. International Journal of Business. 9(4)
[4]. Lee, K. (2005). "Making a technological catch-up: Barriers and opportunities." Asian Journal of Technology Innovation 13(2): 97-131.
[5]. Pack, H. and K. Saggi (1997). "Inflows of foreign technology and indigenous technological development." Review of development economics 1(1): 81-98.
[6]. Saxenian, A. (2002). "Transnational communities and the evolution of global production networks: The cases of Taiwan, China and India." Industry and innovation 9(3): 183-202.
[7]. Liu, X., et al. (2010). "Returnee entrepreneurs and firm performance in Chinese high-technology industries." Journal of International Business Studies 41(4): 633-648.
[8]. Almeida, P. and B. Kogut (1999). "Localization of knowledge and the mobility of engineers in regional networks." Management science 45(7): 905-917.
[9]. Ernst, D. and L. Kim (2002). "Global production networks, knowledge diffusion, and local capability formation." Research policy 31(8-9): 1417-1429.
[10]. Fu, X., Pang, Y., & Zhu, C. (2013). "Indigenous and foreign innovation efforts and drivers of technological upgrading: Evidence from China". World Development, 46, 53-65.
[11]. McKenzie, J. (2012). "The economics of movies: A literature survey." Journal of Economic Surveys 26(1): 42-70.
[12]. Awate, S., Larsen, M. M., & Mudambi, R. (2015). "Accessing vs sourcing knowledge: A comparative study of R&D internationalization between emerging and advanced economy firms". Journal of International Business Studies, 46(1), 63-86.
Cite this article
Zhang,C. (2024). Learning from Competitors: Evidence from the Movie Industry. Lecture Notes in Education Psychology and Public Media,52,235-245.
Data availability
The datasets used and/or analyzed during the current study will be available from the authors upon reasonable request.
Disclaimer/Publisher's Note
The statements, opinions and data contained in all publications are solely those of the individual author(s) and contributor(s) and not of EWA Publishing and/or the editor(s). EWA Publishing and/or the editor(s) disclaim responsibility for any injury to people or property resulting from any ideas, methods, instructions or products referred to in the content.
About volume
Volume title: Proceedings of the 5th International Conference on Education Innovation and Philosophical Inquiries
© 2024 by the author(s). Licensee EWA Publishing, Oxford, UK. This article is an open access article distributed under the terms and
conditions of the Creative Commons Attribution (CC BY) license. Authors who
publish this series agree to the following terms:
1. Authors retain copyright and grant the series right of first publication with the work simultaneously licensed under a Creative Commons
Attribution License that allows others to share the work with an acknowledgment of the work's authorship and initial publication in this
series.
2. Authors are able to enter into separate, additional contractual arrangements for the non-exclusive distribution of the series's published
version of the work (e.g., post it to an institutional repository or publish it in a book), with an acknowledgment of its initial
publication in this series.
3. Authors are permitted and encouraged to post their work online (e.g., in institutional repositories or on their website) prior to and
during the submission process, as it can lead to productive exchanges, as well as earlier and greater citation of published work (See
Open access policy for details).
References
[1]. Hobday, M. (1995). "East Asian latecomer firms: Learning the technology of electronics." World development 23(7): 1171-1193.
[2]. Hobday, M. (2003). "Innovation in Asian industrialization: A Gerschenkronian perspective." Oxford Development Studies 31(3): 293-314.
[3]. Kim, W., Shi, Y., & Gregory, M. (2004). Transition from imitation to innovation: lesions from a Korean multinational corporation. International Journal of Business. 9(4)
[4]. Lee, K. (2005). "Making a technological catch-up: Barriers and opportunities." Asian Journal of Technology Innovation 13(2): 97-131.
[5]. Pack, H. and K. Saggi (1997). "Inflows of foreign technology and indigenous technological development." Review of development economics 1(1): 81-98.
[6]. Saxenian, A. (2002). "Transnational communities and the evolution of global production networks: The cases of Taiwan, China and India." Industry and innovation 9(3): 183-202.
[7]. Liu, X., et al. (2010). "Returnee entrepreneurs and firm performance in Chinese high-technology industries." Journal of International Business Studies 41(4): 633-648.
[8]. Almeida, P. and B. Kogut (1999). "Localization of knowledge and the mobility of engineers in regional networks." Management science 45(7): 905-917.
[9]. Ernst, D. and L. Kim (2002). "Global production networks, knowledge diffusion, and local capability formation." Research policy 31(8-9): 1417-1429.
[10]. Fu, X., Pang, Y., & Zhu, C. (2013). "Indigenous and foreign innovation efforts and drivers of technological upgrading: Evidence from China". World Development, 46, 53-65.
[11]. McKenzie, J. (2012). "The economics of movies: A literature survey." Journal of Economic Surveys 26(1): 42-70.
[12]. Awate, S., Larsen, M. M., & Mudambi, R. (2015). "Accessing vs sourcing knowledge: A comparative study of R&D internationalization between emerging and advanced economy firms". Journal of International Business Studies, 46(1), 63-86.