


1. Introduction
In today's era, trains have become an exceedingly convenient, affordable, and indispensable mode of transportation. However, the high speed of trains poses dangers on platforms. Therefore, to prevent accidents during train arrivals, the invention of safety markings has emerged as an effective tool.
When a train travels at high speed, it causes the nearby air to move rapidly. According to the Bernoulli Principle, when people are within a very small distance from the train on the platform, the train has a significant impact on the airflow speed, which can also generate vortex phenomena. This leads to a minimal change in the air pressure behind a person while significantly increasing the airflow speed in front of them, resulting in a sharp decrease in the air pressure in front. Consequently, a pressure difference is created in front and behind the person, providing a pushing force towards the train. The existence of this force increases the risk of people being pulled towards the train during its arrival. To prevent accidents from people getting too close to the train (especially when not holding onto something stable or not standing firmly), railway technical management regulations have explicitly defined the distances for safety markings to limit the effect of this pushing force. Therefore, passengers on the platform must stand outside the safety line area to ensure their personal safety.
The distance for the safety markings is determined based on the maximum possible speed of the train passing through. For high platforms, the distance of the safety markings from the edge of the platform is 1000mm. For non-high platforms, the distance between the safety markings and the platform edge varies depending on the speed of the passing train, with higher speeds requiring greater distances for safety markings.
2. Introduction to Bernoulli's Principle
Bernoulli's Principle is a fundamental principle in fluid dynamics, describing the conservation of energy relationship in ideal fluids (that is, fluids that are incompressible and without viscosity) during the flow process [1].
Bernoulli's Principle can be stated as follows: within a flowing fluid system, the greater the velocity, the lower the fluid pressure; conversely, the smaller the velocity, the higher the pressure. This phenomenon can be interpreted as a conversion between the fluid's kinetic energy and pressure energy. In a closed fluid system, the total energy of the fluid (including pressure energy, potential energy, and kinetic energy) is conserved.
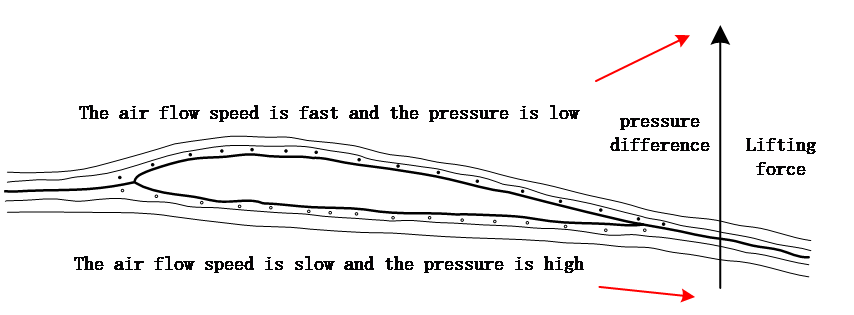
Figure 1. Explanation of Bernoulli's Principle
As shown in Figure 1, it can be seen that when air encounters an obstacle, the air speed in front of the obstacle is faster and the pressure is lower, whereas behind the obstacle, the air speed is slower and the pressure is higher. According to Bernoulli's Principle, there is an approximate inverse relationship between air speed and pressure. The change in air flow speed above and below generates a pressure difference acting on the same area, as shown in the diagram, which in turn provides a lift force to the obstacle [2], influencing the motion of the obstacle.
3. Establishment of the Thrust Model
3.1. Preliminary Analysis of the Forces Involved
|
|
(a) | (b) |
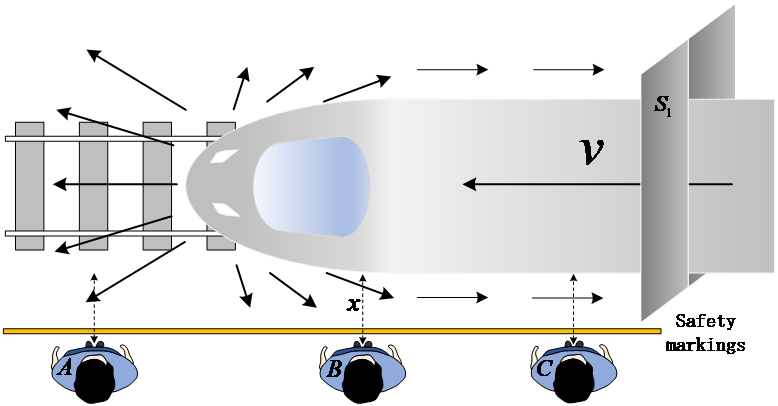
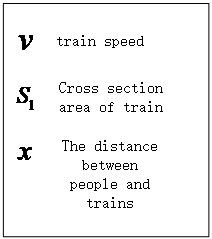
Figure 2. Force Analysis Diagram of Train Entering Station
As shown in Figure 2, diagram (a) demonstrates the impact of airflow on passengers when a train enters a station, thereby inferring the forces acting on the passengers. In this diagram, passenger A is positioned where the train head is about to pass, at which point passenger A is subjected to both the impact force of the airflow and the force due to pressure difference. The resultant force of these two forces acts to push passenger A away from the train. Passenger B is in the position just after the train head has passed, at this moment the air flow speed change is at its greatest, and passenger B is subjected to the dual effects of the airflow's impact force and the force due to pressure difference, pulling passenger B towards the train. Passenger C is in a position where there is no airflow movement, hence the pressure at passenger C's position remains almost unchanged, resulting in a force of 0. In diagram (b), the three marked influencing factors are “train speed \( v \) , train cross-sectional area \( {S_{1}} \) , and the distance between the passenger and the train \( x \) ”, These three factors are key to the thrust force [3].
During the train's entry into the station, the air in front of the train is compressed and forced through a narrow space, and vortex phenomena may occur. According to the principle of the continuity equation and Bernoulli's principle, the speed of the air will increase, thus reducing pressure. Since passengers in front of the train act as a barrier to the flow of air, this leads to a significant pressure difference in front of and behind them, generating a thrust force. This thrust force delivers waiting passengers towards the front of the train.
3.2. Determining the Linear Relationship of Thrust Influencing Factors
According to Bernoulli's principle, the following equation for the conservation of mechanical energy in fluids can be derived:
\( \frac{ρ{v^{2}}}{2}+ρgh+P=constant \)
Inserting the actual context of a train entering a station into this equation, the gas density \( ρ \) remains constant, and the height \( h \) also remains unchanged. Assuming the airspeed before the train enters the station is close to 0 (taken as 0 for calculation purposes), the following expression for the change in pressure can be obtained [4]:
\( ΔP=\frac{ρ}{2}(v{ \prime ^{2}}-{0^{2}}) \)
|
|
(a) | (b) |
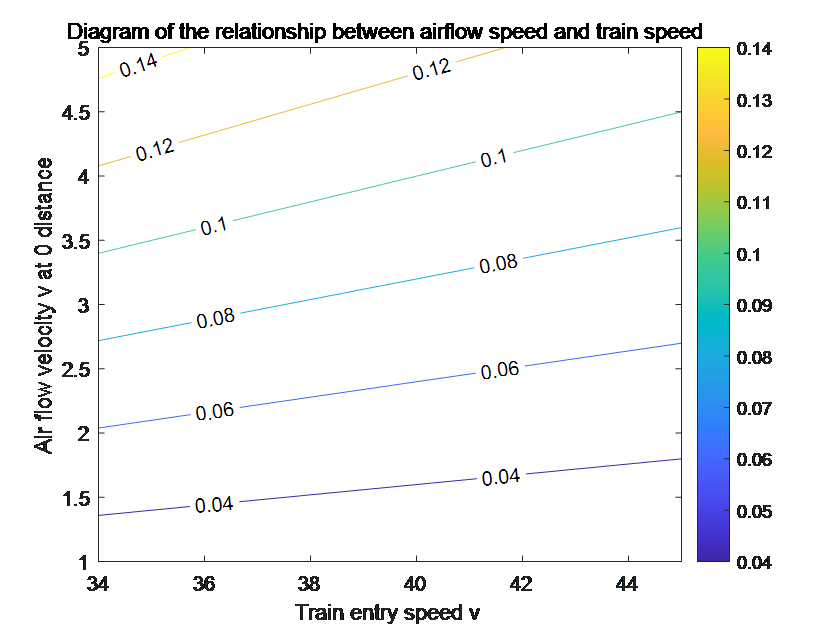
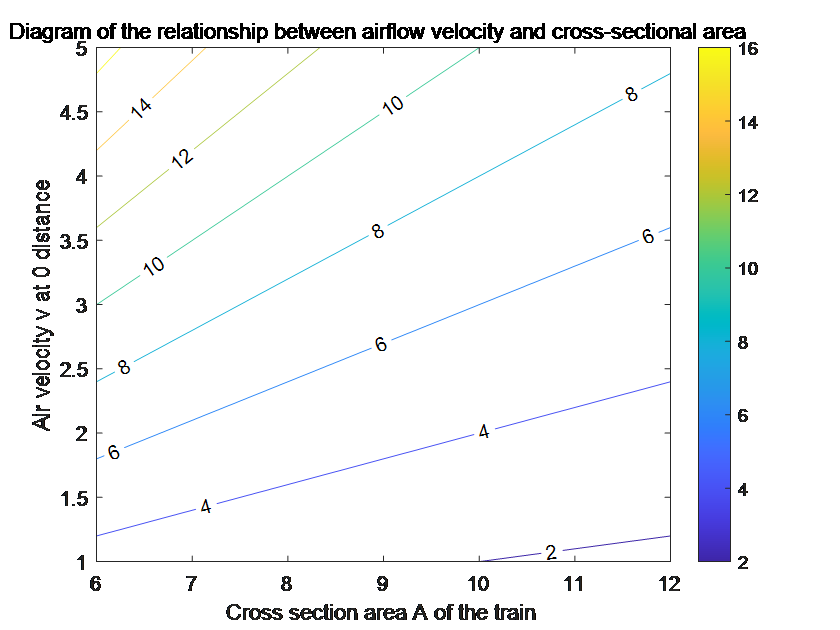
Figure 3. Comparison Chart of Linear Relationship between Airspeed and Train Cross-Sectional Area
As shown in Figure 3, diagrams (a) and (b) are linear relationship graphs between airflow speed and both train speed and train cross-sectional area, drawn based on consulted data controlling for influencing factor variables. From these two diagrams, it can be observed that the train's entering speed and cross-sectional area are both approximately directly proportional to the airspeed. Therefore, the following conjectural equation is proposed:
\( {v_{0}}={C_{1}}\cdot Av \)
In the above formula, \( {C_{1}} \) represents the correlation coefficient, i.e., a constant, and \( {v_{0}} \) represents the airspeed at a position of 0 distance from the train on the platform.
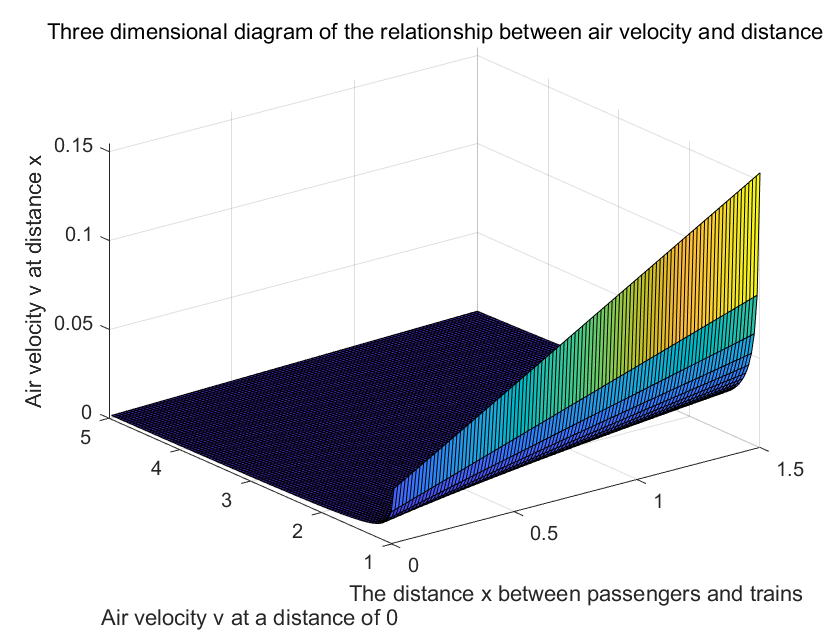
Figure 4. Three-Dimensional Graph of Airspeed and Distance Relationship
As shown in Figure 4, this graph is drawn based on interpolated fitting of consulted data, showing the relationship surface between airspeed at distances other than 0 from the train, airspeed at a distance of 0, and distance. Through functional fitting of distance and speed on this surface, the following relationship can be deduced:
\( v \prime ={C_{2}}\cdot {e^{lg{({x^{-1.5}})}}}\cdot A{v_{0}} \)
In the above formula, \( {C_{2}} \) also represents a correlation coefficient (i.e., a constant), and \( v \prime \) represents the airspeed at a position on the platform at a distance \( x \) from the train [5].
Based on the linear relationships between the influencing factors and airspeed obtained above, the following thrust equation can be summarized:
\( F=C_{1}^{2}\cdot C_{2}^{2}\cdot \frac{ρ}{2}\cdot {[{e^{lg{({x^{-1.5}})}}}\cdot Av]^{2}}\cdot S \)
Upon rearrangement, the following is obtained:
\( F=k\cdot \frac{ρ}{2}\cdot {[{e^{lg{({x^{-1.5}})}}}\cdot Av]^{2}}\cdot S \)
It is evident in the formula above, \( k \) represents a constant, with all other quantities being influencing factors. The measured data is substituted into this formula to determine the value of \( k \) .
\( \begin{cases} \begin{array}{c} F=k\cdot \frac{ρ}{2}\cdot {[{e^{lg{({x^{-1.5}})}}}\cdot Av]^{2}}\cdot S \\ k=7.8517×1{0^{-4}} \end{array} \end{cases} \)
In the derivation of thrust, since the thrust is generated by the difference in pressure before and behind, it does not directly affect a person's mass. The effect of mass comes into play in terms of static friction, which prevents people from being drawn towards the train. This balance of static friction is used to avoid such hazardous incidents and will be applied in the model established in Problem 2.
3.3. Model Accuracy Verification
To ensure the model formula is more accurately applicable, we have compiled the following table of train speeds and cross-sectional area statistics.
Table 1. Statistical Table of Factors Influencing Trains
Train model | Common operating speed | cross-section area |
Harmony | \( 350 Km/h \) | \( 8~10 {m^{2}} \) |
Fuxing | \( 350 Km/h \) | \( 8~10{ m^{2}} \) |
Korean HEMU-430X | \( 370 Km/h \) | \( 8~10 {m^{2}} \) |
German ICE | \( 320 Km/h \) | \( 8~10{ m^{2}} \) |
As shown in Table 1, the table presents the world-renowned high-speed train models along with their common operational speeds and estimated cross-sectional areas, indicating that many train cross-sectional areas are within \( 8~10 {m^{2}} \) . Consequently, in the thrust relationship equation below, we use \( 8 {m^{2}} \) for the train's cross-sectional area for calculations, and the area subjected to force on a person \( S \) is taken as the common value \( 0.64 {m^{2}} \) for adults.
|
|
(a) | (b) |
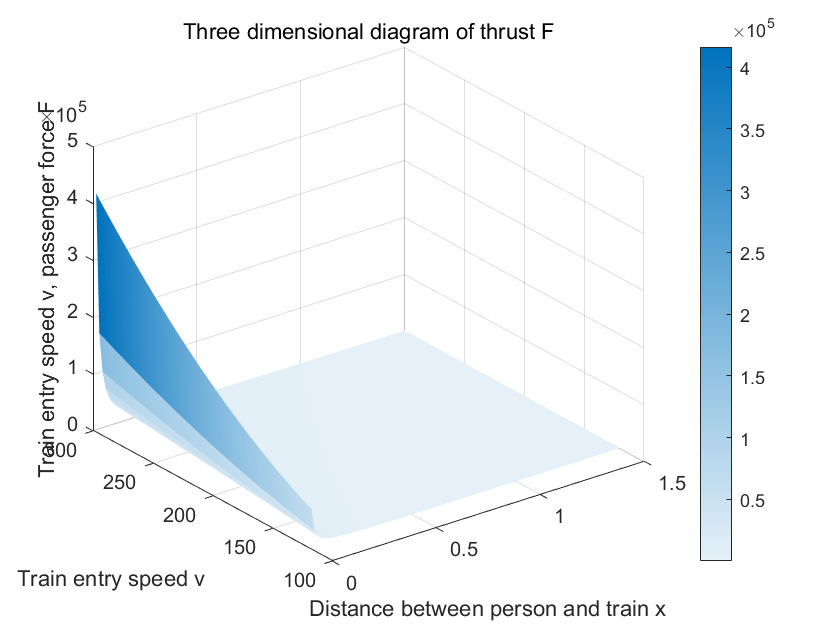
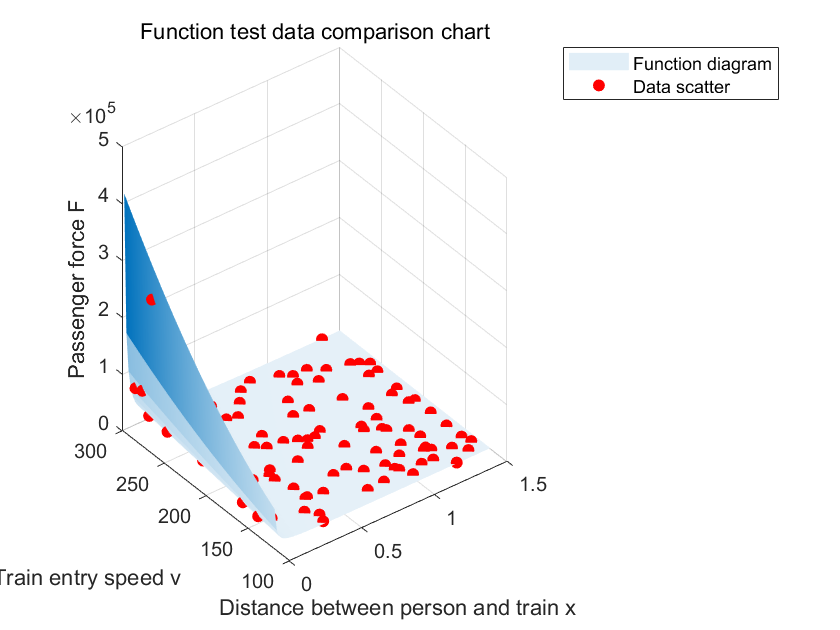
Figure 5. Thrust Relationship Display
As shown in Figure 5, diagram (a) presents the three-dimensional graph of the thrust relationship with its influencing factors derived in section 3.2, demonstrating the correlation between the thrust experienced by passengers and the main influencing factors of "the train's speed upon station entry and the distance between the passenger and the train." [6] Diagram (b) shows the collected data points of the three variables plotted as scatter points combined with the three-dimensional thrust graph for result comparison. The data points fall within a minimal error margin above and below the three-dimensional surface, indicating that the equation's accuracy is within an ideal range for assessing thrust.
4. Principles of Setting Safety Markings
|
|
(a) | (b) |
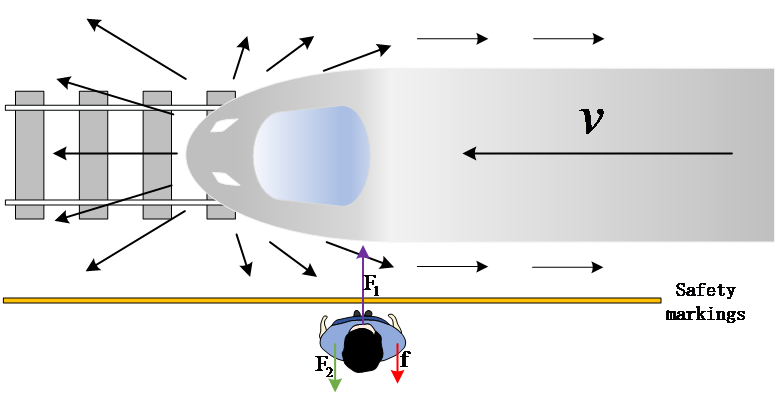
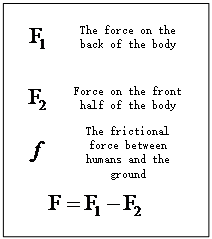
Figure 6. Analysis of the Resultant Force
As shown in Figure 6, diagram (a) analyzes the forces acting on passengers on the platform. In the absence of external forces, a passenger is subjected to three forces. Diagram (b) analyzes these three forces individually and provides a formula for generating thrust. It is observed that while the train speed and other factors change the air velocity to apply thrust on the passengers, the ground also applies friction to the passengers. The friction force can be calculated using the following formula:
\( f=μmg \)
Based on the thrust formula derived in question one, the magnitude of the thrust experienced by the passenger at their location can be determined, and the following analysis is made.
If \( F \gt f \) : at this time, the resultant force on the passenger is directed towards the train, and the resultant force is not zero, thus generating acceleration. According to Newton's second law, the following expression for the relationship between acceleration and mass can be obtained.
\( a=\frac{F-f}{m}=\frac{k\cdot \frac{ρ}{2}\cdot {[{e^{lg{({x^{-1.5}})}}}\cdot Av]^{2}}\cdot S}{m}-μg \)
The generation of acceleration causes the passenger to develop a velocity towards the direction of the train movement. Therefore, under this process, the distance \( x \) between the person and the train will gradually decrease, making the thrust \( F \) increasingly larger while the magnitude of the friction force remains unchanged. The direction of the passenger's velocity is always towards the train, and without the action of additional forces, the passenger cannot stop. In summary, in this situation, the passenger cannot avoid safety hazards.
If \( F≤f \) : at this time, because the initial thrust received by the passenger is less than the maximum static friction, the passenger will remain stationary. In this case, the passenger does not pose a safety hazard. Based on the thrust formula, the values of various influencing factors, and the calculation of friction force, the critical safety distance \( {x_{min}} \) can be determined [7]:
\( {x{[{(\frac{2μmg}{{A^{2}}\cdot S\cdot k\cdot ρ\cdot {v^{2}}})^{\frac{ln{1}0}{2}}}]^{(-\frac{2}{3})}}{(\frac{2μmg}{{A^{2}}\cdot S\cdot k\cdot ρ\cdot {v^{2}}})^{(-\frac{ln{1}0}{3})}}_{min}} \)
From the explanation of the two initial thrust magnitudes, it is derived that when the initial position of a person on the platform and the distance \( x \) from the train is greater than \( {x_{min}} \) , the occurrence of this safety hazard can be avoided, hence the establishment of safety markings.
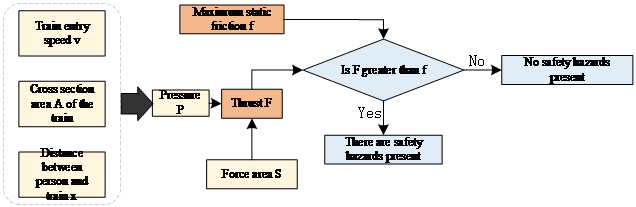
Figure 7. Platform Safety Hazard Analysis Diagram
As shown in Figure 7, this diagram displays the determinants of safety hazards on the platform \( F \) and \( f \) , the influencing factors \( P \) of thrust \( F \) and \( S \) , and the influencing factors \( v \) of pressure \( P \) , \( A \) , and \( x \) , showing the interrelationship among these three. Therefore, based on this diagram, safety hazards can be attributed to the factors \( v \) , \( A \) , \( x \) , \( S \) and \( f \) [8].
5. Safety Recommendations
5.1. Wind Speed Factors
Variation in wind speed: Wind speed varies with height, so it's necessary to set safety markings at different heights based on the platform's own height. At heights where wind speed is higher, more densely placed markings should be set as a warning.
Wind direction: The direction of the wind should be considered to ensure that the markings are not affected by lateral winds. Markings should be set relative to the main wind direction to provide extra protection.
5.2. Types and Speeds of Trains
Different types of trains (e.g., high-speed trains, conventional trains) have different structures, leading to variations in airflow and wind speed. Therefore, adjustments to marking settings need to be made according to different types of trains and their speeds. It's recommended that the front of the train be designed aerodynamically to reduce air resistance and the effects of wind-induced suction or thrust on people, which could also improve the train's operational efficiency to some extent.
5.3. Platform Structure
The architecture and structure of the platform can affect the flow of wind. Different stations should consider the impact of surrounding buildings on the platform to ensure that wind speed does not harm passengers.
Setting up wind protection facilities, such as windbreaks, can reduce wind speed on the platform, thereby increasing passenger safety.
It is recommended to use ground materials with a higher coefficient of friction, such as textured marble, etc.
5.4. Passenger Behavior
Pay timely attention to and understand the behaviors of passengers on the platform, such as standing at the edge of the platform, and promptly remind passengers to wait in the area within the safety markings.
Strengthen the management of passenger behavior, enhance the promotion and education of passengers, and raise their awareness of safety.
6. Conclusion
By establishing the relationship expression between the pressure experienced by individuals and train speed, train cross-sectional area, the distance between the individual and the train, and the area of the individual subjected to force. The coefficient of friction for a typical platform surface is 0.35, the average weight of an adult is \( 70 kg \) , and the acceleration due to gravity is \( 9.8 N/kg \) . Substituting into the friction force formula, we obtain: \( f=0.35×70×9.8=240.345 \) N Simplifying the friction force value to 240 N, the conclusions are as follows:
For high platforms: When the distance between the passenger and the train is \( 800 mm \) and the train's speed is \( 200 km/h \) , the thrust force received exceeds the maximum friction force of 240 N, posing a safety hazard. However, when the distance between the passenger and the train is \( 1000 mm \) , the force corresponding to the train speed \( 200 km/h \) is still less than 240 N, thus it is reasonable to set safety markings at \( 1000 mm \) .
For low platforms: When the train speed is less than \( 120 km/h \) , at a distance of \( 1000 mm \) , the thrust force received is less than 240 N. Therefore, setting safety markings at a distance of \( 1000 mm \) is reasonable. When the train speed is between \( 120 km/h \) and \( 160 km/h \) , at a distance of \( 1500 mm \) , the thrust force received is still less than 240 N, so setting markings at \( 1500 mm \) is reasonable. When the train speed is between \( 160 km/h \) and \( 200 km/h \) , at a distance of approximately \( 2000 mm \) , the force received is still less than 240 N, so setting markings at \( 2000 mm \) is reasonable.
References
[1]. Peng, L. M., Liu, C., Shi, C. H., et al. (2013). Analysis of wind characteristics on high-speed railway platforms and personnel safety. Journal of Zhengzhou University (Engineering Edition), 34(02), 99–102.
[2]. Duan, H. M. (1999). Why are safety lines drawn on train platforms? Science Enlightenment, (02), 28.
[3]. Du, Y. (2022). Activity design based on the 5E teaching model: A case study of the "Invisible Forces Beside Trains" educational activity at the China Railway Museum. Identification and Appreciation of Cultural Relics, (15), 82-85. DOI:10.20005/j.cnki.issn.1674-8697.2022.15.020.
[4]. Zhang, C. C. (2022). On the conservation of fluid energy and the application of pressure potential energy and Bernoulli's principle. China Equipment Engineering, (03), 157-158.
[5]. An, Y. (2017). Exploring the power of fluids – A brief discussion of the Bernoulli equation. Campus, (11), 121-122.
[6]. Zhang, Z. H. (2021). Development and research of simulation system for calculating the length of safety lines and the turnaround capacity of urban railways [D]. Beijing Jiaotong University. DOI:10.26944/d.cnki.gbfju.2020.001065.
[7]. Che, Z. X. (2023). Research on aerodynamic drag reduction of maglev trains based on active control of turbulent flow fields [D]. Wuyi University. DOI:10.27376/d.cnki.gwydu.2022.000054.
[8]. Zhang, C. C. (2022). On the conservation of fluid energy and the application of pressure potential energy and Bernoulli's principle. China Equipment Engineering, (03), 157-158.
Cite this article
Chen,Y.;Zhao,H.;He,M.;Pan,Y. (2024). Scientific calculation and application of safety marking principles. Theoretical and Natural Science,34,221-228.
Data availability
The datasets used and/or analyzed during the current study will be available from the authors upon reasonable request.
Disclaimer/Publisher's Note
The statements, opinions and data contained in all publications are solely those of the individual author(s) and contributor(s) and not of EWA Publishing and/or the editor(s). EWA Publishing and/or the editor(s) disclaim responsibility for any injury to people or property resulting from any ideas, methods, instructions or products referred to in the content.
About volume
Volume title: Proceedings of the 3rd International Conference on Computing Innovation and Applied Physics
© 2024 by the author(s). Licensee EWA Publishing, Oxford, UK. This article is an open access article distributed under the terms and
conditions of the Creative Commons Attribution (CC BY) license. Authors who
publish this series agree to the following terms:
1. Authors retain copyright and grant the series right of first publication with the work simultaneously licensed under a Creative Commons
Attribution License that allows others to share the work with an acknowledgment of the work's authorship and initial publication in this
series.
2. Authors are able to enter into separate, additional contractual arrangements for the non-exclusive distribution of the series's published
version of the work (e.g., post it to an institutional repository or publish it in a book), with an acknowledgment of its initial
publication in this series.
3. Authors are permitted and encouraged to post their work online (e.g., in institutional repositories or on their website) prior to and
during the submission process, as it can lead to productive exchanges, as well as earlier and greater citation of published work (See
Open access policy for details).
References
[1]. Peng, L. M., Liu, C., Shi, C. H., et al. (2013). Analysis of wind characteristics on high-speed railway platforms and personnel safety. Journal of Zhengzhou University (Engineering Edition), 34(02), 99–102.
[2]. Duan, H. M. (1999). Why are safety lines drawn on train platforms? Science Enlightenment, (02), 28.
[3]. Du, Y. (2022). Activity design based on the 5E teaching model: A case study of the "Invisible Forces Beside Trains" educational activity at the China Railway Museum. Identification and Appreciation of Cultural Relics, (15), 82-85. DOI:10.20005/j.cnki.issn.1674-8697.2022.15.020.
[4]. Zhang, C. C. (2022). On the conservation of fluid energy and the application of pressure potential energy and Bernoulli's principle. China Equipment Engineering, (03), 157-158.
[5]. An, Y. (2017). Exploring the power of fluids – A brief discussion of the Bernoulli equation. Campus, (11), 121-122.
[6]. Zhang, Z. H. (2021). Development and research of simulation system for calculating the length of safety lines and the turnaround capacity of urban railways [D]. Beijing Jiaotong University. DOI:10.26944/d.cnki.gbfju.2020.001065.
[7]. Che, Z. X. (2023). Research on aerodynamic drag reduction of maglev trains based on active control of turbulent flow fields [D]. Wuyi University. DOI:10.27376/d.cnki.gwydu.2022.000054.
[8]. Zhang, C. C. (2022). On the conservation of fluid energy and the application of pressure potential energy and Bernoulli's principle. China Equipment Engineering, (03), 157-158.