


1. Introduction
As an important part of public life, cars are closely related to people’s lives. It offers individuals a more convenient lifestyle and brings social advantages like status and prestige [1]. The price of buying a new car has made it prohibitive for many people, so the used car market came into being. As an important part of the modern economic system, the used car market plays a key role in connecting the automobile market and consumer demand. It provides consumers with a more economically viable option and provides a platform for vehicle recycling. The sales of second-hand cars are also very impressive. In the U.S. auto market in 2009, the sales of second-hand cars were two to three times that of new cars [2]. However, second-hand car market prices are affected by multiple factors, and their volatility and uncertainty bring risks to buyers and sellers. Understanding and predicting used car price trends has become a major challenge for market participants.
The first influencing factor is vehicle condition, such as vehicle brand, model, age, mileage, vehicle condition, past accident records, etc. The most important among them is the mileage of the vehicle [3]. The research data of Florian et al. showed that as the age of the car increases, the price gradually decreases. As the mileage of the car increases, the price gradually decreases, and the decrease is particularly obvious in the first thirty thousand miles [4]. The classification of the car will also have an impact on the price [5]. Regarding the color of the car, buyers usually choose white and black, colors that are easily accepted by everyone, to facilitate later resale [6]. The brand of a car is also something that consumers will pay attention to. In the research of Liu et al., it can be found through data that people like Mercedes-Benz, BMW, and Audi the most [6]. The season will also have an impact on the price of second-hand cars. In the summer when most tourists travel, the demand for second-hand cars increases, leading to an increase in prices [7]. Due to the cold weather in autumn and winter, as well as the launch of new models, the demand for second-hand cars has dropped, and thus prices have dropped [7]. These various factors have caused uncertainty in the price of second-hand cars, making it difficult to set prices reasonably and affecting sales efficiency. It can also result in consumers paying too high a price or purchasing a vehicle of poor quality. Therefore, in-depth research on the factors affecting second-hand car prices and building an accurate price prediction model is of great significance in improving the transparency and efficiency of the second-hand car market.
Although the existing literature has discussed the influencing factors of second-hand car prices to a certain extent, for example, Wu, Chen, and others tried to use the Adaptive Neuro-Fuzzy Inference System (ANFIS) for price prediction in 2009 [8]. Yusuke and Hideo used the k-nearest neighbor (k-NN) regression method in 2011 to improve prediction accuracy [9]. In 2016, Hughes, and others tried to use multiple linear regression to predict car prices [10]. However, given the rapid changes in the market and the development of data analysis technology, existing research still has limitations. This study aims to deeply explore and analyze the main factors affecting second-hand car prices through the comprehensive application of statistical methods and data analysis techniques. This paper will collect and analyze large amounts of used car data, including vehicle detailed specifications, prices, etc., to build an analysis framework. Through the processing and analysis of these data, people can reveal how these factors act individually and jointly on second-hand car prices and build a second-hand car price model to provide buyers and sellers with accurate price prediction tools.
This study has the following main goals: First, systematically summarize and analyze the main influencing factors of current second-hand car market price fluctuations and provide a comprehensive framework of influencing factors. Second, build and verify a second-hand car price model based on empirical data to improve price accuracy. Finally, based on the research findings, practical suggestions are put forward for participants in the second-hand car market to promote the healthy development of the second-hand car market.
2. Methodology
2.1. Data source
The data used in this study comes from Kaggle’s used car price prediction dataset. The dataset includes 4,009 data points collected from the automotive marketplace website https://www.cars.com and spans from 1974 to 2024. It contains 12 variables (brand, model, model year, mileage, fuel type, engine type, transmission, exterior & interior color, accident history, clean title, and price). This study will select 945 data points and five variables as research samples. The initial data set is saved in .csv format.
2.2. Variable selection
Due to the large amount of original data and variables, missing values exist. Null values in “accident” and “clean_title”. First, remove missing values from the data. There are many variables, and this study examined how mileage, year of manufacture, and exterior color affect price. Remove unneeded variables. Only 2019–2024 data is retained because this study focuses on current data. To avoid pricing impact, only “accident” data with “None reported” and “clean_titile” data with “Yes” are kept. These two variables are removed for simpler observation. Convert mileage from text to numeric and delete “mi.” Remove the “$” and commas from the price string to convert it to a number. For external colors, develop “Standard Colors” to classify them. Mark “1” for black, white, gray, and silver and “0” for other hues. Based on market perceptions, brands are classified as economy, mid-range, and luxury. After these steps, 945 data points, four variables (model year, mileage, standard colors, brand category), and one dependent variable (price) were obtained. Table 1 shows specific data.
Table 1. List of variables.
Variable | Logogram | Meaning |
Model year Mileage Standard colors Brand Category Price | \( {x_{1}} \) \( {x_{2}} \) \( {x_{3}} \) \( {x_{4}} \) \( Y \) | The year the car was manufactured The mileage of this car Black, white, grey, silver (1), others (0) Luxury (1), Economy (2), Mid-range (3) The price of the car |
2.3. Method introduction
In this study, the method used is multiple linear regression. Multiple linear regression is a linear regression model used to analyze the linear relationship between a dependent variable (response variable) and two or more independent variables (explanatory variables, predictor variables).
The reason for choosing to use multiple linear regression is because the price of a used car is affected by multiple factors, such as year of manufacture, mileage, brand, etc. Multiple linear regression can be used to simultaneously consider the impact of these variables on prices. At the same time, the impact of individual variables on price can also be studied to better understand which factors have a greater impact on price. The multiple linear regression model is relatively simple in form, so it is easy to interpret and allows readers to better understand the model results.
3. Results and discussion
3.1. Preliminary study
In a preliminary analysis, the relationship between these variables and used car prices was examined. First, the author can observe their relationship to price. This stage uses a scatter plot and adds a fitted line. Scatter plots can visually display the location of each data point and present the distribution of data points for easy observation. At the same time, you can also find the relationship between variables. By adding fitting lines, you can roughly understand the impact of variables on price. Scatter plots are shown below.
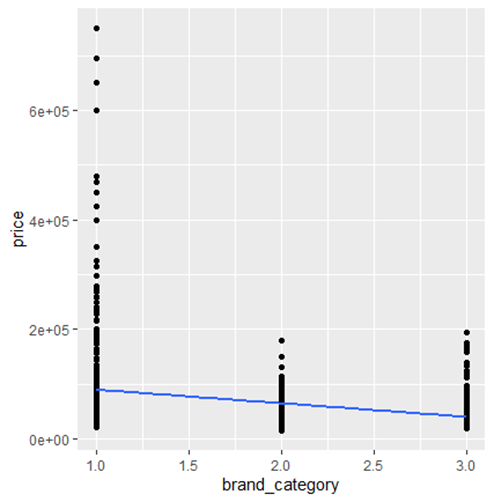
Figure 1. Scatter plot of brands and price.
Figure 1 shows the impact of different brands on price. It can be observed that the prices of vehicles of luxury brands are generally higher, while the prices of vehicles of economic brands are lower. This shows the impact of brand category on used car prices. As the brand gets better, the price will also increase.
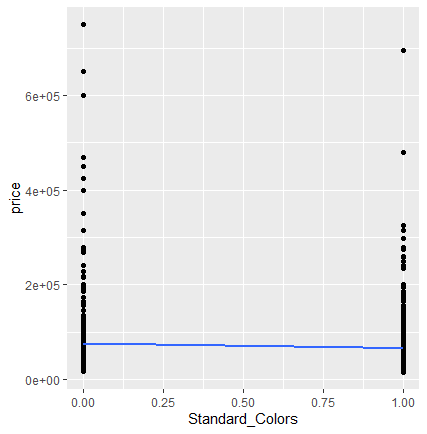
Figure 2. Scatter plot of colors and price.
Figure 2 shows that color has no significant effect on price because the slope of the fitted line is very small. But compared to the usual prices (black, white, gray, silver), cars in other colors have higher prices.
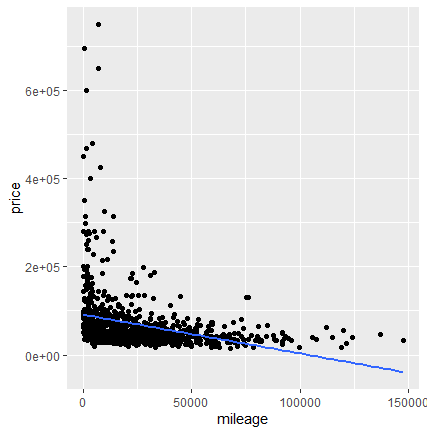
Figure 3. Scatter plot of mileage and price.
Figure 3 represents the relationship between mileage and price. From the scatter plot, the author can see that most of the data points are distributed between 0-50,000 miles, reflecting the higher demand for low-mileage vehicles in the market. It can be seen from the fitting line that as the mileage increases, the price gradually decreases. It means there is a negative relationship between mileage and price.
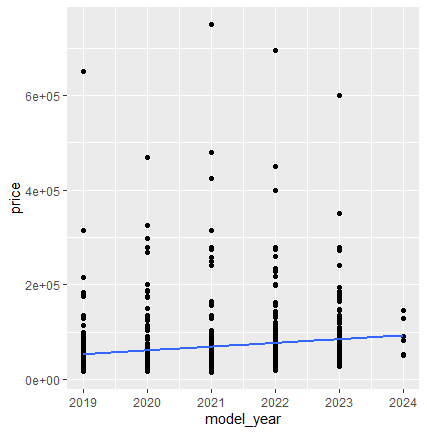
Figure 4. Scatter plot of model year and price.
Figure 4 represents the relationship between the production year and the price of the car. The price is lower in 2019, and the price of second-hand cars in 2024 is the highest. It shows that as the vehicle’s service life increases, the price gradually decreases.
3.2. Multiple linear regression
Furthermore, a multiple linear regression model was used to analyze the impact of these variables on prices. Multiple linear regression analysis can reveal the impact of a single variable on price while controlling for other variables. The formula of the multiple linear regression model is as follows:
\( Y={β_{0}}+{β_{1}}×{x_{1}}+{β_{2}}×{x_{2}}+{β_{3}}×{x_{3}}+{β_{4}}×{x_{4}}+ϵ \) (1)
In this formula, \( {β_{0}} \) represents the value of \( Y \) when all independent variables are zero. \( {β_{1}} \) to \( {β_{4}} \) represents the regression coefficient of the corresponding independent variable, that is, the impact on \( Y \) when \( x \) increases by one unit. \( ϵ \) represents the error term.
Table 2. Regression Analysis Coefficient.
Estimate | Std. Error | t-value | Pr( \( \gt |t| \) ) | |
(Intercept) \( {x_{1}} \) \( {x_{2}} \) \( {x_{3}} \) \( {x_{4}} \) | 81312.66 -3173.76 -0.261 2550.576 -5399.42 | 2786.817 607.135 0.036 1408.927 887.653 | 29.177 -5.227 -7.164 1.810 -6.082 | 3.20E-130 2.16E-07 1.70E-12 0.070 1.78E-09 |
Table 2 shows the coefficient estimation results of the multiple linear regression model of used car prices. The model includes mileage, vehicle manufacturing year, brand, and color as explanatory variables. The estimated coefficient of each variable represents the price change corresponding to a one-unit change in the variable while controlling other variables unchanged. The coefficient of x_1 is -3174, which reflects the tendency of vehicle value to depreciate over time, that is, as the age of the vehicle increases, its price decreases accordingly. The coefficient of x_2 is -0.2612, which reflects the negative impact of a vehicle’s use on its value, that is, the more miles a vehicle travels, the lower its price. The coefficient of x_4 is -5399, which represents the decrease in brand level at each level. The selling price is expected to drop by 5399 units. In this study, 1 represents luxury vehicles, 2 represents mid-range vehicles, and 3 represents economical vehicles. That is, the lower the brand level, the lower the price. The coefficient of x_3 is2551. In the classification, commonly used colors are divided into 1 and others are 0. This shows that vehicles in commonly used colors are more expensive than vehicles in other colors. However, since the p-value for this variable is 0.0706, which exceeds the commonly used 0.05 level, the evidence indicating this color preference is not very strong.
3.3. Exploratory data analysis
To better understand the market, as well as market supply and demand. Further exploratory data analysis was conducted on key variables.
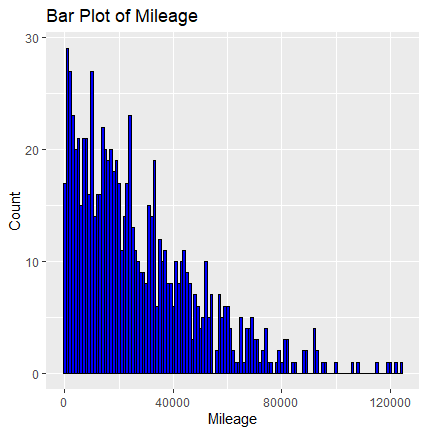
Figure 5. Bar plot of mileage.
The mileage histogram shown in Figure 5 reveals a right-skewed distribution, which indicates that most used cars on the market have low mileage and only a few vehicles have very high mileage.
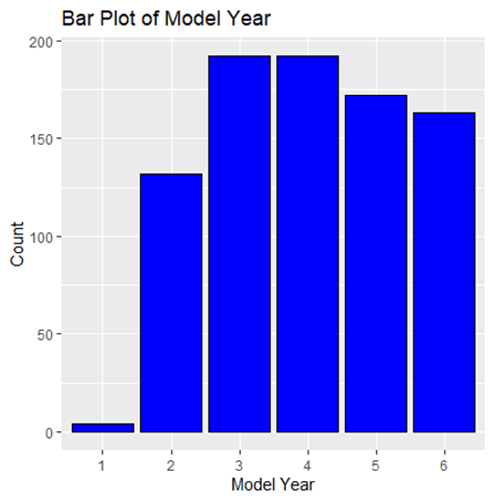
Figure 6. Bar plot of model year.
Figure 6 shows that there are very few new second-hand cars of that year, indicating that vehicles of the latest years have not yet entered the second-hand market in large numbers. Newer vehicles are relatively scarce on the market, so they have a higher purchase value.
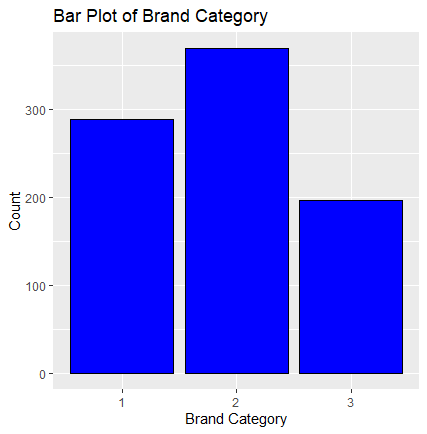
Figure 7. Bar plot of brand.
The brand category bar chart shown in Figure 7 shows that there are more vehicles of mid-range brands, indicating that mid-range vehicles are more popular in the used car market. This observation can provide guidance for car dealers in inventory selection and pay more attention to the market demand for mid-range brand vehicles.
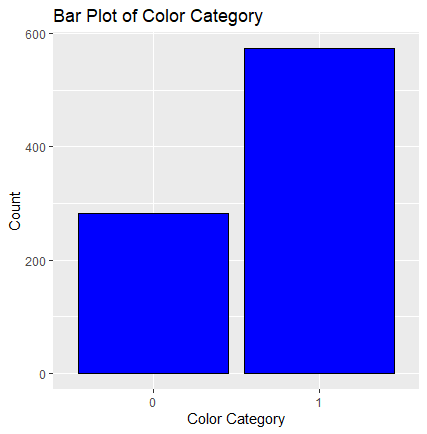
Figure 8. Bar plot of color.
The color category bar chart in Figure 8 shows that the number of vehicles on the market in the commonly used color (1) far exceeds that of other colors. Although this does not represent sales volume, it can illustrate that there is a higher preference for commonly used colors in the market.
4. Conclusion
This study examines four key factors that influence used car prices through a multiple linear regression model. The study found that mileage and model year were significantly related to the price of a used car. The increase in mileage will lead to a decrease in the price of a used car, and as the age of the used car increases, the price will decrease. In terms of brand categories, as the brand level increases, the price will also increase. The direct effect of color category price is not statistically significant. These findings could help consumers make more informed choices.
The supply trends in the market are then studied through exploratory data analysis. Among them, commonly used colors in the color category and mid-range brands in the brand category account for most of the market. This finding provides insights into supply chain management, pricing strategies, and consumer behavior in the used car market.
Although this study provides an analysis of the factors influencing prices in the used car market, there are still limitations and room for improvement. Such as the limited explanatory power of the model and the influence of other variables that were not explored in this study. To improve this, different models can be tried to analyze in the future, as well as search for more comprehensive data on influencing factors.
References
[1]. Wu J L 2022 Research on the Standardized Development of China’s Automobile Financing Leasing Industry. Financial Management Research, 7, 149-152.
[2]. Zhang H and Zheng A 2012 Current situation analysis and development countermeasures of China’s second-hand car market. Auto Industry Research, 7, 4.
[3]. Balce A 2016 Factors Affecting Prices in an Used Car E-Market. Journal of Internet Applications and Management, 7, 5-20.
[4]. Schmöller A and Stowasser T 2013 Price Discontinuities in an Online Used Car Market. Market Theory and Applications.
[5]. Oprea C 2011 Making the Decision on Buying Second-hand Car Market Using Data Mining Techniques. The Annals of the “Stefan cel Mare” University of Suceava Fascicle of The Faculty of Economics and Public Administration, 10, 17-26.
[6]. Liu Y and Song S 2023 Analysis of Multiple Factors Influencing the Second-hand Car Pricing in China. Journal of Education Humanities and Social Sciences, 16, 29-37.
[7]. He P F 2023 Analysis of the Development and Existing Problems of the Second hand Car Market. Internal Combustion Engine and Accessories, 9, 112-114.
[8]. Wu J, Hsu C and Chen H 2009 An expert system of price forecasting for used cars using adaptive neuro-fuzzy inference. Expert Systems with Applications, 36, 7809-7817.
[9]. Soejima Y and Hirose H 2011 Auction Price Estimation for Used Cars by Regression Methods. Proceedings of the symposium of the Computer Statistics Society of Japan, 9-12.
[10]. Ozgur C, Hughes Z, Rogers G and Parveen S 2016 Multiple Linear Regression Applications in Automobile Pricing. International Journal of Mathematics and Statistics Invention, 1-10.
Cite this article
Sun,Z. (2024). Research on factors affecting second-hand car market prices. Theoretical and Natural Science,36,128-135.
Data availability
The datasets used and/or analyzed during the current study will be available from the authors upon reasonable request.
Disclaimer/Publisher's Note
The statements, opinions and data contained in all publications are solely those of the individual author(s) and contributor(s) and not of EWA Publishing and/or the editor(s). EWA Publishing and/or the editor(s) disclaim responsibility for any injury to people or property resulting from any ideas, methods, instructions or products referred to in the content.
About volume
Volume title: Proceedings of the 2nd International Conference on Mathematical Physics and Computational Simulation
© 2024 by the author(s). Licensee EWA Publishing, Oxford, UK. This article is an open access article distributed under the terms and
conditions of the Creative Commons Attribution (CC BY) license. Authors who
publish this series agree to the following terms:
1. Authors retain copyright and grant the series right of first publication with the work simultaneously licensed under a Creative Commons
Attribution License that allows others to share the work with an acknowledgment of the work's authorship and initial publication in this
series.
2. Authors are able to enter into separate, additional contractual arrangements for the non-exclusive distribution of the series's published
version of the work (e.g., post it to an institutional repository or publish it in a book), with an acknowledgment of its initial
publication in this series.
3. Authors are permitted and encouraged to post their work online (e.g., in institutional repositories or on their website) prior to and
during the submission process, as it can lead to productive exchanges, as well as earlier and greater citation of published work (See
Open access policy for details).
References
[1]. Wu J L 2022 Research on the Standardized Development of China’s Automobile Financing Leasing Industry. Financial Management Research, 7, 149-152.
[2]. Zhang H and Zheng A 2012 Current situation analysis and development countermeasures of China’s second-hand car market. Auto Industry Research, 7, 4.
[3]. Balce A 2016 Factors Affecting Prices in an Used Car E-Market. Journal of Internet Applications and Management, 7, 5-20.
[4]. Schmöller A and Stowasser T 2013 Price Discontinuities in an Online Used Car Market. Market Theory and Applications.
[5]. Oprea C 2011 Making the Decision on Buying Second-hand Car Market Using Data Mining Techniques. The Annals of the “Stefan cel Mare” University of Suceava Fascicle of The Faculty of Economics and Public Administration, 10, 17-26.
[6]. Liu Y and Song S 2023 Analysis of Multiple Factors Influencing the Second-hand Car Pricing in China. Journal of Education Humanities and Social Sciences, 16, 29-37.
[7]. He P F 2023 Analysis of the Development and Existing Problems of the Second hand Car Market. Internal Combustion Engine and Accessories, 9, 112-114.
[8]. Wu J, Hsu C and Chen H 2009 An expert system of price forecasting for used cars using adaptive neuro-fuzzy inference. Expert Systems with Applications, 36, 7809-7817.
[9]. Soejima Y and Hirose H 2011 Auction Price Estimation for Used Cars by Regression Methods. Proceedings of the symposium of the Computer Statistics Society of Japan, 9-12.
[10]. Ozgur C, Hughes Z, Rogers G and Parveen S 2016 Multiple Linear Regression Applications in Automobile Pricing. International Journal of Mathematics and Statistics Invention, 1-10.