


1. Introduction
Temperature fluctuations greatly affect energy consumption in large cities, such as Ireland. The main climate characteristic there is relatively mild but erratic weather patterns. There are no significant seasonal differences in the maritime climate of Irish cities; It results in mild winters and cool summers. A lot of heating is needed in winter; During rare heat waves, there is less need for refrigeration, even if a cool summer suggests otherwise. Even mild weather has secrets. Deciphering them is difficult, but vital; It's a ball game to see how Ireland's daily energy use fluctuates with temperature changes. Understanding forms the core of the planning strategy - strategies to improve energy efficiency, reduce costs, and reduce harmful environmental impacts. This research needs to take an in-depth look at monthly temperature variations in Ireland and their relationship to energy consumption patterns. Perhaps the understanding gained from the results will bring handy utility to energy policymakers and utility company responders in developing or refining energy management blueprints or stimulating green energy advocacy. It can indeed be profound.
Numerous studies have examined the relationship between climate change and energy consumption in various urban settings. Su et al. modelled the impacts of climate change on monthly commercial sector electricity consumption, highlighting the sensitivity of energy demand to temperature fluctuations [1]. Similarly, another study explored the crowding-out effect of income growth on residential electricity consumption due to temperature changes in China, emphasizing the significant role of economic factors [2].
In Beijing, future hotter summers are expected to greatly increase residential electricity consumption, as demonstrated by studies based on different house layouts and socioeconomic pathways [3]. The increased summer electric power demand in Beijing driven by preceding spring tropical North Atlantic warming also underscores the intricate link between global climatic patterns and local energy needs [4]. Studies on Shanghai’s electricity consumption provide comparative insights, showing that urban temperature significantly influences energy demand, particularly during peak heating and cooling periods [5].
Research by Hou et al. indicated that in Shanghai, both heating and cooling degree days are critical indicators of energy consumption, which could be similarly significant for Beijing [5]. Additionally, system dynamics modelling for urban energy consumption and CO2 emissions in Beijing reveals that changes in energy structure, from carbon-rich fuels to low-carbon alternatives, play an essential role in reducing emissions while meeting energy demands [6].
The impact of climate change on urban resilience, particularly in the Beijing-Tianjin-Hebei region, further highlights the importance of adaptive energy policies [7]. The dynamic interplay between urban heat islands and high-resolution temperature measurements in Beijing provides a granular understanding of local temperature variations and their impact on energy use [8]. Furthermore, the influence of urban temperature on electricity consumption in Beijing is consistent with findings from other megacities, suggesting that targeted energy policies could mitigate the adverse effects of temperature extremes [9].
Finally, predictive studies on the response of heating and cooling demands of residential buildings to climate change across various thermal performances in China provide a broad context for understanding potential future scenarios [10]. These insights are crucial for formulating robust energy strategies that align with both local and global environmental goals.
Based on these findings, this study aimed to analyse the impact of daily temperature changes on energy consumption in Ireland. By collecting accurate climate data and utilizing advanced statistical methods, the study aims to provide a comprehensive view of how temperature fluctuations affect energy demand in Ireland's urban areas. Given the country's temperate climate, the study will explore the nuances of energy use, especially during colder months when heating demand is highest. The findings will provide practical recommendations for energy policy and urban planning, with a focus on improving energy efficiency and promoting sustainability in Ireland's unique climate context.
2. Methodology
2.1. Data sources and description
The data used in this study mainly includes two parts: Climate data and Total energy consumption data. The climate data comes from the International NOAA Meteorological Database, which provides daily meteorological data of Dublin, the capital of Ireland from 01/2014 to 06/2024, including average temperature, wind speed, visibility, and rain. Energy consumption monthly data of Ireland are obtained from the Sustainable Energy Authority of Ireland (SEAI). It includes the amount of electricity generated from several resources such as Coal, Combust Renew, Hydro, Natural Gas, Oil, Solar Farms, etc.
2.2. Indicator selection and description
Since the data on climate is a daily one, this paper calculated the average monthly temperature and wind speed and clustered these new numbers into a new monthly dataset to match the same structure and timeline for the Energy consumption monthly data. Finally, this paper combined the Total energy consumption and climate data as one Excel file (Table 1).
Table 1. Data Collection Form
Temperature (℃) | Wind Speed (km/h) | Energy Consumption (GWh) |
12.3 | 12.7 | 2182 |
15.6 | 15.9 | 1994 |
2.3. Method introduction
In this article, the massive original data was been transformed into a simplified form. The author cleared some outliers and losses. The author analysed the relationship of different variables by R studio. The correlation among these variables is explained by several linear regression models. This paper proved that the non-linear relationship does not exist. Creating Seasonal plots is an essential method to visualize the relationship. The author showed Scatter plots, histograms, residual plots, etc.
3. Results and discussion
3.1. Simple analysis
The author created some simple graphs based on the original data at the beginning. Figure 1 shows the relationship between the Frequency and the energy consumption. This histogram represents an approximately Standard Normal distribution. This discovery leads the research to use a linear regression model to fit the data.
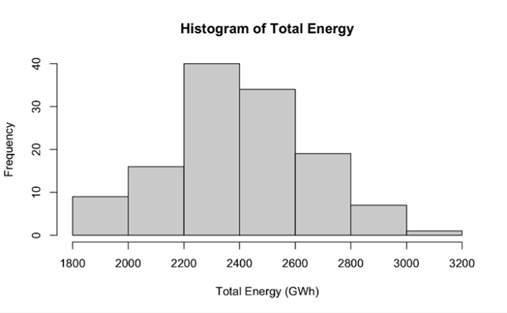
Figure 1. Histogram of Total Energy Consumption.
Figure 2 is a Scatter plot that shows a strong linear interpolation between temperature and total energy consumption. The blue line in the graph is the fitted line of two variables. There are some outliers in this graph. The author removed these outliers to further improve the research accuracy.
|
Figure 2. Scatter plot of Energy VS Temperature |
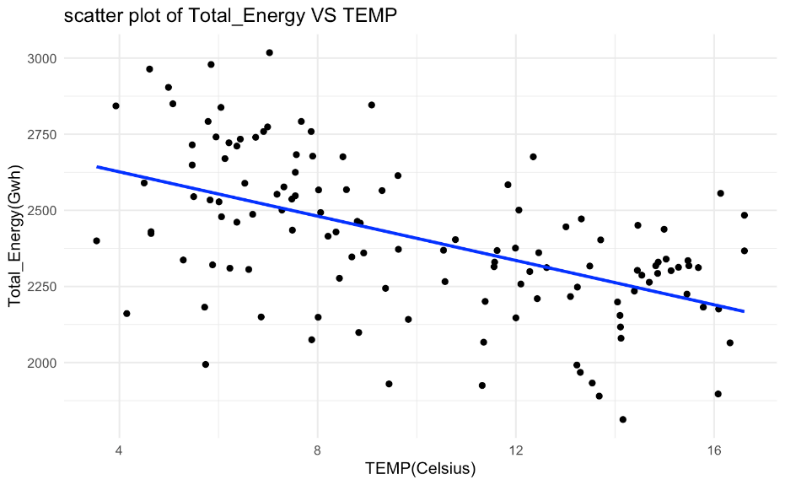
The analysis reveals a negative correlation between temperature and total energy consumption. As the temperature increases, total energy consumption (measured in GWh) shows a downward trend. This indicates that at lower temperatures, energy consumption is higher. Conversely, at higher temperatures, energy consumption is lower. Although the data points in the scatter plot are widely dispersed, most are concentrated between 4°C and 12°C. Energy consumption mainly ranges between 2250 and 2750 GWh. Despite the general negative correlation trend, there are some outliers. For instance, at higher temperatures (around 16°C), there are still some higher energy consumption data points that deviate from the overall downward trend.
This negative correlation may be related to the impact of climate on energy demand. During colder months, more energy may be used for heating. This leads to higher total energy consumption. Conversely, at higher temperatures, heating demand decreases, resulting in lower energy consumption. However, this is only a hypothesis. The specific reasons may require further analysis with additional background data and information (table 2).
Table 2. R output from the simple linear model
Temperature | P-value | |
Coefficient | -36.39 | 1.173e-10 |
Subsequently, a simple linear model was constructed as the correlation between Total Energy Consumption and Temperature. The coefficient for temperature is -36.39. This indicates that total energy consumption decreases by 36.39 units for each unit increase in temperature. With a p-value of less than 0.05, there is a strong linear relationship between Total Energy and TEMP. However, this model is not highly accurate. Additional variables are needed to improve the model’s precision.
3.2. Multiple linear regression modelling
From part 3.1, the author figured that more variables should be considered in the model. In this part, the author adds wind speed, precipitation, and visibility into the linear regression model.
Table 3. A slightly more complex table with more variables.
Sum square | Mean square | F value | P value | |
Temperature | 2296596 | 2296596 | 51.9 | 5e-11 |
Visibility | 3658 | 3658 | 0.0827 | 0.774 |
Wind | 268724 | 268724 | 6.0767 | 0.015 |
Rain | 126444 | 126444 | 2.8593 | 0.09 |
After adding more variables, a new regression model was developed (Table 3). The intercept is 3,146.83, indicating total energy consumption when all variables are zero. The coefficient for temperature is -46.59 with a p-value of 1.07e-11. This shows that each 1°C increase in temperature reduces energy consumption by about 46.59 GWh.
Visibility has a coefficient of 3.37 with a p-value of 0.6108, indicating no significant effect. Wind speed has a coefficient of -30.56 with a p-value of 0.0143, indicating that higher wind speed reduces energy consumption.
Precipitation has a coefficient of 5.17 with a p-value of 0.0934, suggesting a potential but not confirmed effect. The model’s R² is 0.335, explaining 33.5% of the variation in energy consumption. The adjusted R² is 0.313, indicating a slight reduction after accounting for complexity. The F-statistic of 15.24 with a p-value of 4.063e-10 confirms the model’s overall significance.
This model shows that temperature and wind speed significantly impact energy consumption, while visibility and precipitation have minimal effects. However, the model’s explanatory power is limited, indicating that other factors might need to be considered.
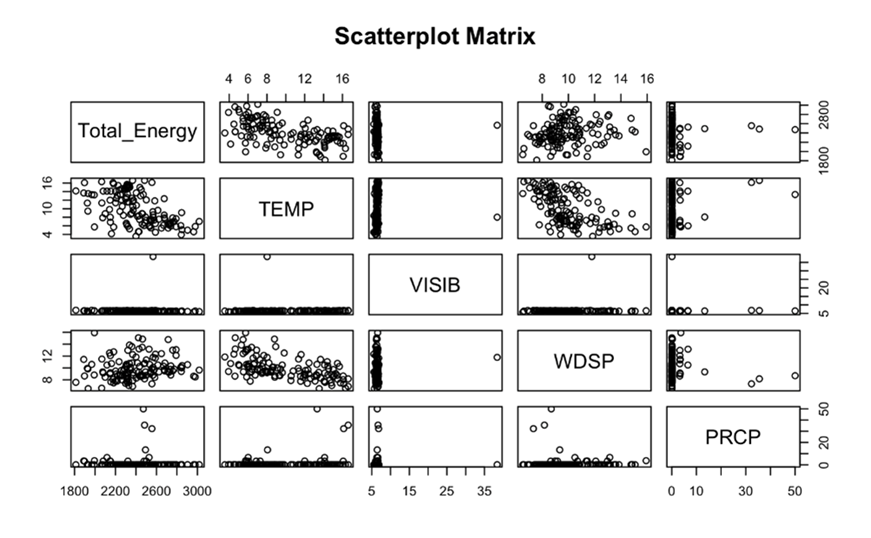
Figure 3. Scatter Plot Matrix.
The scatter plot matrix Figure 3 shows the relationships among total energy consumption, temperature, visibility, wind speed, and precipitation. The subgraph between total energy consumption and temperature shows a negative correlation with energy consumption decreasing as temperature increases.
The relationship between energy consumption and visibility is weak with no clear trend. Wind speed shows a negative correlation with energy consumption decreasing as wind speed increases. The relationship between energy consumption and precipitation is complex with no obvious trend. There are no strong correlations between the variables. Since no strong correlation between precipitation or visibility, the author removed these two variables from the model.
| |
Figure 4. Diagnostic plots. | |
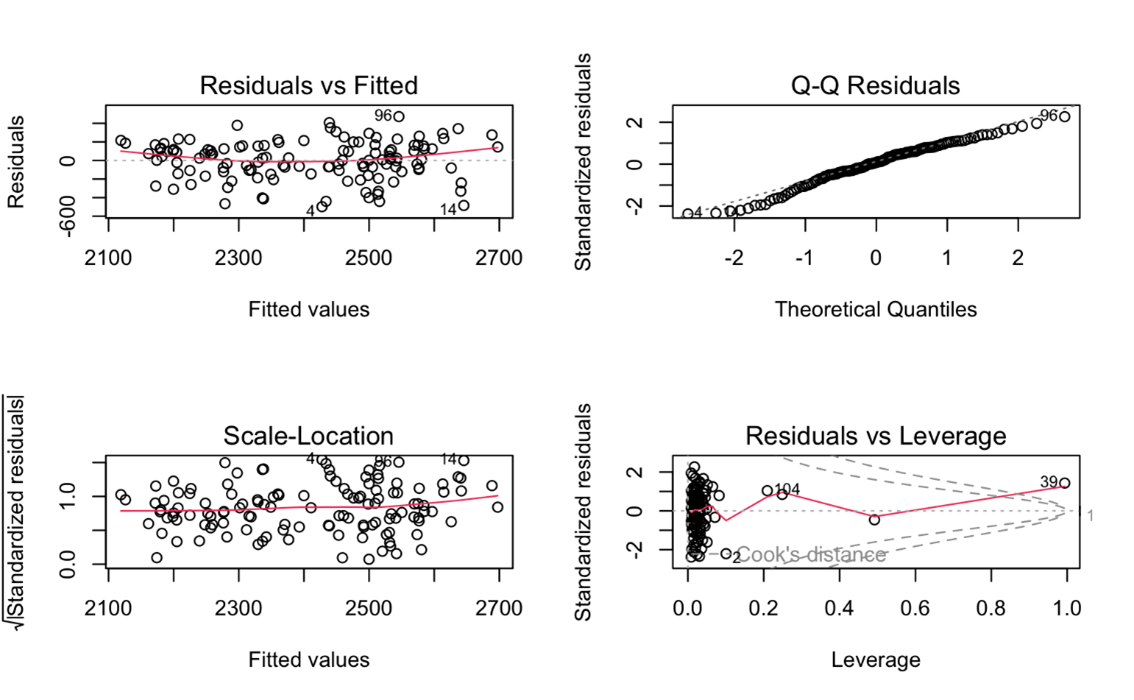
The Residuals vs Fitted plot shows that the residuals are spread randomly around the fitted values (Figure 4). The variance of the errors does not change with the fitted values. Some outliers may affect the model’s performance.
The Q-Q Plot indicates that most residuals align with the theoretical distribution line, suggesting that the residuals are close to a normal distribution. However, some points at the extremes deviate from this line, indicating potential outliers that could impact the model’s results.
The Scale-Location plot shows that the red line is relatively straight, indicating stable variance in the model. However, some data points are not uniformly distributed, suggesting that outliers may affect the homogeneity of variance.
The residual vs Leverage plot shows that most data points have low leverage values and small standardized residuals, indicating minimal impact on the model. However, a small number of marked points have high leverage values and residuals, which may significantly impact the model and require further analysis.
3.3. Non-linear model analysis
The non-linear model analysis was inspired by the article by Wang and Zhou. Future hotter summers greatly increase residential electricity consumption in Beijing [3]. That article examines the impact of hotter summers on electricity consumption in Beijing. The author’s article applies a similar approach to construct a non-linear model between temperature and energy consumption. The model equation is Total Energy equals Beta0 plus Beta1 times temperature plus Beta2 times temperature squared plus Error. The author analysed Table 4 below. The quadratic coefficient, which is 2.111, represents the quadratic effect of temperature, indicating the curvature of a U-shaped curve. However, this coefficient is not statistically significant with a p-value of 0.226. This suggests that the U-shaped curve may not be clearly defined in the current model. Thus, the linear regression model is a better fit to data (table 4).
Table 4. R output of the non-linear model.
Estimate | Std.Error | T value | P value | |
Intercept | 2967.8 | 170.0 | 17.5 | <2e-16 |
Variable a | -79.9 | 36.2 | -2.2 | 0.03 |
Variable b | 2.1 | 1.7 | 1.2 | 0.22 |
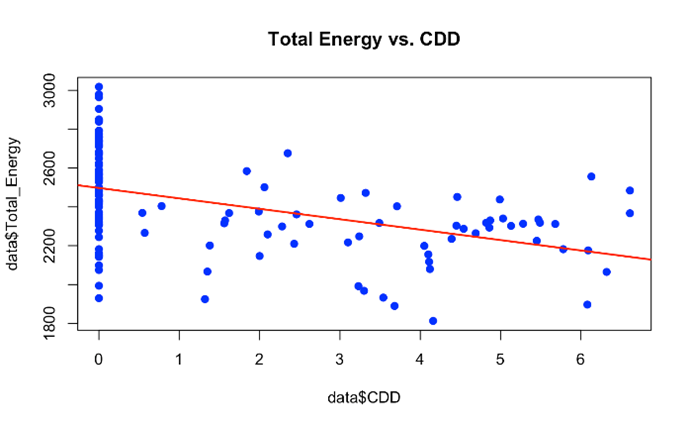
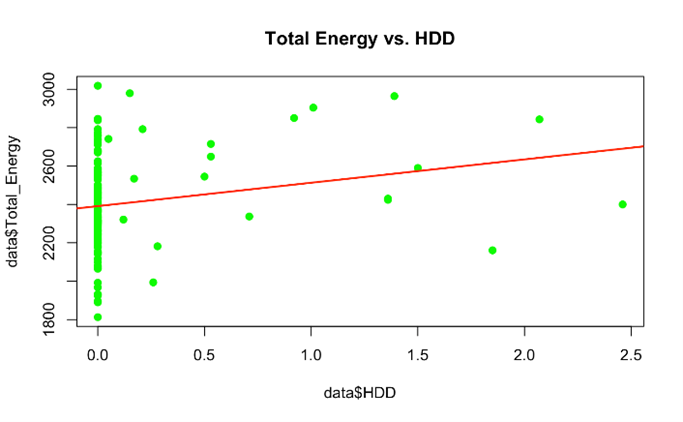
3.4. Degree days analysis
The author was inspired by the article from Shi, the author decided to further analyse the data using Degree Days Method [5]. Cooling Degree Days (CDD) and Heating Degree Days (HDD) were used to analyze the relationship between temperature and energy consumption. The cooling base temperature was set at 10°C, and the heating base temperature was set at 6°C. Figure 5 shows that as CDD increases, total energy consumption trends downward. This result is inconsistent with the assumption that an increase in cooling demand would lead to higher energy consumption. The likely reason is that temperatures in Ireland are not high enough to create a significant cooling need. The graph of Total Energy versus HDD (Figure 6) shows a slight positive correlation, indicating that total energy consumption increases as HDD increases. This finding aligns with the expectation that energy consumption rises with increased heating demand when temperatures drop below the base temperature of 6°C. Most data points are concentrated in the lower HDD region, suggesting that temperatures in Ireland are generally not far below the baseline.
| |
Figure 5. Energy vs. CDD. | |
| |
Figure 6. Energy vs. HDD. | |
4. Conclusion
This study analysed the impact of climate change on monthly energy consumption in Ireland. By constructing linear and nonlinear regression models, the author finds that temperature has a significant effect on energy consumption. An increase in temperature usually leads to a decrease in total energy consumption, especially at lower temperatures, where energy consumption is concentrated on heating demand. When the temperature rises above a certain point, energy consumption begins to decrease significantly, which may be due to reduced heating demand at higher temperatures. Other variables such as visibility and precipitation have a small impact on energy consumption, indicating that these factors are not a major influence in Irish climate conditions.
In addition, by introducing cooling degree-day (CDD) and heating degree-day (HDD) analysis methods, this paper further verified the impact of temperature changes on energy consumption. The relationship between CDD and total energy consumption was not significant, possibly due to Ireland's colder temperatures and low demand for air conditioning in summer. There was a slight positive correlation between HDD and total energy consumption, indicating a high demand for heating in winter in Ireland.
Overall, this study shows that in the Irish climate, temperature variation is the main factor affecting energy consumption, while other meteorological variables have a more limited impact. More reference variables can be introduced in the future.
References
[1]. Su Y and Li X 2023 Modeling the impacts of climate change on monthly commercial sector electricity consumption. Energy Sci Eng, 1370-1381.
[2]. Zhang H and Liu Q 2021 Exploring the impact of temperature change on residential electricity consumption in China: The crowding-out effect of income growth. Energy & Buildings, 245.
[3]. Wang J and Zhou Y 2022 Future hotter summers greatly increase residential electricity consumption in Beijing: A study based on different house layouts and shared socioeconomic pathways. Sustainable Cities and Society, 91.
[4]. Liu Q and Yang W 2022 Increased summer electric power demand in Beijing driven by preceding spring tropical North Atlantic warming. Atmospheric and Oceanic Science Letters, 15.
[5]. Hou Y L, Mu H Z, Dong G T and Shi J 2022 Influences of urban temperature on the electricity consumption of Shanghai. Advances in Climate Change Research, 74-80.
[6]. Feng Y Y, Chen S Q and Zhang L X 2013 System dynamics modeling for urban energy consumption and CO2 emissions: A case study of Beijing, China. Ecological Modelling, 44-52.
[7]. Zhao T and Chen B 2022 The impact of climate change on urban resilience in the Beijing-Tianjin-Hebei region. Science of the Total Environment, 827.
[8]. Li M and Zhao T 2024 Urban heat island analysis based on high-resolution measurement data: A case study in Beijing. Sustainable Cities and Society, 106.
[9]. Wang H and Li F 2023 Predicting the response of heating and cooling demands of residential buildings with various thermal performances in China to climate change. Energy, 269.
[10]. Chen L and Zhang S 2024 The impact of temperature changes on residential energy consumption. Working Paper, 1618.
Cite this article
Zhou,W. (2024). Analysis of the influence of climate change on monthly energy consumption in Ireland. Theoretical and Natural Science,51,214-221.
Data availability
The datasets used and/or analyzed during the current study will be available from the authors upon reasonable request.
Disclaimer/Publisher's Note
The statements, opinions and data contained in all publications are solely those of the individual author(s) and contributor(s) and not of EWA Publishing and/or the editor(s). EWA Publishing and/or the editor(s) disclaim responsibility for any injury to people or property resulting from any ideas, methods, instructions or products referred to in the content.
About volume
Volume title: Proceedings of CONF-MPCS 2024 Workshop: Quantum Machine Learning: Bridging Quantum Physics and Computational Simulations
© 2024 by the author(s). Licensee EWA Publishing, Oxford, UK. This article is an open access article distributed under the terms and
conditions of the Creative Commons Attribution (CC BY) license. Authors who
publish this series agree to the following terms:
1. Authors retain copyright and grant the series right of first publication with the work simultaneously licensed under a Creative Commons
Attribution License that allows others to share the work with an acknowledgment of the work's authorship and initial publication in this
series.
2. Authors are able to enter into separate, additional contractual arrangements for the non-exclusive distribution of the series's published
version of the work (e.g., post it to an institutional repository or publish it in a book), with an acknowledgment of its initial
publication in this series.
3. Authors are permitted and encouraged to post their work online (e.g., in institutional repositories or on their website) prior to and
during the submission process, as it can lead to productive exchanges, as well as earlier and greater citation of published work (See
Open access policy for details).
References
[1]. Su Y and Li X 2023 Modeling the impacts of climate change on monthly commercial sector electricity consumption. Energy Sci Eng, 1370-1381.
[2]. Zhang H and Liu Q 2021 Exploring the impact of temperature change on residential electricity consumption in China: The crowding-out effect of income growth. Energy & Buildings, 245.
[3]. Wang J and Zhou Y 2022 Future hotter summers greatly increase residential electricity consumption in Beijing: A study based on different house layouts and shared socioeconomic pathways. Sustainable Cities and Society, 91.
[4]. Liu Q and Yang W 2022 Increased summer electric power demand in Beijing driven by preceding spring tropical North Atlantic warming. Atmospheric and Oceanic Science Letters, 15.
[5]. Hou Y L, Mu H Z, Dong G T and Shi J 2022 Influences of urban temperature on the electricity consumption of Shanghai. Advances in Climate Change Research, 74-80.
[6]. Feng Y Y, Chen S Q and Zhang L X 2013 System dynamics modeling for urban energy consumption and CO2 emissions: A case study of Beijing, China. Ecological Modelling, 44-52.
[7]. Zhao T and Chen B 2022 The impact of climate change on urban resilience in the Beijing-Tianjin-Hebei region. Science of the Total Environment, 827.
[8]. Li M and Zhao T 2024 Urban heat island analysis based on high-resolution measurement data: A case study in Beijing. Sustainable Cities and Society, 106.
[9]. Wang H and Li F 2023 Predicting the response of heating and cooling demands of residential buildings with various thermal performances in China to climate change. Energy, 269.
[10]. Chen L and Zhang S 2024 The impact of temperature changes on residential energy consumption. Working Paper, 1618.