


1. Introduction
Euthymia, manic, depressive episodes, and mixed states are among the significant mood fluctuations that bipolar disorder (BD) is characterized by, making it a significant public health concern [1, 2]. It affects approximately 1% of the global population [3]. Bipolar I condition is diagnosed based on the manifestation of manic episodes, while Bipolar II disorder is characterized by the presence of both significant depression and hypomania [4]. Individuals with bipolar disorder frequently encounter significant impairments in their social, occupational, and cognitive abilities, and have a suicide risk that is 20-30 times greater than that of the whole population [3]. Moreover, BD often comorbids with other mental disorders, such as emotional dysregulation and depression, which makes the diagnosis and treatment more complex [5]. The economic impact of BD is significant, characterized by substantial direct medical expenses and indirect expenditures resulting from work difficulties [6]. The disorder's widespread occurrence and significant influence on persons' well-being emphasize the necessity for continuous research and efficient management options.
Research has identified several contributing factors to BD, including genetic, neurobiological, and environmental influences. Genetic studies reveal that BD is highly heritable, with multiple implicated genes [4]. Genome-wide association studies (GWAS) have discovered important loci, such as CACNA1C and TRANK1, that are linked to an elevated risk of BD [7]. The Enhancing Neuro Imaging Genetics through Meta-Analysis (ENIGMA) BD Working Group has provided large-scale neuroimaging data, revealing functional abnormalities in cortical thickness, subcortical volume, and white matter integrity associated with BD [8]. The correlation between lower serum IGF-2 levels and manic symptom severity in BD patients has been observed by neurochemical studies, which suggests that IGF-2 may be a potential biomarker [9]. Stressful life events, childhood trauma, and substance abuse are all environmental factors that contribute to the onset and course of BD [10].
Conventionally, diagnosing BD relies on the Diagnostic and Statistical Manual of Mental Disorders (DSM) criteria, which involves specialists making accurate judgments based on suspected symptoms and giving patients treatments [11]. This process can be time-consuming and expensive, particularly for low-income individuals. Machine learning (ML) involves training algorithms to learn from large datasets and make predictions or decisions based on individual symptoms. In a two-step procedure, a learning algorithm is trained on extensive data and then evaluated on a smaller test set, extracting structured knowledge to produce predictive models that can be shared and easily applied to numerous patients in various mental health contexts [12].
Supervised learning algorithms, such as logistic regression (LR) and Random Forest (RF) models, use labeled data to train models. The LR model is noted for its excellent predictive capabilities, ease of training, and straightforward interpretability [13]. The model's coefficients are easily understood, facilitating the interpretation of relationships between input features and predicted outcomes [13]. LR is versatile, applicable to various classification problems, and can be enhanced with regularization techniques to prevent overfitting [13]. The RandomForestClassifier is a prominent data mining technique known for its superior classification performance compared to many other advanced algorithms. This robust performance has contributed to its rising popularity in recent years, particularly within the field of mental health research. RF's ability to handle complex and diverse datasets, along with its resilience to overfitting, makes it an ideal choice for analyzing mental diseases [14]. The method's effectiveness in delivering accurate and reliable results has led to its widespread adoption and application in various studies and clinical contexts, enhancing our understanding and management of mental health conditions.
By utilizing both LR and RF models, we can gain a deeper understanding of the complex relationships between various risk factors and bipolar disorder. This study will train and evaluate two different models. The model that demonstrates the highest performance on this dataset will be used to predict the type of bipolar disorder, providing valuable insights for diagnosis and treatment.
2. Method
2.1. Data source
Harvard Dataverse provides the dataset used for analysis in this paper, and it offers a collection of textual features extracted from Reddit posts within a subreddit dedicated to bipolar disorder [15]. The dataset includes 120 patients as participants and features 16 attributes related to mental health and the diagnosis of bipolar disorders. Furthermore, the dataset supports the development of predictive models because the expert diagnosis for each individual is given, which is suitable for building LR and RF models.
The data recorded in the dataset are all in textual format and need to be converted into numerical data for analysis in data preprocessing under the Python 3.11 environment. The attributes for sadness, euphoria, exhaustion, and sleep disorder are reported in frequencies: 0-never, 1-seldom, 2-sometimes, 3-usually, and 4-most often. The mood swings, suicidal thoughts, anorexia, authority respect, try-explanation, aggressive response, ignore & move-on, nervous breakdown, and admit mistakes attributes are binary variables, where Yes is coded as 1 and No as 0. Sexual activity, concentration, and optimism are recorded as ordinal variables on a scale from 0 to 10. The expert diagnosis is encoded as follows: 'BD Type-1' = 0, 'BD Type-2' = 1, 'Depression' = 2, and 'Normal' = 3. In the exploratory data analysis, no missing data was found, and all the features were standardized to have the same unit. The correlation matrix between each feature was computed and revealed no strong relationships between any two features. Therefore, additional techniques to address multicollinearity were not considered necessary for this analysis.
2.2. Multivariable logistic regression model
The multinomial LR model is an extension of LR that handles multiple classes by estimating the probability of each class through a set of linear equations, making it suitable for classification tasks with more than two outcomes. The LogisticRegression from the ‘sklearn’ package was used to establish and fit this model. For this analysis, the LR model utilized 80% of the processed data that was randomly assigned to the training set, while the remaining 20% of the dataset was used as a testing set to evaluate the model's performance.
2.3. RF model
The RF model integrates several decision trees to boost predictive accuracy and mitigate overfitting by averaging their outputs, making it a strong option for both classification and regression tasks [14]. The RandomForestClassifier from the ‘sklearn’ package was used to build and simulate the RF model for predicting bipolar disorder. The same training and testing sets used for the LR model were also employed to fit the RF model. This consistency ensures that the evaluation of model performance is based on identical data splits, allowing for a fair comparison between the models.
2.4. Evaluation of both models
The following values are used to evaluate and compare between two models. Accuracy measures how well the predicted results align with the actual outcomes in a test dataset, calculated as the proportion of correct predictions to the total number of predictions. This ratio is then expressed in percentages to provide the model's accuracy.
Machine learning model performance is evaluated through k-Fold Cross-Validation (CV), with k set to 5 in this case. This method splits the data into 5 subsets, using some for training and the rest for validation. This process is repeated multiple times with different splits, and the results are averaged to obtain a single performance metric. A high value of the CV denotes that the model performs well over different samples of the data, therefore meaning that it is robust and reliable.
A confusion matrix calculates the true positives, false positives, false negatives, and true negatives for each class. In predicting BD, the confusion matrix shows how many instances of BD Type-1, BD Type-2, Depression, and Normal were correctly identified and how many were misclassifications.
The classification report, imported from the 'sklearn' package, includes metrics like precision, recall, F1-score, and support for each class. Precision is defined as the proportion of true positive predictions among all positive predictions, reflecting the accuracy of positive predictions. It indicates the accuracy of the positive predictions. Recall, or sensitivity, is the proportion of true positive predictions out of the actual positives, assessing the model's capability to detect all relevant instances. The F1-score, calculated as the harmonic mean of precision and recall, balances these two metrics and is particularly valuable in situations where class distribution is uneven. Support is the number of actual occurrences of each class in the dataset.
The Receiver Operating Characteristic (ROC) curve visually represents a model's performance at various threshold levels. The Area Under the Curve (AUC) quantifies the model's ability to distinguish between classes. An AUC of 1 indicates ideal classification, whereas an AUC of 0.5 suggests no discrimination capability, akin to random guessing.
3. Result
This study included 120 individuals in the dataset, 28 BD Type I patients, 31 BD Type II patients and depression patients respectively, and 30 normal people. In this section, the performances of the multinomial LR model and the RF model in predicting bipolar disorder are compared using accuracy, confusion matrix, cross-validation scores, classification report, and ROC-AUC curves.
3.1. Accuracy
The accuracy of the multinomial LR model was 83%, while the RF model achieved an accuracy of 79%. Higher accuracy indicates better overall performance on the test set.
3.2. Confusion matrix
Figures 1 and 2 show the confusion matrices for the multinomial LR and RF models, respectively. The diagonal elements reflect accurate predictions, whereas the off-diagonal elements represent instances of misclassification.
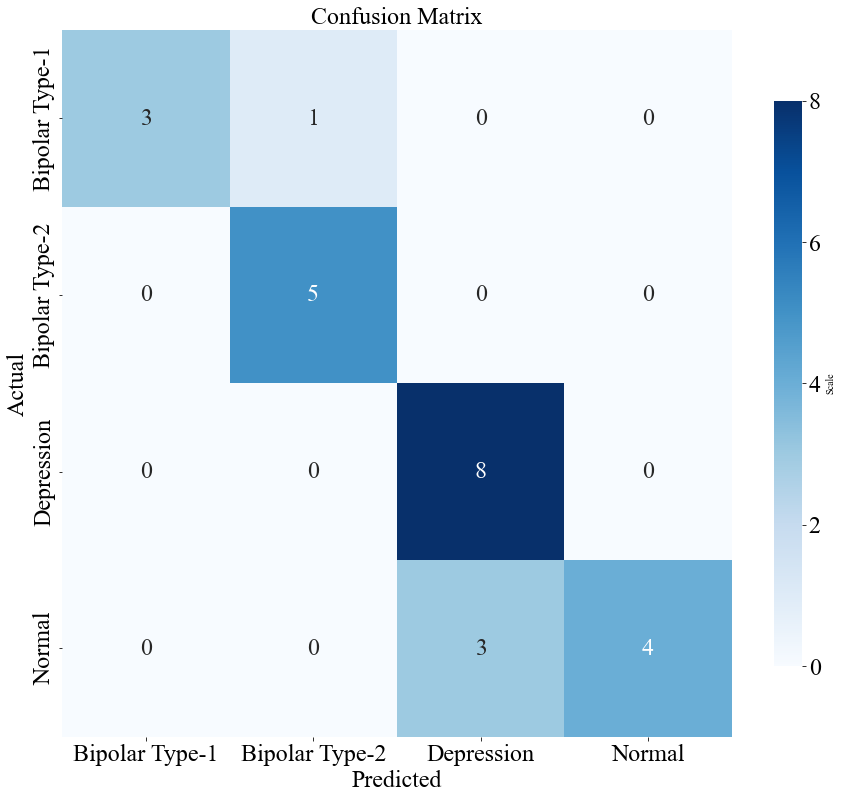
Figure 1. The confusion matrix of the multivariable LR model (Original).
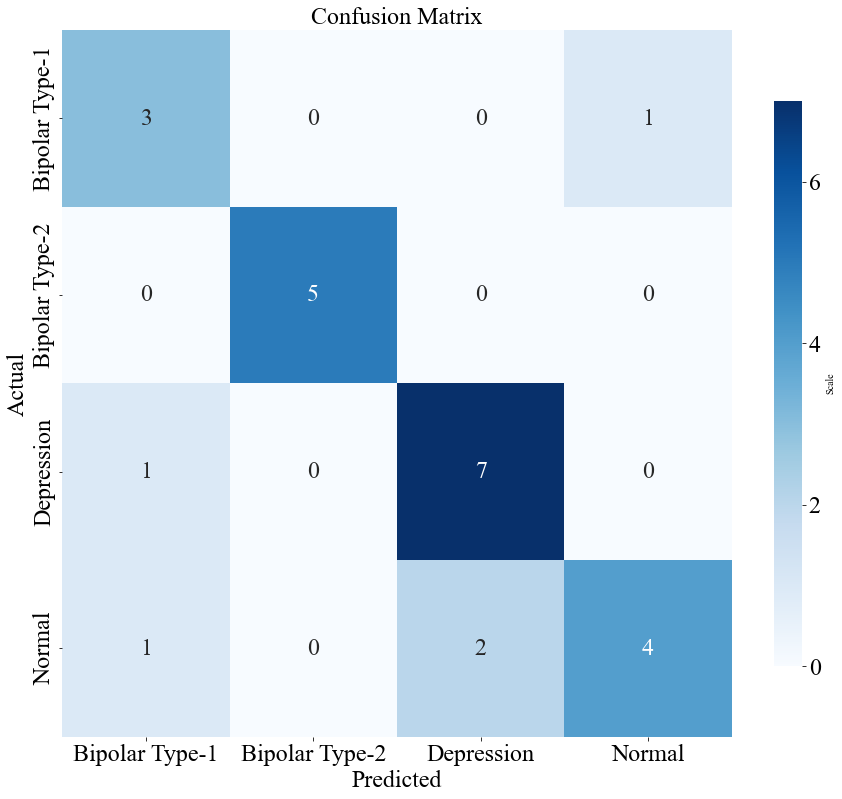
Figure 2. The confusion matrix of the RF model (Original).
3.3. 5-Fold cross-validation
The cross-validation scores for the multinomial LR model were [0.83, 0.92, 0.83, 0.95, 0.88], with a mean of 0.90. The RF model had CV scores of [0.92, 0.92, 0.80, 0.92, 0.88], with a mean of 0.89. Higher and more consistent CV scores suggest better generalizability.
3.4. Classification report
Tables 1 and 2 provide the classification reports for the multinomial LR and RF models, respectively. The reports include precision, recall, F1-scores, and support for each class.
Table 1. Classification report of multivariable LR model.
Precision | Recall | F1-score | Support | |
BD-1 | 1.00 | 0.75 | 0.86 | 4 |
BD-2 | 0.83 | 1.00 | 0.91 | 5 |
Depression | 0.73 | 1.00 | 0.84 | 8 |
Normal | 1.00 | 0.57 | 0.73 | 7 |
Table 2. Classification report of RF model.
Precision | Recall | F1-score | Support | |
BD-1 | 0.60 | 0.75 | 0.67 | 4 |
BD-2 | 1.00 | 1.00 | 1.00 | 5 |
Depression | 0.78 | 0.88 | 0.84 | 8 |
Normal | 0.80 | 0.57 | 0.67 | 7 |
3.5. ROC-AUC curve
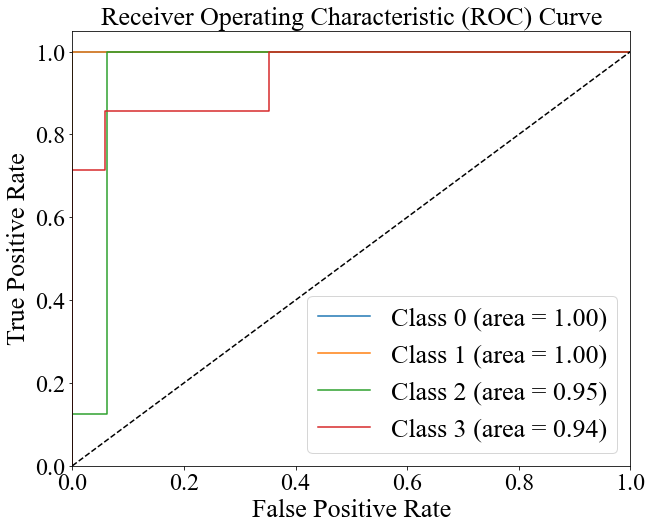
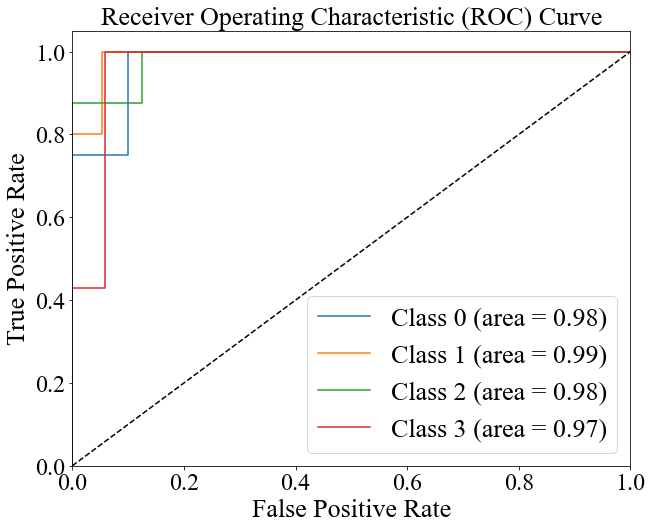
Figures 3 and 4 present the ROC curves for the multinomial LR and RF models. The AUC values are [1.00, 1.00, 0.95, 0.94] with an average of 0.97 for the LR model and [0.98, 0.99, 0.98, 0.97] with an average of 0.98 for the RF model, indicating the latter's better ability to classify between classes.
|
|
Figure 3. The ROC curve of the multivariable LR model (Original). | Figure 4. The ROC curve of the RF model (Original). |
4. Discussion
The results suggest that the multinomial LR model shows better predictive ability than the RF model across multiple evaluation metrics. The LR model achieved an accuracy of 83%, higher and more consistent cross-validation scores, and superior discriminative ability, as evidenced by higher ROC-AUC values. In contrast, the RF model, while achieving a reasonable accuracy of 79%, exhibited lower precision and recall for certain classes, particularly in distinguishing between normal and depression.
The confusion matrix analysis revealed that the LR model had fewer misclassifications, especially in the depression and normal classes. The classification report further underscored the LR model's balanced performance, with high precision and recall across most classes. The findings indicate that the multinomial LR model is more effective in predicting bipolar disorder and its subtypes, making it a strong and dependable tool for clinical diagnostics.
The performance differences between the LR and RF models can be attributed to their underlying methodologies and the nature of the dataset. The LR model, which calculates a weighted sum of clinical features and textual data followed by a logistic (softmax) function, optimizes its parameters by minimizing the cross-entropy cost function via gradient descent [16]. This process ensures accurate probability estimates for each class, resulting in high accuracy (83%) and consistent cross-validation scores (0.90). These results suggest that LR is a robust and reliable method for diagnosing BD.
The RF model, starting with the same 16 input features, generates multiple decision trees using bootstrap samples, aggregating their predictions through majority voting. This method captures complex, non-linear patterns, making it suitable for datasets with intricate feature interactions [17]. However, in this study, the smaller sample size (n = 120) and relatively uncomplicated data favored the simpler LR model. According to Occam's Razor’s principle, simpler models are often preferable when sufficient, and LR’s ability to handle binary, ordinal, and frequency-based variables effectively contributed to its superior performance [18]. In contrast, the RF model’s complexity and susceptibility to overfitting, particularly in a small dataset, may have hindered its effectiveness.
5. Conclusion
This study evaluated the predictive abilities of multinomial LR and RF models in diagnosing BD using a dataset of 120 individuals. The models were evaluated using metrics such as accuracy, confusion matrices, cross-validation scores, classification reports, and ROC-AUC curves. The findings demonstrated that the multinomial LR model’s accuracy is higher than that of the RF model (83% vs. 79%), cross-validation consistency, and ROC-AUC values. The LR model’s simplicity and its alignment with the dataset’s characteristics contributed to its superior performance, particularly in distinguishing between normal and depression classes. While RF is powerful in capturing complex, non-linear patterns, its effectiveness may have been limited by the small sample size and relatively straightforward data, suggesting that its true potential would be better realized with larger, more complex datasets in clinical diagnosis.
It is important to acknowledge the various constraints of this study. The limited sample size used in this study may restrict the applicability of the results to a larger population, and the dataset, obtained from self-reported information on Reddit, may not fully encompass the intricacies of bipolar disease, thereby adding biases that could impact the performance of the model. To improve the accuracy and practicality of models in diagnosing bipolar disorder, future studies should prioritize the utilization of extensive and varied datasets, as well as the incorporation of more comprehensive data sources, such as genetic and neuroimaging data.
In summary, this research showcases the potential of multinomial LR as a valuable tool for diagnosing bipolar disorder. By providing accurate and reliable predictions, machine learning models can significantly contribute to early diagnosis and effective management of BD, ultimately benefiting patients, their families, and society. Future studies should aim to overcome the identified limitations and investigate advanced machine learning techniques to enhance diagnostic accuracy and reliability in mental health care.
References
[1]. Grande, I., Berk, M., Birmaher, B., & Vieta, E. (2016). Bipolar disorder. Lancet, 387(10027), 1561-1572.
[2]. Latifian, M., Abdi, K., Raheb, G., Islam, S. M. S., & Alikhani, R. (2023). Stigma in people living with bipolar disorder and their families: a systematic review. International Journal of Bipolar Disorders, 11(9).
[3]. Miller, J. N., & Black, D. W. (2020). Bipolar Disorder and Suicide: a Review. Current Psychiatry Reports, 22(6).
[4]. Goodwin, G. M. (2024). Bipolar disorder. Medicine, 52(8), 481-484.
[5]. Oliva, V., De Prisco, M., Fico, G., Possidente, C., Fortea, L., Montejo, L., ... & Radua, J. (2023). Correlation between emotion dysregulation and mood symptoms of bipolar disorder: A systematic review and meta‐analysis. Acta Psychiatrica Scandinavica, 148(6), 472-490.
[6]. McIntyre, R. S., Berk, M., Brietzke, E., Goldstein, B. I., López-Jaramillo, C., Kessing, L. V., ... & Mansur, R. B. (2020). Bipolar disorders. The Lancet, 396(10265), 1841-1856.
[7]. Gordovez, F. J. A., & McMahon, F. J. (2020). The genetics of bipolar disorder. Molecular psychiatry, 25(3), 544-559.
[8]. Ching, C. R., Hibar, D. P., Gurholt, T. P., Nunes, A., Thomopoulos, S. I., Abé, C., ... & ENIGMA Bipolar Disorder Working Group. (2022). What we learn about bipolar disorder from large‐scale neuroimaging: Findings and future directions from the ENIGMA Bipolar Disorder Working Group. Human brain mapping, 43(1), 56-82.
[9]. Ye, S. Y., Zhao, Y., Liu, Z. B., Luo, C. P., Xiong, J. W., Zhan, J. Q., ... & Yang, Y. J. (2024). Lower serum insulin-like growth factor 2 level in patients with bipolar disorder is associated with the severity of manic symptoms during manic episodes. Frontiers in Psychiatry, 15, 1354999.
[10]. Marangoni, C., Hernandez, M., & Faedda, G. L. (2016). The role of environmental exposures as risk factors for bipolar disorder: a systematic review of longitudinal studies. Journal of affective disorders, 193, 165-174.
[11]. American Psychiatric Association. (2013). Diagnostic and statistical manual of mental disorders (5th ed.). American Psychiatric Association.
[12]. Bzdok, D., & Meyer-Lindenberg, A. (2018). Machine learning for precision psychiatry: opportunities and challenges. Biological Psychiatry: Cognitive Neuroscience and Neuroimaging, 3(3), 223-230.
[13]. Nusinovici, S., Tham, Y. C., Yan, M. Y. C., Ting, D. S. W., Li, J., Sabanayagam, C., ... & Cheng, C. Y. (2020). Logistic regression was as good as machine learning for predicting major chronic diseases. Journal of clinical epidemiology, 122, 56-69.
[14]. Abou-Warda, H., Belal, N. A., El-Sonbaty, Y., & Darwish, S. (2017). A Random Forest model for mental disorders diagnostic systems. In Proceedings of the International Conference on Advanced Intelligent Systems and Informatics 2016 2 (pp. 670-680). Springer International Publishing.
[15]. Karbalaeipour, H., Damari, S., Zolfagharnasab, M. H., & Haghdadi, A. (2023). A collection of 120 psychology patients with 17 essential symptoms to diagnose mania bipolar disorder, depressive bipolar disorder, major depressive disorder, and normal individuals (Version 1). Harvard Dataverse.
[16]. Bisong, E. (2019). In Building Machine Learning and Deep Learning Models on Google Cloud Platform: A Comprehensive Guide for Beginners (pp. 243-250).
[17]. Biau, G. (2012). Analysis of a random forests model. The Journal of Machine Learning Research, 13(1), 1063-1095.
[18]. Borgqvist, J. G., & Palmer, S. (2022). Occam’s razor gets a new edge: the use of symmetries in model selection. Journal of The Royal Society Interface, 19(193).
Cite this article
Zhong,R. (2024). Performance comparison of logistic regression and random forest model in bipolar disorder diagnosis. Theoretical and Natural Science,50,134-140.
Data availability
The datasets used and/or analyzed during the current study will be available from the authors upon reasonable request.
Disclaimer/Publisher's Note
The statements, opinions and data contained in all publications are solely those of the individual author(s) and contributor(s) and not of EWA Publishing and/or the editor(s). EWA Publishing and/or the editor(s) disclaim responsibility for any injury to people or property resulting from any ideas, methods, instructions or products referred to in the content.
About volume
Volume title: Proceedings of ICBioMed 2024 Workshop: Workshop on Intelligent Medical Data Analysis for Precision Medicine
© 2024 by the author(s). Licensee EWA Publishing, Oxford, UK. This article is an open access article distributed under the terms and
conditions of the Creative Commons Attribution (CC BY) license. Authors who
publish this series agree to the following terms:
1. Authors retain copyright and grant the series right of first publication with the work simultaneously licensed under a Creative Commons
Attribution License that allows others to share the work with an acknowledgment of the work's authorship and initial publication in this
series.
2. Authors are able to enter into separate, additional contractual arrangements for the non-exclusive distribution of the series's published
version of the work (e.g., post it to an institutional repository or publish it in a book), with an acknowledgment of its initial
publication in this series.
3. Authors are permitted and encouraged to post their work online (e.g., in institutional repositories or on their website) prior to and
during the submission process, as it can lead to productive exchanges, as well as earlier and greater citation of published work (See
Open access policy for details).
References
[1]. Grande, I., Berk, M., Birmaher, B., & Vieta, E. (2016). Bipolar disorder. Lancet, 387(10027), 1561-1572.
[2]. Latifian, M., Abdi, K., Raheb, G., Islam, S. M. S., & Alikhani, R. (2023). Stigma in people living with bipolar disorder and their families: a systematic review. International Journal of Bipolar Disorders, 11(9).
[3]. Miller, J. N., & Black, D. W. (2020). Bipolar Disorder and Suicide: a Review. Current Psychiatry Reports, 22(6).
[4]. Goodwin, G. M. (2024). Bipolar disorder. Medicine, 52(8), 481-484.
[5]. Oliva, V., De Prisco, M., Fico, G., Possidente, C., Fortea, L., Montejo, L., ... & Radua, J. (2023). Correlation between emotion dysregulation and mood symptoms of bipolar disorder: A systematic review and meta‐analysis. Acta Psychiatrica Scandinavica, 148(6), 472-490.
[6]. McIntyre, R. S., Berk, M., Brietzke, E., Goldstein, B. I., López-Jaramillo, C., Kessing, L. V., ... & Mansur, R. B. (2020). Bipolar disorders. The Lancet, 396(10265), 1841-1856.
[7]. Gordovez, F. J. A., & McMahon, F. J. (2020). The genetics of bipolar disorder. Molecular psychiatry, 25(3), 544-559.
[8]. Ching, C. R., Hibar, D. P., Gurholt, T. P., Nunes, A., Thomopoulos, S. I., Abé, C., ... & ENIGMA Bipolar Disorder Working Group. (2022). What we learn about bipolar disorder from large‐scale neuroimaging: Findings and future directions from the ENIGMA Bipolar Disorder Working Group. Human brain mapping, 43(1), 56-82.
[9]. Ye, S. Y., Zhao, Y., Liu, Z. B., Luo, C. P., Xiong, J. W., Zhan, J. Q., ... & Yang, Y. J. (2024). Lower serum insulin-like growth factor 2 level in patients with bipolar disorder is associated with the severity of manic symptoms during manic episodes. Frontiers in Psychiatry, 15, 1354999.
[10]. Marangoni, C., Hernandez, M., & Faedda, G. L. (2016). The role of environmental exposures as risk factors for bipolar disorder: a systematic review of longitudinal studies. Journal of affective disorders, 193, 165-174.
[11]. American Psychiatric Association. (2013). Diagnostic and statistical manual of mental disorders (5th ed.). American Psychiatric Association.
[12]. Bzdok, D., & Meyer-Lindenberg, A. (2018). Machine learning for precision psychiatry: opportunities and challenges. Biological Psychiatry: Cognitive Neuroscience and Neuroimaging, 3(3), 223-230.
[13]. Nusinovici, S., Tham, Y. C., Yan, M. Y. C., Ting, D. S. W., Li, J., Sabanayagam, C., ... & Cheng, C. Y. (2020). Logistic regression was as good as machine learning for predicting major chronic diseases. Journal of clinical epidemiology, 122, 56-69.
[14]. Abou-Warda, H., Belal, N. A., El-Sonbaty, Y., & Darwish, S. (2017). A Random Forest model for mental disorders diagnostic systems. In Proceedings of the International Conference on Advanced Intelligent Systems and Informatics 2016 2 (pp. 670-680). Springer International Publishing.
[15]. Karbalaeipour, H., Damari, S., Zolfagharnasab, M. H., & Haghdadi, A. (2023). A collection of 120 psychology patients with 17 essential symptoms to diagnose mania bipolar disorder, depressive bipolar disorder, major depressive disorder, and normal individuals (Version 1). Harvard Dataverse.
[16]. Bisong, E. (2019). In Building Machine Learning and Deep Learning Models on Google Cloud Platform: A Comprehensive Guide for Beginners (pp. 243-250).
[17]. Biau, G. (2012). Analysis of a random forests model. The Journal of Machine Learning Research, 13(1), 1063-1095.
[18]. Borgqvist, J. G., & Palmer, S. (2022). Occam’s razor gets a new edge: the use of symmetries in model selection. Journal of The Royal Society Interface, 19(193).