


1. Introduction
Rheumatoid arthritis (RA), as a chronic disease with abnormality in immune system, resulted in synovitis, leading to pain, swelling, and joint deformity and disability if left untreated. It affects approximately 0.5% to 1% of the global population, with higher prevalence rates observed in women and in developed countries [1]. The burden of RA extends beyond individual suffering, impacting healthcare systems and economies due to medical expenses caused by diseases and a decrease in labor costs leading to a decrease in living expenses and social productivity.
Timely identification of RA enables prompt initiation of treatment, which can alleviate symptoms, prevent irreversible joint damage, and improve long-term outcomes for patients. Traditional diagnostic approaches often entail delays, leading to missed opportunities for intervention. However, recent research has emphasized the significance of early detection strategies, such as biomarker screening, in enhancing RA management. These approaches offer the potential to identify at-risk individuals before the onset of overt symptoms, facilitating proactive interventions to mitigate disease progression [2].
With the advancement of machine learning models, there is growing interest in leveraging predictive analysis for early detection of RA. Utilizing machine learning (ML) has become pivotal in forecasting the onset and progression of diseases. Through scrutinizing extensive datasets encompassing clinical records, genetic markers, and patient demographics, ML algorithms can discern patterns and risk factors linked with RA emergence with exceptional precision. This predictive capability heralds a transformative strategy in RA management, facilitating early interventions and tailored treatment modalities. Recent research underscores the potential of ML in enhancing RA prediction, enabling proactive healthcare interventions and enhancing patient outcomes [3]. The incorporation of ML into RA diagnostics symbolizes a paradigm shift towards more sophisticated, data-driven approaches in healthcare, offering the prospect of revolutionizing the early detection and management of this debilitating autoimmune disorder.
However, there is little information on the prediction models of the development of RA. In this study, the data sourced from National Health and Nutrition Examination Survey (NHANES) was analysed using several machine learning and logistic regressional models to predict the onset of RA among adults and compare the performance by Receiver Operating Characteristic (ROC) curve.
2. Method
2.1. Study population
The data used in this study was from NHANES (2010-2020), which is an ongoing nationwide survey aimed at evaluating the health and dietary conditions of the American population, approving by the National Center for Health Statistics (NCHS) Ethics Review Board. Detailed information about study procedures and findings can be accessed on the website at http://www.cdc.gov/nchs/nhanes.html.
This study included age, gender, education, smoking, BMI, diabetes, SII, and PHQ-9 as potential predictors of RA. This study exclusions included adults aging (<18 or >80), missing data on arthritis and diabetes diagnosis or parameters of blood cells, and participants with missing parameters of age, gender, education, BMI, and smoking history and depression scores (Figure 1).
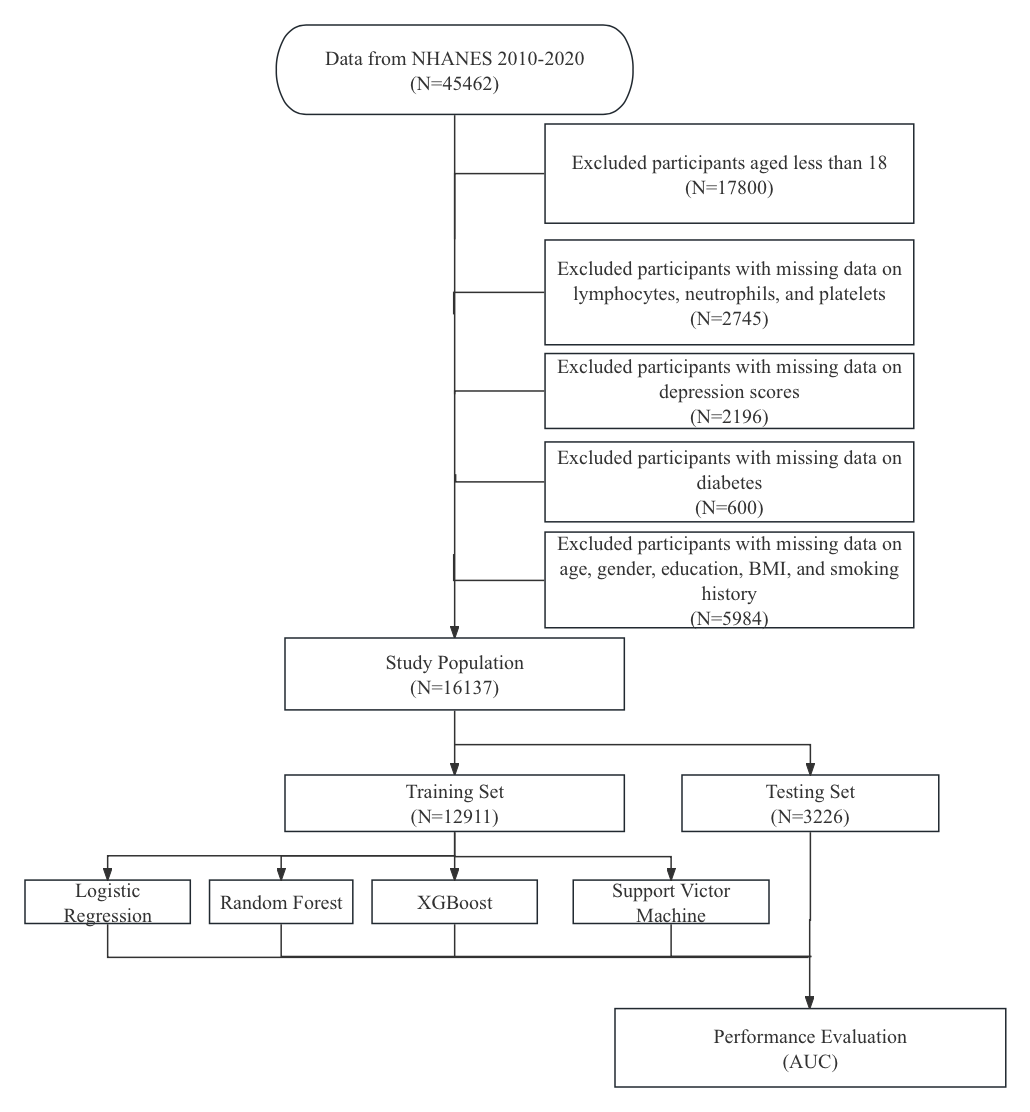
Figure 1. Study Flowchart.
2.2. The definition of systemic immune-inflammation index(SII)
The parameters of complete blood count(CBC) were counted and the distribution of blood cells and the white blood cell (WBC) differential were recorded. The SII was calculated using this formula: SII = platelet count × neutrophil count/lymphocyte count [4].
2.3. The definition of Patient Health Questionnaire (PHQ)
Depression was assessed using the nine-item of PHQ. The scores from each of the nine questions were added together manually to create a quasi-continuous variable for assessing depression.
2.4. The definition of smoking status
The participants were divided into two types such as “never smokers” and “smokers”. then the smorkers continued to divided into three groups as “previous smokers,” “occasional smokers,” and “daily smokers.” according to previous reference [4].
2.5. The definition of rheumatoid arthritis (RA)
The diagnosis of arthritis was obtained by a self-report questionnaire (MCQ160a) followed by previous study with 85% consistency between self report and clinical diagnostic [5].
2.6. Statistical analysis
All analyses were conducted by R with version 4.1.3. The categorical variables as percent and continuous variables as means ± SDs were statistic with two-sided, and a P-value less than 0.05 using Chi-square test and T-test , respectively.
The study population was divided into a 80% training set and a 20% testing set, which developed a prediction model using methods of logistic regression, random forest, and support victor machine (SVM). For the model of the logistic regression, stepwise method was used in variables selection. In order to obtain the model with the best performances, optimization of different parameters of random forest and SVM was conducted. Evaluation of the modeling performance was constructed in the testing set. All the three methods used 5-fold cross validation to select models based on ROC.
The R packages of CARET, KERNLAB, and RandomForest were adopted to perform 5-fold cross-validation, SVM model, and RF model and displayed representation of the diagrams.
3. Results
3.1. Demographic characteristic
16137 participants (15054 controls and 1083 RA patients) were included aged 18-80 years old. The demographic characteristics are shown in Table 1. Overall, statistically significantly difference were observed in age, sex, education, diabetes, BMI, SII, PHQ9 and smoking status between RA and control participants (Table 1).
Table 1. Demographic characteristics. | ||||
Variable | levels | No (n=15054) | Yes (n=1083) | p-value |
Sex | Male | 7875(52.3%) | 470(43.4%) | <0.001 |
Female | 7179(47.7%) | 613(56.6%) | ||
Age | Mean±SD | 45.0±16.7 | 60.4±13.3 | <0.001 |
Education | Grade <9 | 1137(7.6%) | 131(12.1%) | <0.001 |
Grade between 9-11 | 1776(11.8%) | 162(15.0%) | ||
Graduate from high school /GED or equivalent | 3354(22.3%) | 271(25%) | ||
College or AA degree | 4680(31.1%) | 379(35%) | ||
≥College graduate | 4107(27.3%) | 140(12.9%) | ||
Diabetes | Yes | 1603(10.6%) | 308(28.4%) | <0.001 |
No | 13451(89.4%) | 775(71.6%) | ||
BMI | Mean±SD | 28.8±6.8 | 31.3±7.9 | <0.001 |
SII | Mean±SD | 505.3±308.3 | 579.8±501.6 | <0.001 |
PHQ9 | Mean±SD | 2.8±3.9 | 4.9±5.3 | <0.001 |
Smoking status | Never | 9126(60.6%) | 516(47.6%) | <0.001 |
Previous | 3056(20.3%) | 321(29.6%) | ||
Occasional | 648(4.3%) | 44(4.1%) | ||
Daily | 2224(14.8%) | 202(18.7%) | ||
3.2. Logistic regression predicted models
The uni-variable and multi-variable ORs based on logistic regression are all shown in Table 2. According to uni-variable analysis, all of the variables in this dataset are highly related to RA (p-value all <0.05). Thus, all variables are placed in the multi-variable logistic regression model in 5-fold cross-validation with stepwise. The statistic analysis showed that all of the variables perform well in the final model (most p-value<0.05). In the testing set, the final logistic model reaches an AUC of 0.80 (95% CI 0.77-0.83), with a sensitivity of 0.72 and a specificity of 0.76 (Figure 2).
Table 2. The uni-variable and multi-variable Analysis. | |||
Variable | levels | OR (uni-variable) | OR (multi-variable) |
Sex | Male | ||
Female | 1.43(1.26-1.62, p<0.001) | 1.66(1.42-1.93, p<0.001) | |
Age | 1.06(1.05-1.06, p<0.001) | 1.06(1.06-1.07, p<0.001) | |
Education | Grade <9 | ||
Grade between 9-11 | 0.79(0.62-1.01, p=0.059) | - | |
Graduate from high school /GED or equivalent | 0.70(0.56-0.87, p=0.002) | - | |
College or AA degree | 0.70(0.57-0.87, p<0.001) | - | |
≥College graduate | 0.30(0.23-0.38, p<0.001) | 0.49(0.39-0.61, p<0.001) | |
Diabetes | Yes | ||
No | 0.30(0.26-0.35, p<0.001) | 0.71(0.59-0.84, p<0.001) | |
BMI | 1.05(1.04-1.05, p<0.001) | 1.04(1.03-1.05, p<0.001) | |
SII | 1.00(1.00-1.00, p<0.001) | 1.00(1.00-1.00, p=0.007) | |
PHQ9 | 1.10(1.08-1.11, p<0.001) | 1.09(1.07-1.10, p<0.001) | |
Smoking status | Never | ||
Previous | 1.86(1.61-2.15, p<0.001) | - | |
Occasional | 1.20(0.87-1.65, p=0.259) | 1.62(1.11-2.31, p=0.009) | |
Daily | 1.61(1.36-1.90, p<0.001) | 1.48(1.21-1.80, p<0.001) | |
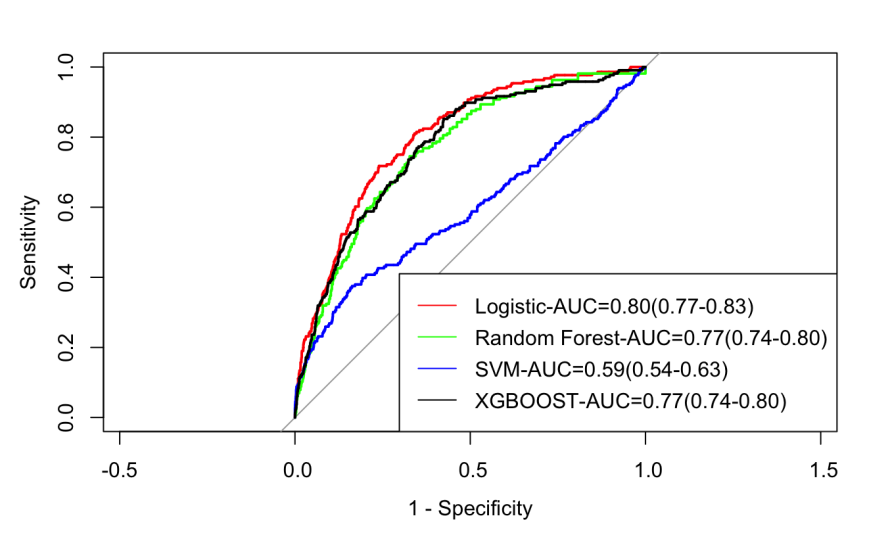
Figure 2. ROC plots of the predicting models.
3.3. Risk factor analysis
Based on the multi-regression methods (Table 2), the variables were positively associated with RA including female, age, BMI, SII, PHQ9, occasional and daily smokers, which were identified risk factors of RA. The risk factors of previous smokers observed in uni-variable analysis was not concluded in muti-variable analysis.
In comparison of education less than 9 grade, college graduates could be classified as preventive factors, as well as without diabetes (Table 2). However, preventive factors like some college, high school graduate and 9-11th grade found in uni-variable analysis were not present in muti analysis.
3.4. Random Forest and SVM
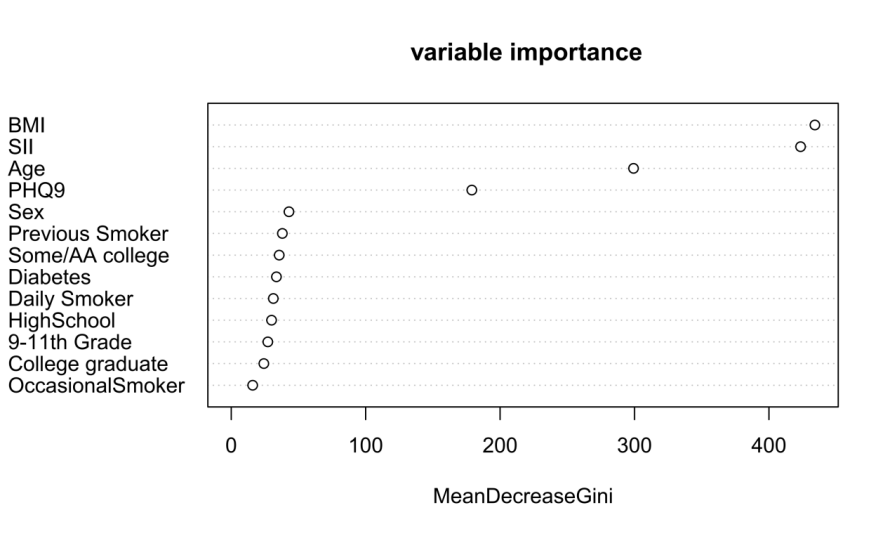
According to the random forest variable importance plot, BMI and SII are the most important variables. Next important variables are Age and PHQ9 (Figure 3). In the testing set, the performance of random forest, SVM, and XGBoost reach AUCs of 0.77, 0.59, and 0.77, with sensitivities of 0.67, 0.84, and 0.58, and specificities of 0.75, 0.38, and 0.85, respectively (Figure 2).
| |
Figure 3. Variable importance of random forest. | |
4. Discussion
RA is a long-term autoimmune condition marked by inflammation in the synovial membrane of joints, resulting in pain, swelling, stiffness, and eventual joint deterioration, which impacts roughly 1% population in the world []. In this study, RA prevalence was approximately 6.7% (Table 1). Of a total of 45,462 patients, including 29,325 patients who were excluded because of lack of baseline information, 1083 patients (2.3%) were defined as RA (Figure 1, Table 1). Therefore, the prevalence could be similar between this study and real world situation. This study has some novel contributions in comparison with the study of Liu’s group based on NHANES [5]. First, former studies focused on the relationships of potential factors like depression scores, exposure of phosphates, while this study combined these interested factors and constructed several predicting models to diagnosis RA. Secondly, this study included 3 commonly used machine learning algorithms and compared the performance of models with traditional method, logistic regression model. Finally, the performance of models was evaluated using ROC curves and AUC with 95%CI, since classifier is of great advantage when the outcome is rare.
Xu et al concluded that age, gender, diabetes, smoking, BMI were positively associated with RA [6]. Kim et al suggested that depression is significantly prevalent in RA patients [7]. In addition, as a systemic disease, systematic immune-inflammation index could be a potential marker that reflect the RA existence and may accurately conduct diagnosis. Thus, in this study, laboratory index SII ,depression score PHQ-9, and other baseline factors like age, gender, diabetes, smoking, BMI, education were included.
The results in this study showed that RA are associated with gender, smoking, BMI, and age. The possible reasons why aging is positive relation with the development of RA is that the gradual deterioration of the immune system with age, may contribute to persistent inflammation and immune-related damage to tissues. Additionally, the correlation between smoking and RA is widely recognized. In addition, this study indicate that the median BMI of RA participants is 31.3, which could be define as obesity. Also, the OR of BMI is statistical significant, suggesting obesity triggers heightened generation of inflammatory proteins, exacerbating joint inflammation caused by the disease itself. Liu et al showed that the risk of RA will significantly raise when SII is greater than 578.25. Their result concerning the relationship of RA and SII is roughly similar to this study [5]. Kim et al. suggest that the prevalence of depression related to a significant high RA prevalence [7]. This study also concluded depression as a noticeable risk factor of RA. This study showed that a person graduated from college or above compared with <9th grade is less likely to have RA (0.49,0.39-0.61, p<0.001), while Xu et al suggested that education had no association with RA [6] .
This study is the first to utilize the algorithms of machine learning to predict RA. Among these three methods, the XGBoost model provides the best performance in RA prediction, which were similar as some previous studies in mechanically ventilated patients in comparison with others models, such as decision tree and random forest, and so on [8]. However, In this study, logistic regression holds a better AUC than ML algorithms. Song et al. showed that logistic regression provides an optimal performance in predicting disease than ML methods in low dimension data [9].
As a retrospective study, no external data could be used to validate the model, which is the limitation of this study. Also, because of the low prevalence of RA, the whole population is imbalanced, which could lead to over-fitting.
In conclusion, this study construct 4 predicting models for RA. The logistic regression performed better than any other methods because of it’s AUC and easier interpretability. Also, with logistic regression risk factors like BMI, SII, diabetes, age, gender, smoking, education and PHQ-9 are determined. These results could help diagnose and decrease the development of RA.
References
[1]. Smolen, J. S., Aletaha, D., & McInnes, I. B. (2016). Rheumatoid arthritis. Lancet (London, England), 388(10055), 2023–2038. https://doi.org/10.1016/S0140-6736(16)30173-8
[2]. O'Neil, L. J., Alpízar-Rodríguez, D., & Deane, K. D. (2024). Rheumatoid Arthritis: The Continuum of Disease and Strategies for Prediction, Early Intervention, and Prevention. The Journal of rheumatology, 51(4), 337–349. https://doi.org/10.3899/jrheum.2023-0334
[3]. Wang, Y., Wei, W., Ouyang, R., Chen, R., Wang, T., Yuan, X., Wang, F., Hou, H., & Wu, S. (2024). Novel multiclass classification machine learning approach for the early-stage classification of systemic autoimmune rheumatic diseases. Lupus science & medicine, 11(1), e001125. https://doi.org/10.1136/lupus-2023-001125
[4]. Tutan, D., & Doğan, A. G. (2023). Pan-Immune-Inflammation Index as a Biomarker for Rheumatoid Arthritis Progression and Diagnosis. Cureus, 15(10), e46609. https://doi.org/10.7759/cureus.46609
[5]. Liu, B., Wang, J., Li, Y. Y., Li, K. P., & Zhang, Q. (2023). The association between systemic immune-inflammation index and rheumatoid arthritis: evidence from NHANES 1999-2018. Arthritis research & therapy, 25(1), 34. https://doi.org/10.1186/s13075-023-03018-6
[6]. Xu, B., & Lin, J. (2017). Characteristics and risk factors of rheumatoid arthritis in the United States: an NHANES analysis. PeerJ, 5, e4035. https://doi.org/10.7717/peerj.4035
[7]. Kim, H., Lee, H., & Lee, S. S. (2022). The prevalence and correlates of depression in Korean adults with rheumatoid arthritis: Results from the Korea National Health and Nutrition Examination Surveys. International journal of rheumatic diseases, 25(4), 454–465. https://doi.org/10.1111/1756-185X.14291
[8]. Zhu, Y., Zhang, J., Wang, G., Yao, R., Ren, C., Chen, G., Jin, X., Guo, J., Liu, S., Zheng, H., Chen, Y., Guo, Q., Li, L., Du, B., Xi, X., Li, W., Huang, H., Li, Y., & Yu, Q. (2021). Machine Learning Prediction Models for Mechanically Ventilated Patients: Analyses of the MIMIC-III Database. Frontiers in medicine, 8, 662340. https://doi.org/10.3389/fmed.2021.662340
[9]. Song, Y. X., Yang, X. D., Luo, Y. G., Ouyang, C. L., Yu, Y., Ma, Y. L., Li, H., Lou, J. S., Liu, Y. H., Chen, Y. Q., Cao, J. B., & Mi, W. D. (2023). Comparison of logistic regression and machine learning methods for predicting postoperative delirium in elderly patients: A retrospective study. CNS neuroscience & therapeutics, 29(1), 158–167. https://doi.org/10.1111/cns.13991
Cite this article
Pan,C. (2024). Rheumatoid arthritis prediction and risk factor analysis based on logistic regression and machine learning: A NHANES survey. Theoretical and Natural Science,49,126-132.
Data availability
The datasets used and/or analyzed during the current study will be available from the authors upon reasonable request.
Disclaimer/Publisher's Note
The statements, opinions and data contained in all publications are solely those of the individual author(s) and contributor(s) and not of EWA Publishing and/or the editor(s). EWA Publishing and/or the editor(s) disclaim responsibility for any injury to people or property resulting from any ideas, methods, instructions or products referred to in the content.
About volume
Volume title: Proceedings of the 4th International Conference on Biological Engineering and Medical Science
© 2024 by the author(s). Licensee EWA Publishing, Oxford, UK. This article is an open access article distributed under the terms and
conditions of the Creative Commons Attribution (CC BY) license. Authors who
publish this series agree to the following terms:
1. Authors retain copyright and grant the series right of first publication with the work simultaneously licensed under a Creative Commons
Attribution License that allows others to share the work with an acknowledgment of the work's authorship and initial publication in this
series.
2. Authors are able to enter into separate, additional contractual arrangements for the non-exclusive distribution of the series's published
version of the work (e.g., post it to an institutional repository or publish it in a book), with an acknowledgment of its initial
publication in this series.
3. Authors are permitted and encouraged to post their work online (e.g., in institutional repositories or on their website) prior to and
during the submission process, as it can lead to productive exchanges, as well as earlier and greater citation of published work (See
Open access policy for details).
References
[1]. Smolen, J. S., Aletaha, D., & McInnes, I. B. (2016). Rheumatoid arthritis. Lancet (London, England), 388(10055), 2023–2038. https://doi.org/10.1016/S0140-6736(16)30173-8
[2]. O'Neil, L. J., Alpízar-Rodríguez, D., & Deane, K. D. (2024). Rheumatoid Arthritis: The Continuum of Disease and Strategies for Prediction, Early Intervention, and Prevention. The Journal of rheumatology, 51(4), 337–349. https://doi.org/10.3899/jrheum.2023-0334
[3]. Wang, Y., Wei, W., Ouyang, R., Chen, R., Wang, T., Yuan, X., Wang, F., Hou, H., & Wu, S. (2024). Novel multiclass classification machine learning approach for the early-stage classification of systemic autoimmune rheumatic diseases. Lupus science & medicine, 11(1), e001125. https://doi.org/10.1136/lupus-2023-001125
[4]. Tutan, D., & Doğan, A. G. (2023). Pan-Immune-Inflammation Index as a Biomarker for Rheumatoid Arthritis Progression and Diagnosis. Cureus, 15(10), e46609. https://doi.org/10.7759/cureus.46609
[5]. Liu, B., Wang, J., Li, Y. Y., Li, K. P., & Zhang, Q. (2023). The association between systemic immune-inflammation index and rheumatoid arthritis: evidence from NHANES 1999-2018. Arthritis research & therapy, 25(1), 34. https://doi.org/10.1186/s13075-023-03018-6
[6]. Xu, B., & Lin, J. (2017). Characteristics and risk factors of rheumatoid arthritis in the United States: an NHANES analysis. PeerJ, 5, e4035. https://doi.org/10.7717/peerj.4035
[7]. Kim, H., Lee, H., & Lee, S. S. (2022). The prevalence and correlates of depression in Korean adults with rheumatoid arthritis: Results from the Korea National Health and Nutrition Examination Surveys. International journal of rheumatic diseases, 25(4), 454–465. https://doi.org/10.1111/1756-185X.14291
[8]. Zhu, Y., Zhang, J., Wang, G., Yao, R., Ren, C., Chen, G., Jin, X., Guo, J., Liu, S., Zheng, H., Chen, Y., Guo, Q., Li, L., Du, B., Xi, X., Li, W., Huang, H., Li, Y., & Yu, Q. (2021). Machine Learning Prediction Models for Mechanically Ventilated Patients: Analyses of the MIMIC-III Database. Frontiers in medicine, 8, 662340. https://doi.org/10.3389/fmed.2021.662340
[9]. Song, Y. X., Yang, X. D., Luo, Y. G., Ouyang, C. L., Yu, Y., Ma, Y. L., Li, H., Lou, J. S., Liu, Y. H., Chen, Y. Q., Cao, J. B., & Mi, W. D. (2023). Comparison of logistic regression and machine learning methods for predicting postoperative delirium in elderly patients: A retrospective study. CNS neuroscience & therapeutics, 29(1), 158–167. https://doi.org/10.1111/cns.13991