


1. Background
Depression has been a frequent disease in people's eyes since the 1920s. Most of the contemporary teenagers and staff have fallen into the vortex of depression because of the pressure of study, life and even family pressure brought by the progress of The Times.
First of all, in order to study the relevant data of this disease, statistician should first understand this disease. As statistician know, this disease is mainly divided into three types, and most of the causes of their onset are caused by the poor interpersonal relationship around the patients, too much pressure from study and work, and too much pressure from the family. Due to the booming development of Chinese society in recent years and the one-child policy, many families have only one child, and the family's hope for children is also rising year by year as the children around them have a good development situation. No matter in the workplace or among school students, there is a great psychology of comparison, which leads to everyone has their own ideas that are not good enough, and eager to make changes. However, the ability of many people is not enough to support them to complete the task similar to others, which leads to the differences between people. Many people think that others can do it, so they must do it themselves, which leads to anxiety after doing it. It is also a cause of the spike in the incidence of depression in recent years, and Chinese students study pressure, a lot of students in junior high and high school stage is not to have a good friend, this has directly affected their mental health status, because many children will be unable to pour out your troubles, and for some reason did not dare to open up and family, and cause disease.
Depression is not an affectation misunderstood by many people, it is actually a disease that has a great impact on people's lives. If the disease is too serious, it will even threaten the lives of patients. It deserves more attention. There are a lot of people today who are missing out on the best treatment for their children or themselves because they don't understand. Depression is just a very normal psychological disease, statistician can not because of the influence of the contemporary network and it has any misunderstanding, pay attention to depression, facing depression is what statistician should do.
For these reasons, statistician made a correlation analysis of depression in order to raise people's attention to depression in this way. Researchers have collected more than 10 articles about depression by logging in ZhiWang and searching for relevant literature. The relevant information is summarized as follows: Ida kupcova proposed in the “Institute of medical biology”: In contemporary times, the incidence rate of depression and anxiety is getting higher and higher. This tendency has a great impact on human mental health, causing a sharp rise in its incidence, and may even lead to suicide. The current medicine has a lot of anti worry agents and anti worry agents, but it still cannot alleviate the symptoms of many patients. Little is known about the physiological mechanism of depression and anxiety. Therefore, researchers focus on neuropeptides, a nervous system composed of many neurons. Lefan Liu proposed in the “Centre for Health Economics”: Based on this data, statistician have established the health index of the elderly and regard it as a result variable. The results showed that "physical health", "subjective health" and "cognitive health" were three factors. Then, the influence of diseases is compared by using the method of system equation. The results of this study show that there is an obvious relationship between chronic diseases and "physical health", "subjective health", rather than "cognitive health". Although major chronic diseases also have similar negative effects on the first and second health factors (except respiratory diseases), compared with other chronic diseases, depression is more harmful to personal and physical health. Jalal Moludi proposed in the “Student Research Committee”: The combination of probiotics and inulin with CAD patients for eight weeks has a good effect on depression, anxiety and inflammatory markers. It is much better to add inulin to probiotics supplement to improve the mental effect and inflammatory index of the body. Aruna Rose Mary Kapanee proposed in the “Departments of Clinical Psychology”: This research shows that statistician can use a systematic way to design and make mental health training videos, including empirical content, integrating the evaluation views of various stakeholders, and cultural background. Angela J. Inglis proposed in the “Arch Womens Ment Health”: The clinical guidelines recommend that medical physicians (such as EPDS) related to pregnant or postpartum women screen for current signs of depression; Perhaps, our data show that it is very meaningful to screen for mania in the perinatal period, especially for women with MDD. Ghadeer S. Alenzi proposed in the “Department of Family Medicine”: The current survey shows that the incidence of depression among junior high school girls is the same as that of every five girls in the report. statistician also need more research to measure the incidence of adolescent depression in this region and elsewhere, and to identify their risk factors. Teenagers, parents and teachers need to develop educational programs on depression, impact and risk factors. Wita Oktaviana proposed in the “Faculty of Nursing”: Education is recommended to prevent the risk factor of slow development: mother's depression. The conclusions of this study will contribute to the development of mental health promotion to prevent depression and prevention of mothers with mental disorders. In addition, this study is expected to provide treatment and recovery plans for patients with slow development. Tanti Apriliana proposed in the “Faculty of Nursing”: The conclusion of this survey can provide a basis for developing mental health care, avoiding depression when children grow up to be mothers and formulating preventive measures. In addition, the survey is expected to provide a medical and rehabilitation plan for children with slow development. Maryam Naeimi proposed in the “Student Research Committee”: Depression patients have a higher degree of anxiety about death, while the higher the religious belief, the lower the degree of depression and death anxiety. Therefore, when health care providers evaluate the depression of the elderly, religious belief may be a very important factor. In addition, since religious tendencies play a key role in the lives of elderly Iranians, it is clear that the relationship between religious beliefs and death anxiety and depression should be evaluated. Fiona Moir proposed in the “Department of General Practice and Primary Health Care”: Different doctors treat depression differently at the first visit. According to general physicians, there are many obstacles in the process of providing dialogue therapy. Changing to a more standardized direction will bring about more equitable medical services. This is the first report of the initial treatment recommendations for depression [1-10].
2. Introduction to Statistical Methods
2.1. Statistical table
A statistical table is formed by arranging the statistical data in a certain order on a table. Statistical table is an important form to display statistical data, and also an important tool to carry out statistical collation and analysis. In terms of form, the statistical table is composed of four parts: general title, horizontal title, vertical column title and index value; From the point of view of content, the statistical table is composed of subject words and object words. Subject words are the population or groups divided into by the population to be explained in the statistical table, and object words are the statistical indicators to explain the subject words.
2.2. Classification of statistical tables
•According to the purpose of classification, statistical tables can be divided into: questionnaire, summary or summary table, analysis table.
•According to the structure of the subject, it can be divided into simple table, grouped table and compound table according to whether the subject is grouped and the complexity of the grouping.
•According to the design classification of object words, according to the different design of object words, it can be divided into three kinds: simple arrangement of object words, grouping and horizontal arrangement and grouping and cascading chain
2.3. Statistical charts
A bar chart is a graph that represents a data type by the length or height of bars of the same width. A histogram is a graph with the width and height of a straight square to represent the frequency distribution.
Line graph can be based on the histogram, using the group median value and times of each group to obtain coordinate points, and then using broken lines to connect them.
2.4. Average Value
Numerical averages are representative values calculated from all observed data. Arithmetic mean is to average the symbol value of each unit in a homogeneous population, which requires strict correspondence between the total number of symbols and the number of units in the population. Simple linear correlation analysis and regression analysis. Definition of correlation coefficient \( γ=\frac{Cov(x,y)}{\sqrt[]{Var(X)Var(Y)}} \)
Correlation analysis uses indicators to show the closeness of the relationship between phenomena. Regression analysis is to select an appropriate mathematical model according to the specific form of correlation to approximately express the average change relationship between variables. In regression analysis, the simplest model is a linear regression model with only one dependent variable and one independent variable, namely unary linear regression model, also known as simple linear regression model \( Y={β_{1}}+{β_{2}}X+μ \) . Correlation analysis and regression analysis are closely related. They not only share a common object of study, but also often have to complement each other in specific applications. Correlation analysis studies the direction and degree of correlation between variables. Regression analysis studies the specific form of the relationship between variables. Correlation analysis cannot infer changes in one variable from changes in another. It is not necessary to determine which is the independent variable, which is the dependent variable, the variables involved can be random variables. Independent and dependent variables must be determined in advance for regression analysis. Generally speaking, the dependent variable is random, and the independent variable is regarded as a given non-random variable. SST is the sum of squares of total deviation; SSR is the sum of squared deviations that can be explained by the regression line, called the sum of squared regressions; SSE is the sum of squared deviations that cannot be explained by the regression line, called residual sum of squares. Divide both sides by SST, and you get: 1= \( \frac{SSR}{SST}+\frac{SSE}{SST} \) . Obviously, the closer each sample observation point is to the sample regression line, the greater the proportion of SSR in SST. Therefore, this proportion can be defined as the coefficient of determination, namely: R2= \( \frac{SSR}{SST}=1-\frac{SSE}{SST} \) . The coefficient of determination is a comprehensive measure of the fitting degree of the regression model. The larger the coefficient of determination, the higher the fitting degree of the model. The so-called significance test of regression coefficient is to test the relevant hypothesis of the population regression coefficient according to the results of sample estimation. The test method of is the same as that of, but the test of is more important because it shows the extent to which the independent variable affects the dependent variable Put forward the hypothesis. \( {H_{0}}: {β_{2}}={{β_{2}}^{*}} \) , \( {H_{1}}: {β_{2}}≠{{β_{2}}^{*}} \) . Determine the significance level. The magnitude of the significance level should be determined based on the magnitude of the potential cost of making the type of error. Generally, 0.05 is desirable. Calculate t value of regression coefficient: \( {t_{\hat{{β_{2}}}}}=\frac{\hat{{β_{2}}}-{{β_{2}}^{*}}}{{S_{\hat{{β_{2}}}}}} \) . The critical value of t test is determined by the significance level and degree of freedom. In this case, it should be noted that the null hypothesis and the alternative hypothesis are set in different ways, and the acceptance and rejection domains based on which they are judged are different. For example, two-sided t-test is performed for = 0 and ≠ 0. For = 0.9 and < 0.9, one-sided t-test was performed. In this regard, on the occasion of two-sided test, the critical values determined by referring to the T-distribution table based on and DF are () and (); In the case of one-tailed test, the critical value determined is (). Make a judgment. If the absolute value of is greater than the absolute value of the critical value, the null hypothesis is rejected and the alternative hypothesis is accepted. Otherwise, the null hypothesis is accepted. P test can also be used to test the significance of regression coefficients. The first three steps are the same as the t-test, but after the t-value is calculated, it is not compared with the critical value of the t-distribution, but directly calculates the probability that the t-statistic with n-2 degrees of freedom is greater than or less than the p-value calculated according to the sample observation value. Then it is compared with the given significance level. If P is less than, the null hypothesis is rejected; otherwise, the null hypothesis is accepted.
3. Operation Procedure
1. Searching for data sets: Now statistician find the basic information data set of recent local outpatients from a region of China. The data set includes 170 patients with three variables: gender, age and work status;
2. Read the data set: the data results of relevant variables in the data set are finally read out through Python program editing;
3. Make charts and analyze data: Pearson's correlation coefficient is used to analyze the correlation between features. Read and understand the data. Use Pandas Library to import data and learn about the structure of the data. Then the data is visualized, Seaborn is used to visualize the data, and all variables are paired to select the most representative variables for data analysis and get the results. Make heat charts, bar charts, etc., to help draw conclusions, and finally analyze the derived data charts.
4. Data prediction: Make regression analysis on multiple variables, get the relationship between data features, finally predict the value of the target variable, and predict the possible incidence of depression in the next few years.
5. Draw conclusions: According to the results of data and chart analysis, the change trend of the incidence of depression is directly related to the variables of the incidence of depression.
Descriptive statistical analysis:
|
|
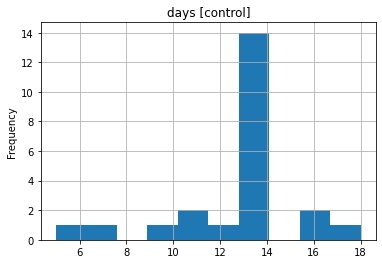
Figure 1. Bar graph of ages. | Figure 2. Bar graph of days. |
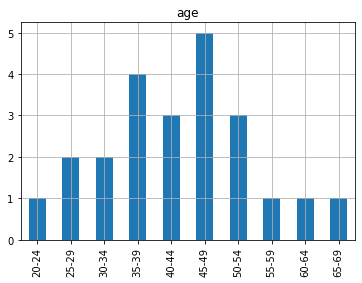
As can be seen from Fig.1, the statistical bar chart, the prevalence of the disease is highest among those aged 42-49, while the prevalence of the disease is second among those aged 35-39. Thus, it can be concluded that the population of the disease is more between middle-aged and young people. The lower prevalence was mostly among young people in their 20s and older people over 55.
Looking at the table of the onset cycle, it can be found that the onset cycle is generally about 2 weeks. It can last for a long time if it's severe 3 weeks to a month or more, shown in Fig.2
|
|
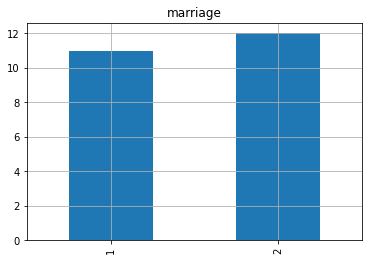
Figure 3. Bar graph of work. | Figure 4. Bar graph of marriage. |

Then statistician can see whether the variable of working or not, statistician can find that the incidence rate of working people is much higher than that of non-working people, shown in Fig.3
And then statistician can see that the effect of being married on incidence is not significant in this data set, the incidence of being married is comparable to that of not being married, shown in Fig 4.
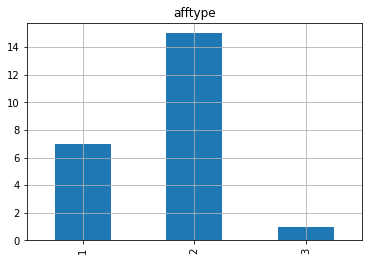
There are more people with monomial affective disorder in terms of the type of disorder, because it's also something that's more common in our lives, in our relationships with other people in our society. People with bipolar disorder and bipolar depression are less likely because they have better relationships with other people and are more likely to be smiling depressed, shown in Fig 5.
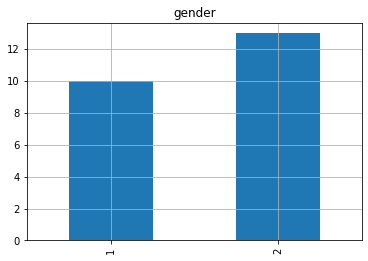
In terms of gender, the prevalence of women is higher than men, about 30% higher, which may be related to postpartum depression, menopause and so on, shown in Fig 6.
|
|
Figure 5. Bar graph of attype. | Figure 6. Bar graph of gender. |
|
Figure 7. Heat mat. |
|
Figure 8. Scatter plot. |
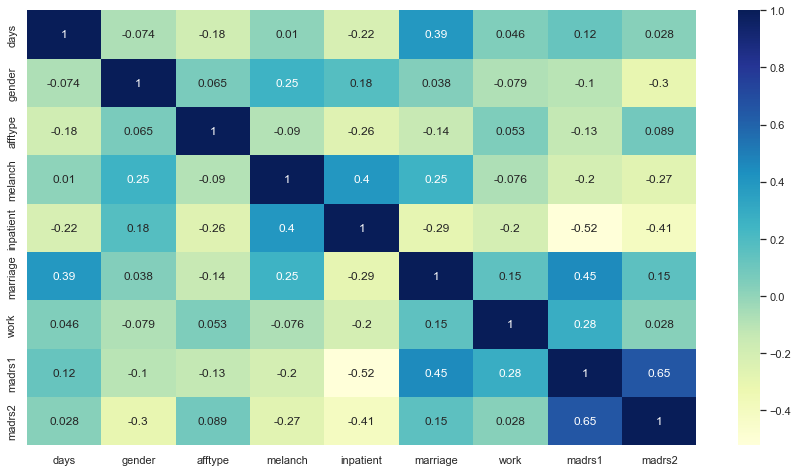

Finally, when statistician look at the heat chart and scatter plot in Fig 7, Fig 8 and Table 1, statistician can easily find that the most relevant data is activity status, and the second is marriage, which can be seen to have a great impact on people's prevalence. And finally when you look at the scatter plot the main thing that you can see is the cycle of the disease and statistician can see that the cycle of the disease is around 14 days.
Then linear regression analysis was performed on age and activity times in dataset "Depression.xls"
Table 1. Result.
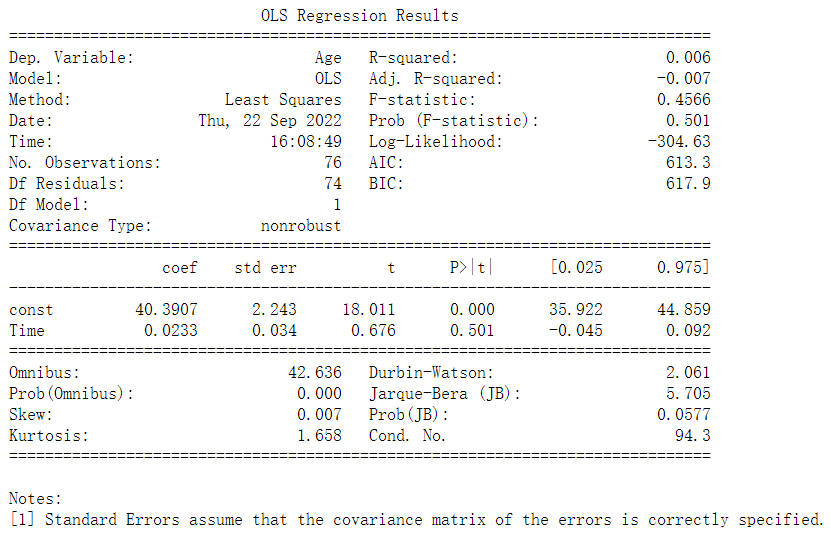
R2 is the coefficient of determination, which is the square of the number of monophasic relationships. After calculation, the value is 0.006, indicating that the degree of model fitting is very low.
4. Conclusion
Nowadays, scholars have been exploring the causes and mechanisms of depression. Existing studies show that depression is related to attention bias, negative thinking, coping and attribution styles, social support, gender and many other factors. However, there is no large sample of data survey to show that these factors can predict the occurrence of depression. Therefore, further investigation and research are needed. There are several ways to treat depression: first, stop self-criticism, second, follow your inner desire, and third, it is important to establish contact with others
References
[1]. Ida Kupcova, “Anxiety and Depression: What Do statistician Know of Neuropeptides?”
[2]. Lefan Liu, “The Impacts of Depression and Chronic Diseases on the Health of Older Adults in China: Evidence in a System Equations Framework” THE CHINESE ECONOMY 2022, VOL. 55, NO. 5, 343–368. https://doi.org/10.1080/10971475.2021.1996551
[3]. Jalal Moludi, “The effects of co-administration of probiotics and prebiotics on chronic inflammation, and depression symptoms in patients with coronary artery diseases: a randomized clinical trial” NUTRITIONAL NEUROSCIENCE 2022, VOL. 25, NO. 8, 1659–1668. https://doi.org/10.1080/1028415X.2021.1889451
[4]. Aruna Rose Mary Kapanee “Design and development of a training video for Accredited Social Health Activists (ASHAs) on brief psychological intervention for depression”
[5]. Angela J. Inglis “Mania and depression in the perinatal period among women with a history of major depressive disorders” Arch Womens Ment Health (2014) 17:137–143. DOI 10.1007/s00737-013-0408-1
[6]. Ghadeer S. Alenzi “Prevalence and associated factor of depression symptoms among female secondary school students in Buraydah City, Saudi Arabia”
[7]. Wita Oktaviana “Effectiveness of health education and infant therapeutic group therapy on baby aged 0-6 months to prevent stunting risk factors: Maternal depression” Journal of Public Health Research 2022; volume 11:2740
[8]. Tanti Apriliana “A contributing factor of maternal pregnancy depression in the occurrence of stunting on toddlers” Journal of Public Health Research 2022; volume 11:2738
[9]. Maryam Naeimi “Examining the moderating role of religiosity in the relationship between death anxiety and depression in Iranian community-dwelling older adults” MENTAL HEALTH, RELIGION & CULTURE 2022, VOL. 25, NO. 5, 492–503. https://doi.org/10.1080/13674676.2022.2041583.
[10]. Fiona Moir “Treatment of depression in the first primary care consultation: A qualitative study”.
Cite this article
Dong,X.;Ren,C.;Sun,Y. (2023). A Statistical Analysis of Depression. Theoretical and Natural Science,5,226-233.
Data availability
The datasets used and/or analyzed during the current study will be available from the authors upon reasonable request.
Disclaimer/Publisher's Note
The statements, opinions and data contained in all publications are solely those of the individual author(s) and contributor(s) and not of EWA Publishing and/or the editor(s). EWA Publishing and/or the editor(s) disclaim responsibility for any injury to people or property resulting from any ideas, methods, instructions or products referred to in the content.
About volume
Volume title: Proceedings of the 2nd International Conference on Computing Innovation and Applied Physics (CONF-CIAP 2023)
© 2024 by the author(s). Licensee EWA Publishing, Oxford, UK. This article is an open access article distributed under the terms and
conditions of the Creative Commons Attribution (CC BY) license. Authors who
publish this series agree to the following terms:
1. Authors retain copyright and grant the series right of first publication with the work simultaneously licensed under a Creative Commons
Attribution License that allows others to share the work with an acknowledgment of the work's authorship and initial publication in this
series.
2. Authors are able to enter into separate, additional contractual arrangements for the non-exclusive distribution of the series's published
version of the work (e.g., post it to an institutional repository or publish it in a book), with an acknowledgment of its initial
publication in this series.
3. Authors are permitted and encouraged to post their work online (e.g., in institutional repositories or on their website) prior to and
during the submission process, as it can lead to productive exchanges, as well as earlier and greater citation of published work (See
Open access policy for details).
References
[1]. Ida Kupcova, “Anxiety and Depression: What Do statistician Know of Neuropeptides?”
[2]. Lefan Liu, “The Impacts of Depression and Chronic Diseases on the Health of Older Adults in China: Evidence in a System Equations Framework” THE CHINESE ECONOMY 2022, VOL. 55, NO. 5, 343–368. https://doi.org/10.1080/10971475.2021.1996551
[3]. Jalal Moludi, “The effects of co-administration of probiotics and prebiotics on chronic inflammation, and depression symptoms in patients with coronary artery diseases: a randomized clinical trial” NUTRITIONAL NEUROSCIENCE 2022, VOL. 25, NO. 8, 1659–1668. https://doi.org/10.1080/1028415X.2021.1889451
[4]. Aruna Rose Mary Kapanee “Design and development of a training video for Accredited Social Health Activists (ASHAs) on brief psychological intervention for depression”
[5]. Angela J. Inglis “Mania and depression in the perinatal period among women with a history of major depressive disorders” Arch Womens Ment Health (2014) 17:137–143. DOI 10.1007/s00737-013-0408-1
[6]. Ghadeer S. Alenzi “Prevalence and associated factor of depression symptoms among female secondary school students in Buraydah City, Saudi Arabia”
[7]. Wita Oktaviana “Effectiveness of health education and infant therapeutic group therapy on baby aged 0-6 months to prevent stunting risk factors: Maternal depression” Journal of Public Health Research 2022; volume 11:2740
[8]. Tanti Apriliana “A contributing factor of maternal pregnancy depression in the occurrence of stunting on toddlers” Journal of Public Health Research 2022; volume 11:2738
[9]. Maryam Naeimi “Examining the moderating role of religiosity in the relationship between death anxiety and depression in Iranian community-dwelling older adults” MENTAL HEALTH, RELIGION & CULTURE 2022, VOL. 25, NO. 5, 492–503. https://doi.org/10.1080/13674676.2022.2041583.
[10]. Fiona Moir “Treatment of depression in the first primary care consultation: A qualitative study”.