


1. Introduction
1.1. Background
In the modern financial market, risk assessment and portfolio optimization have always been a hot research direction, aiming to quantify and predict various risks that may be faced in the financial market through various methods, technologies and models, and obtain the optimal investment strategy through reasonable asset allocation, the balance between maximizing returns and minimizing risks. With the increasing uncertainty of the global economy and the complexity of the financial markets, how to evaluate and manage risks has become a key task for investors and financial institutions when making investment decisions. Risk assessment not only helps investors understand potential losses, but also enables them to make more rational and scientific decisions in a complex market environment. Many factors in the financial markets, such as economic fluctuations, changes in market structure, political risk, liquidity risk, credit risk, etc., can have a significant impact on the performance of a portfolio. Therefore, risk assessment and management models play a vital role in helping investors cope with these unforeseen market changes.
The global financial market is facing unprecedented risks due to the pandemic, and the importance of financial risk assessment is all the more prominent in this context. Mathematical models provide systematic and quantitative risk analysis tools to help decision makers understand, manage and deal with complex market environments. Optimize asset allocation, reduce portfolio risk and maximize returns under multiple risk scenarios. For example, Markowitz portfolio theory [1] provides a scientific framework for asset allocation. It helps investors balance risks and returns among different assets by means of mean-variance optimization, so as to select the optimal asset portfolio under a certain risk level. This theory not only provides theoretical guidance for individual investors, but also provides theoretical basis for financial institutions to design investment products and fund portfolios. In addition, others such as VaR (value at risk) model, risk parity model, etc., all play an important role in asset management and risk control.
To sum up, risk assessment and portfolio optimization of financial market is an important research direction in the financial discipline, which helps investors make more scientific and efficient decisions in the ever-changing market environment by using multi-disciplinary knowledge such as modern mathematics, statistics and computer science. Especially when the global economy is facing high uncertainties and risks, accurate risk assessment and scientific asset allocation are particularly important. Through these advanced models and tools, investors can better cope with various market fluctuations and economic crises, maximize returns, reduce risks, and achieve long-term financial goals.
1.2. Research purpose
This study aims to combine Monte Carlo simulation and Markowitz portfolio theory to explore how to quantify financial risks and optimize asset allocation through mathematical models, so as to provide scientific and reasonable investment decision support for investors and financial institutions. Specifically, the variance and expected rate of return models in Markowitz theory are used to quantify the risks and returns of asset portfolios, and the correlation between assets is described by covariance matrix to estimate the overall risk of portfolios. On this basis, combined with the random sampling mechanism of Monte Carlo simulation, the future market fluctuations are simulated to provide a more comprehensive and flexible risk prediction. By analyzing the performance of different asset portfolios at a given level of risk, the study optimizes asset allocation, aiming to maximize the expected return while minimizing the overall risk and helping investors make more scientific and effective decisions. In addition, this study will also introduce Monte Carlo simulation to make up for the limitations of traditional models in dealing with market uncertainty and complexity, so as to provide financial institutions with more dynamic and accurate risk management solutions. Finally, the research will provide an innovative solution for asset management and risk control in the financial market, and help investors achieve the optimal balance between risk and return in the changeable market environment.
2. Literature review
In the securities market, investors' pursuit of returns is usually accompanied by risks, so portfolio investment has become a key strategy to reduce non-systematic risks and maximize returns in personal finance. In 1952, Markowitz proposed the classic mean-variance (MV) model, which laid the foundation for modern portfolio theory. For this reason, many studies have applied Markowitz portfolio theory to the empirical analysis of financial products. Chen Junlan [2] pointed out that investors should use an effective portfolio model to quantify risks and expected returns when constructing investment portfolios, so as to realize asset appreciation. Zeng Yingmiao et al. [3] show that Markowitz model can effectively optimize investment portfolio through the analysis of stock return rate and covariance matrix. Wang Shuyan et al. [4] applied this theory to the proportional allocation of risky assets and risk-free assets, providing more practical suggestions for household asset allocation. However, some scholars have raised objections to the application of this model. Wu Kunsheng [5] believes that although Markowitz model has certain applicability in the A-share market, its effectiveness is limited by the hypothesis of efficient market, no transaction costs and idealized investors, and its practical application may face significant limitations. Jiang Qingfang et al. [6] argue that the way in which variance is used to measure risk in this model is not rigorous enough and the distinction between economic and mathematical concepts is ignored. In spite of this, Li Yang et al. [7] believe that despite some shortcomings of Markowitz model, it can still be effectively applied in China's securities market after proper adjustment. In addition, with the progress of quantitative analysis methods, VaR (value at risk) model [8], risk parity model and other models have been gradually applied to the field of asset allocation, which to some extent make up for the shortcomings of Markowitz model in dealing with non-linear risks and market uncertainties, and provide investors with more comprehensive risk management tools. Therefore, despite the limitations of Markowitz's portfolio theory, it is still an important theoretical basis for asset allocation optimization by combining with other models, and provides strong support for risk management in financial markets.
3. Investment Strategies Combining Markowitz Theory and Monte Carlo Simulation
3.1. Assumptions of the model
1. Investor rationality assumption: It is assumed that investors are rational in the decision-making process, aiming to maximize the expected return while minimizing the risk of the investment portfolio.
2. Efficient market hypothesis: Assume that the market is efficient, all available information has been reflected in asset prices, asset returns are subject to normal distribution, and there is no arbitrage opportunity, and investors cannot obtain excess returns through information asymmetry.
3. No transaction costs and market friction: Assuming that there is no transaction costs, taxes, commissions and other market friction, investors can buy and sell assets at market prices at any time, and the number of transactions is not limited.
4. The covariance matrix is known and stable: It is assumed that the covariance matrix between assets remains unchanged during the analysis of the model, and the matrix can represent the asset correlation of the future market through the estimation of the assumed data.
5. Single-period model hypothesis: This model is a single-period optimization model, assuming that investors only pay attention to the returns and risks in one investment cycle, ignoring the time factors and long-term effects of multi-period investment.
3.2. Mean-variance (MV) modeling
3.2.1. Expected return on the portfolio
Suppose there are n assets in which an investor wants to allocate a weight in order to achieve the desired investment goal. Set the expected return of asset i to E[Ri] and its weight in the mix to wi (meet \( \sum _{i=1}^{n} {w_{i}}=1 \) ). Then, the expected return E[Rp] of the portfolio is the weighted average of the expected return of each asset, namely:
\( E[{R_{P}}]=\sum _{i=1}^{n} {w_{i}}\cdot E[{R_{i}}] \) (1)
Where E[RP] represents the expected return of the portfolio, wi represents the weight of the i th asset, and E[Ri] represents the expected return of the i th asset.
3.2.2. Portfolio risk (standard deviation)
The risk of a portfolio is determined by the risk of individual assets and the correlation between assets. The risk of assets is represented by standard deviation, and the correlation between assets is measured by covariance matrix. Assuming that the covariance between asset i and asset j is Cov(Ri,Rj) and the risk (standard deviation) of asset i is 𝜎𝑖, the risk (standard deviation) of the portfolio can be calculated by the following formula:
\( {σ_{P}}=\sqrt[]{\sum _{i=1}^{n} \sum _{j=1}^{n} {w_{i}}{w_{j}}Cov({R_{i}},{R_{j}})} \) (2)
Where the covariance matrix Cov(Ri,Rj) represents the covariance between asset i and asset j. The risk of a portfolio is the square root of the sum of the weight of each pair of assets multiplied by their covariance.
3.2.3. covariance matrix
The covariance matrix is an n×n symmetric matrix with elements Cov(Ri,Rj) representing the covariance of asset i and asset j. The covariance matrix reflects the relationship between returns of different assets, and the covariance matrix C can be expressed as:
\( C=[\begin{matrix}Cov({R_{1}},{R_{1}}) & Cov({R_{1}},{R_{2}}) & ⋯ & Cov({R_{1}},{R_{n}}) \\ Cov({R_{2}},{R_{1}}) & Cov({R_{2}},{R_{2}}) & ⋯ & Cov({R_{2}},{R_{n}}) \\ ⋮ & ⋮ & ⋱ & ⋮ \\ Cov({R_{n}},{R_{1}}) & Cov({R_{n}},{R_{2}}) & ⋯ & Cov({R_{n}},{R_{n}}) \\ \end{matrix}] \) (3)
Where, the diagonal element Cov (Ri, Ri) is the variance of asset i (i.e. the squared risk); The non-diagonal element Cov (Ri, Rj) is the covariance between asset i and asset j, describing the relationship between the returns of these two assets.
At this point, the problem is transformed into the expected return of a given combination such that the combination variance is minimized.
This paper assumes the closing data of four stocks A, B, C and D in each trading day within a year for analysis.
3.3. Model solving using Monte Carlo
3.3.1. minimum risk
Correlation coefficient [9] is a statistical index to measure the strength of the relationship between stocks, which can reflect the degree of correlation between two stocks. By calculating the correlation coefficient of the four stocks with SPSS software, the correlation data between the stocks can be obtained. In the portfolio model, the correlation coefficient between stocks directly affects the variance of the portfolio. If two stocks have a smaller correlation coefficient, their portfolio variance or standard deviation will be smaller, which means that the portfolio is more diversified. The symbol of correlation coefficient can qualitatively describe the relationship between two stocks: when the correlation coefficient is positive, it means that the two stocks are positively correlated; When the correlation coefficient is negative, it means negative correlation. Table 1 shows the correlation coefficients of A, B, C and D.
Table 1: shows the correlation coefficients for A, B, C and D.
stock (market) | A | B | C | D |
A | 1 | 0.634 | -0.511 | -0.192 |
B | 0.634 | 1 | 0.041 | 0.049 |
C | -0.511 | 0.041 | 1 | 0.114 |
D | -0.192 | 0.049 | 0.114 | 1 |
According to the data in Table 1, among the four stocks selected, B and D are positively correlated with C, while A is negatively correlated with C. In terms of the absolute value of correlation coefficient, the correlation coefficient of ZK and PA is large, indicating that the investment diversification effect of these two stocks is weak. However, the correlation coefficient of B and C is small in absolute value, which indicates that the investment diversification effect of these two stocks is strong. The variance and standard deviation of the four stocks were obtained by using the closing data and SPSS. The specific results are shown in Table 2.
Table 2: Variance and standard deviation of the four stocks
stock (market) | variance (statistics) | standard deviation |
A | 65.485 | 8.72393 |
B | 7.223 | 2.63518 |
C | 4.745 | 1.37387 |
D | 7.645 | 2.72192 |
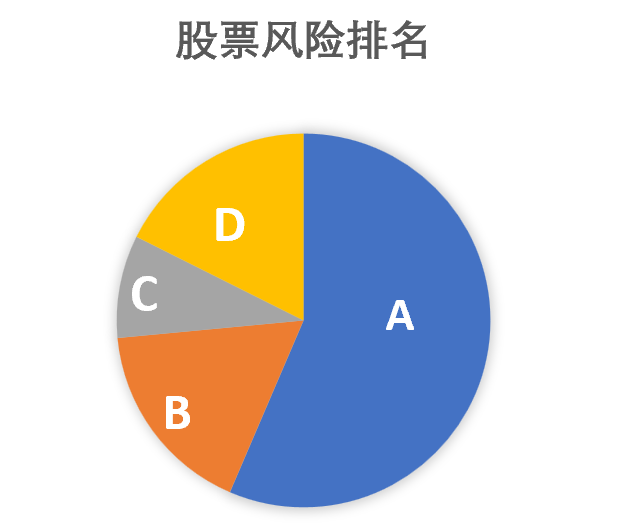
Figure 1: Risk ranking of the four stocks
According to the above discussion, the larger the standard deviation, the higher the investment risk of the stock, the greater the return fluctuation, and the worse the return stability of the investor. The standard deviation of A, 8.72393, is the highest among the four stocks, so its investment risk is the greatest, its income fluctuates significantly, and its stability is poor. C's standard deviation of 1.37387 is the lowest among the four stocks, which means that its investment risk is the least, the income fluctuation is less, and the stability is better. The standard deviations of B and D are similar, indicating little difference in risk between the two.
According to standard deviation, the risk ranking of 4 stocks can be obtained,as shown in Figure 1: A>D>B>C
The covariance between the four stocks was calculated by SPSS software. The greater the covariance, the stronger the correlation between the two stocks, and the corresponding increase in investment risk. When the covariance is negative, it means that when one stock makes a profit, the other stock loses. When the covariance is negative, it means that both stocks either make a profit or lose money at the same time. When the covariance is zero, there is no correlation between the two stocks. The covariance between the four stocks is shown in Table 3.
Table 3: Covariance between the 4 stocks
stock (market) | A | B | C | D |
A | 76.239 | 16.382 | -7.731 | -9.198 |
B | 16.382 | 9.278 | 0.316 | 0.715 |
C | -7.731 | 0.316 | 4.218 | 2.328 |
D | -9.198 | 0.715 | 2.328 | 9.821 |
To sum up, if A is profitable on that day, there are three situations: first, B is profitable, C and D are loss-making; In case 2, B, C, and D are all profitable; In the third category, B, C and D all lose money. Suppose A loses money on that day, then there are three situations: first, B loses money, C and D make money; In the second, B, C and D all lose money; Third, B, C, and D are all profitable.
3.3.2. maximum profit
Calculate the expected rate of return on the asset portfolio
The price2ret function is used to convert asset prices into asset returns for the four stocks.
From the hypothetical price data, calculate the daily return, monthly return, etc. for each asset. This is done through the following formula:
\( {r_{t}}=\frac{{P_{t}}-{P_{t-1}}}{{P_{t-1}}} \) (4)
where rt is the return in period t, Pt is the price in period t, and Pt-1 is the price in the previous period.
Table 4: earnings yield (finance)
stock (market) | earnings yield (finance) |
A | 8% |
B | 10% |
C | 6% |
D | 7% |
3.3.3. Asset portfolio optimization
Different portfolios are constructed based on the weights of the assets. Each portfolio consists of 4 stocks with different weights. The sum of the weights should be equal to 1. These weights are randomly generated through Monte Carlo simulation.
Portfolio Expected Return:
\( E[{R_{P}}]=\sum _{i=1}^{n} {w_{i}}\cdot E[{R_{i}}] \) (5)
Portfolio risk (standard deviation):
\( σ_{P}^{2}=\sum _{i=1}^{n} \sum _{j=1}^{n} {w_{i}}{w_{j}}\cdot {C_{ij}} \) (6)
where Cij is the covariance between asset i and asset j and wi is the weight of the asset.
The expected return and risk of each portfolio is calculated by randomly generating multiple sets of different asset weights. Next, 10,000 Monte Carlo simulations are performed to calculate the expected return and risk (standard deviation) and Sharpe ratio for each portfolio and find the portfolio with the largest Sharpe ratio. The results are shown below:
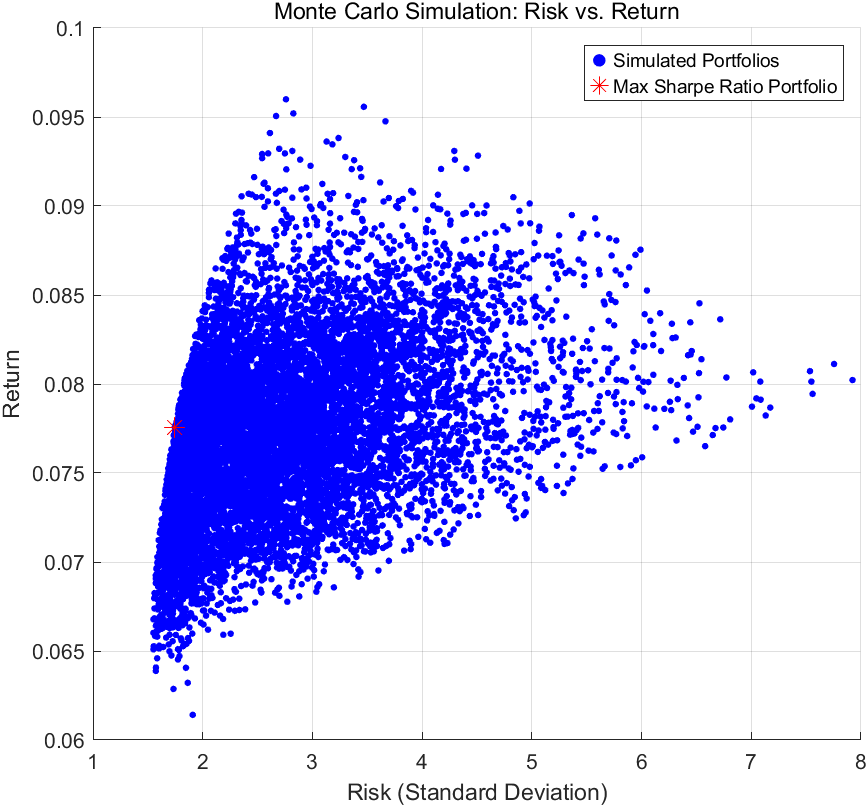
Figure 2: Simulation result
The trend in the figure 2 shows that as the risk (standard deviation) increases, the expected return tends to increase. This indicates that at higher levels of risk, there is an opportunity for higher returns. The red asterisk in the chart indicates the portfolio with the largest Sharpe ratio. This portfolio is located in the lower left of the chart, meaning that it offers relatively high returns at a lower level of risk,specific investment weightings are shown in table 5 below:
Maximum Sharpe ratio: 0.0776
Risk: 1.7462
Table 5: Optimal investment weighting
stock (market) | Optimal investment weighting |
A | 0.0224 |
B | 0.3883 |
C | 0.4302 |
D | 0.1591 |
4. Conclusion
4.1. Concluding analysis
This study provides an in-depth discussion and simulation analysis of risk assessment and asset allocation in financial markets by combining the Markowitz portfolio optimization model and Monte Carlo simulation. By using modern mathematical tools, we quantify the relationship between risk and return in the financial market and optimize the asset portfolio to achieve a balance between risk and return. During the simulation validation process, we found that generating different market scenarios through Monte Carlo simulation can effectively assess the performance of different asset portfolios under different market conditions, thus helping investors to make rational decisions in an uncertain market environment.
However, despite the theoretical foundation and application value of the Markowitz portfolio model, its assumptions (e.g., efficient market assumption, no transaction costs, and idealized investors) make the model have certain limitations in practical applications. Through sensitivity analysis, we further reveal the impact of changes in different parameters (e.g., covariance matrix, expected return, risk aversion coefficient, etc.) on the portfolio optimization results, which helps us to identify the key factors affecting the accuracy of the model and provides a basis for future model improvement.
Although this study faces challenges such as data availability and changing market conditions, the adaptability and robustness of the model can be enhanced by rationally adjusting the model assumptions and parameters, and combining with other risk management tools (e.g., VaR model, risk parity model, etc.).
4.2. future outlook
4.2.1. Model Improvement and Extension
Although the Markowitz portfolio model performs well in many settings, its limitations are still evident when dealing with complex market scenarios. Future research could explore incorporating other optimization methods, such as risk parity models and dynamic asset allocation, to improve the model's performance in nonlinear market environments. In addition, with the rise of behavioral finance, introducing investors' psychological factors (e.g., overconfidence, herd effect, etc.) into portfolio optimization models will also be a direction for future research.
4.2.2. Introduce more market factors
Most of the current models assume that markets are efficient and do not take into account factors such as transaction costs and liquidity. Future research should pay more attention to the impact of these realistic factors, especially the impact of market microstructure (e.g., liquidity, transaction costs, market depth, etc.) on portfolio performance. By introducing these factors, the applicability and accuracy of the model will be significantly improved.
4.2.3. Applications of Big Data and Artificial Intelligence
With the rapid development of big data technology and artificial intelligence (AI), future research can combine machine learning and deep learning algorithms, using a large amount of historical data, real-time market data, as well as macroeconomic data to conduct more accurate risk assessment and asset allocation optimization. AI is able to tap into the implied laws in the market, predict asset price fluctuations, and provide more intelligent decision support for asset allocation.
4.2.4. Portfolio optimization across multiple asset classes
In future research, the scope of asset allocation can be further expanded to consider multi-asset class portfolio optimization including alternative assets (e.g., real estate, commodities, cryptocurrencies, etc.). The risk and return characteristics of different asset classes vary widely, and a reasonable asset allocation will help diversify risk and enhance overall portfolio performance.
In conclusion, risk assessment and asset allocation optimization in the financial market is a complex and dynamic process, and future research will further explore new risk management tools and methods in depth, enhance the practical application of the model, and provide investors with more scientific and intelligent investment decision support. In a market environment of increasing uncertainty, optimizing investment portfolios, reducing risks and maximizing returns will be an important research direction in the field of finance. References
References
[1]. Markowitz H.M. Portfolio Selection[J]. journal of Finance.1952(7)
[2]. Chen, Junlan. Empirical research on stock portfolio based on Markowitz model []. Brand Research, 2018(2):146-147
[3]. Zeng Yingmiao, Zhang Jun, Zhang Qing, An empirical study of Markowitz model in optimal portfolio selection in stock market [Shan 1. Journal of Xiangtan Normal College (Social Science Edition), 2009, 31(4):88-91.
[4]. WANG Shuyan, FENG Changli, ZHENG Canchang, et al. Application of multi-objective modeling in solving the optimal solution of investment portfolio[J]. Finance and Economics, 2014(24):54-56.
[5]. Wu, Kun-Sheng. Analysis of the application of Markowitz model in A-share market[J]. New Economy, 2015(26):50.
[6]. Jiang Qingfang, Chen Fangzheng. Economists should be careful in using mathematical methods: a review of H.M. Markowitz's theory and model of portfolio selection (J1. Journal of Tongji University (Social Science Edition), 1999(4):18-24.
[7]. Li Yang, Yu Lixia. Optimal portfolio analysis based on Markowitz theory[J]. Finance and Accounting Monthly, 2013(22):53-55
[8]. Gu Zouwei,Peng Yueke,Shen Min. VaR estimation of treasury bond and stock portfolio based on Prophet-DCC-GARCH portfolio model[J]. Sino-Arab Science and Technology Forum (in Chinese and English),2024,(11):60-66.
[9]. Deng Zhenzhou,Zhao Xu,Yi Jinmei. Application of correlation coefficient matrix-nonlinear reversible network model to lutetium oxide price prediction[J]. Journal of Mudanjiang Normal College (Natural Science Edition),2024,(03):1-5.DOI:10.13815/j.cnki.jmtc(ns).2024.03.014.
Cite this article
Sun,R. (2025). Research on Financial Risk Assessment and Asset Allocation Optimization Based on Monte Carlo Simulation and Markowitz Theory. Theoretical and Natural Science,101,99-107.
Data availability
The datasets used and/or analyzed during the current study will be available from the authors upon reasonable request.
Disclaimer/Publisher's Note
The statements, opinions and data contained in all publications are solely those of the individual author(s) and contributor(s) and not of EWA Publishing and/or the editor(s). EWA Publishing and/or the editor(s) disclaim responsibility for any injury to people or property resulting from any ideas, methods, instructions or products referred to in the content.
About volume
Volume title: Proceedings of CONF-MPCS 2025 Symposium: Mastering Optimization: Strategies for Maximum Efficiency
© 2024 by the author(s). Licensee EWA Publishing, Oxford, UK. This article is an open access article distributed under the terms and
conditions of the Creative Commons Attribution (CC BY) license. Authors who
publish this series agree to the following terms:
1. Authors retain copyright and grant the series right of first publication with the work simultaneously licensed under a Creative Commons
Attribution License that allows others to share the work with an acknowledgment of the work's authorship and initial publication in this
series.
2. Authors are able to enter into separate, additional contractual arrangements for the non-exclusive distribution of the series's published
version of the work (e.g., post it to an institutional repository or publish it in a book), with an acknowledgment of its initial
publication in this series.
3. Authors are permitted and encouraged to post their work online (e.g., in institutional repositories or on their website) prior to and
during the submission process, as it can lead to productive exchanges, as well as earlier and greater citation of published work (See
Open access policy for details).
References
[1]. Markowitz H.M. Portfolio Selection[J]. journal of Finance.1952(7)
[2]. Chen, Junlan. Empirical research on stock portfolio based on Markowitz model []. Brand Research, 2018(2):146-147
[3]. Zeng Yingmiao, Zhang Jun, Zhang Qing, An empirical study of Markowitz model in optimal portfolio selection in stock market [Shan 1. Journal of Xiangtan Normal College (Social Science Edition), 2009, 31(4):88-91.
[4]. WANG Shuyan, FENG Changli, ZHENG Canchang, et al. Application of multi-objective modeling in solving the optimal solution of investment portfolio[J]. Finance and Economics, 2014(24):54-56.
[5]. Wu, Kun-Sheng. Analysis of the application of Markowitz model in A-share market[J]. New Economy, 2015(26):50.
[6]. Jiang Qingfang, Chen Fangzheng. Economists should be careful in using mathematical methods: a review of H.M. Markowitz's theory and model of portfolio selection (J1. Journal of Tongji University (Social Science Edition), 1999(4):18-24.
[7]. Li Yang, Yu Lixia. Optimal portfolio analysis based on Markowitz theory[J]. Finance and Accounting Monthly, 2013(22):53-55
[8]. Gu Zouwei,Peng Yueke,Shen Min. VaR estimation of treasury bond and stock portfolio based on Prophet-DCC-GARCH portfolio model[J]. Sino-Arab Science and Technology Forum (in Chinese and English),2024,(11):60-66.
[9]. Deng Zhenzhou,Zhao Xu,Yi Jinmei. Application of correlation coefficient matrix-nonlinear reversible network model to lutetium oxide price prediction[J]. Journal of Mudanjiang Normal College (Natural Science Edition),2024,(03):1-5.DOI:10.13815/j.cnki.jmtc(ns).2024.03.014.