


1. Introduction
With the rapid development of the electric vehicle (EV) market, price has become one of the important factors in consumers' car purchase decisions. The price of electric vehicles is not only affected by the cost of raw materials, technological innovation and production scale, but also closely related to policy support, market demand and global economic situation. The exhaust gas emissions emitted by fuel cars, such as carbon monoxide or sulfur dioxide, are one of the major causes of air pollution worldwide [1]. Some researchers discovered that the EV will not produce exhaust gas. According to Varma’s research, EVs hold a potential advantage in reducing greenhouse gas emissions, which means that EVs will not produce any tailpipe emissions, and they are generally more energy-efficient than conventional vehicles [2, 3]. Moreover, the global EV market is a newly founded market with great potential. In 2017, the global sale of EVs passed one million units. And this market is growing by more than 40% a year from 2010 to 2017 [4].
China and Europe have overtaken the global EV market since 2015. And in the following years, China became the global leader in the EV market growth, except for 2020. Yet in 2021 China overtook the EV market, and its global sales were beyond 3 million [5]. Over the past ten years, the renewable energy market in China has grown exceptionally, spurred on by government investment, policy support, and technological innovations. Solar, wind, hydro, and even biomass energy sectors have made remarkable progress in the country, setting up the country as a global leader in renewable energy. Among all, the renewable energy capacity in China is the largest as of 2023, and its solar and wind energy departments lead the country. China’s pledge to be carbon neutral by 2060 has not only been accelerating the adoption of renewable energy technology even faster but has also set itself as one of the most critical actors in the global energy transition [6].
That is near a third of the world’s total renewable energy capacity, which hit 1,000 gigawatts (GW) in China this year. This is especially true in the solar photovoltaic (PV) sector, where China produces over 70 percent of the world’s solar panels and has the most installed solar capacity. The rapid growth of this sector has been fostered by government incentives such as large-scale subsidy programs and tax breaks [7]. China's wind energy sector, too, has undergone rapid growth, making such capital the world’s home to almost half of installed wind power capacity. In’ China’s case, the scale of investment in and the goals of onshore and offshore wind farms, especially in Inner Mongolia, serve as an example [8].
China has a renewable energy market unlike any other, thanks to its favorable policy environment that has been attracting both domestic and international investments. Subsidies, green finance policies, and ambitious energy targets have all placed a high priority on renewable energy development by the Chinese government. Moreover, the Three Gorges Hydropower Station and enormous wind farms are large-scale projects that provide substantial energy supply for the nation and demonstrate China’s leadership in renewable energy infrastructure [9]. Simultaneously, new energy storage innovations are also supporting growth in renewable sources like solar and wind that do not exist at driven and reliable rates.
In the existing literature, the emissions of electric vehicles (EV) and traditional fuel vehicles have been deeply studied. Twigg discussed the progress and future challenges of automobile emission control and analyzed the effects of various emission control technologies. He used the catalyst model to evaluate the effect of emission control technology, and the research results showed that the technical progress of catalyst slowed down the emissions of traditional fuel vehicles, but the emergence of electric vehicles provided a more feasible solution for emission reduction [1]. In addition, according to the report of the World Health Organization, the impact of automobile emissions on health has also received more attention. Especially in areas with poor air quality [2].
Aiming at the research of electric vehicle market, Varma et al. compared and analyzed the greenhouse gas emission differences between traditional fuel vehicles and electric vehicles and evaluated the environmental impacts of different energy types through life cycle analysis (LCA) model. This study provides a quantitative evaluation of the environmental impact of electric vehicles and emphasizes the core role of battery production and power sources [10]. Hertzke et al. studied the current situation and future trend of the global electric vehicle market through the market analysis model and revealed that the rapid growth of the global electric vehicle market mainly depends on policy support and technological innovation [4]. Researchers used the open data analysis method to evaluate the sales volatility and forecasting ability of the electric vehicle market [5]. This method dynamically evaluates the market development of electric vehicles through big data analysis and provides an effective tool for market forecasting. Taking China market as an example, Zou et al. based on the development path of the future power market with high renewable energy penetration, explored the changing trend of the power market under different energy structures by using an empirical analysis model [6]. These studies not only play a guiding role in the popularization of electric vehicles but also provide data support for sustainable energy development.
Based on these research results, it can be found that emission control, market forecast, policy support and the evolution of power market of electric vehicles are the key directions of current research. In this paper, the main focus is on the price analysis of the EV in the recent market. And this paper will further build different models based on the reliable dataset.
2. Methods
2.1. Data description
The data on price and other factors of different electric vehicles is chosen in this study. The dataset is available on the Kaggle platform website, and it received full marks in usability, completability, creditability and compatibility calculated by the website, which means all the data is reliable. The dataset contains in total 103 types of EV manufactured by different brands and 13 variables
2.2. Variable selection
This paper analyzed 100 types of EV and 12 variables. And the dependent variable is set to be the price of the EV in Euro. Table 1 displays all the variables used in this analysis and illustrates the exact meaning of each variable. The left-hand side shows the name of the variable, while the right-hand side shows the explanation of the variable. For instance, the “Brand” is the name of the first variable, while the “Manufacturer of the EV” is the exact meaning of the variable “Brand” (Table 1).
Table 1: Variable explanation
Variable names | Exact meaning of variables |
Brand | Manufacturer of the EV |
AccelSec | Time in second that takes for the EV to accelerate from 0 to 100km/h |
TopSpeed_KmH | The maximum speed of the EV in km/h |
Range_Km | The maximum distance that the EV can travel purely on its electric charge. |
Efficiency_WhKm | Fuel efficiency of the EV in Wh/km |
FastCharge_KmH | The charging speed of the EV in km/h |
RapidCharge | Binary “yes” or “no” for if the EV has the rapid charge function |
PowerTrain | The type of wheel drive of the EV. |
PlugType | The type of plug of the EV |
BodyStyle | Basic size or style of the EV |
Segment | The market segment of the EV |
Seats | The numbers of seats that the EV contains |
In those variables, “AccelSec”, “TopSpeed_KmH”, “Range_Km”, “Efficiency_WhKm”, “FastCharge_KmH” and “Seats” are numerical variables, while “Brand”, “RapidCharge”, “PowerTrain”, “PlugType”, “BodyStyle” and “Segment” are categorical variables.
2.3. Method introduction
This paper used multivariable linear regression to interpret the relationship between multiple independent variables and the dependent variable: price of the EV. Specifically, all the variables are proved to have a strong correlation with the price of the EV used to build the multivariable linear regression model. Besides, all the variables are divided into two categories: numerical variables and categorical variables, and variables appeared with that order. Plus, the unit of all numerical variables are eliminated for the sake of standardizing the data.
3. Results and discussion
3.1. Descriptive analysis
Figure 1 is the scatter plot showing the relationships between all six numerical variables and dependent variables. Based on the scatter plots, it can be observed that the “Accel”, “TopSpeed”, “Range”, “Efficiency” and “FastCharge” have linear relations with the price of the EV, but the “Seats” variable is not. the “TopSpeed”, “Range”, “Efficiency” and “FastCharge” exhibit a positive impact on the price of the EV, while the “Accel” shows a negative impact on it.
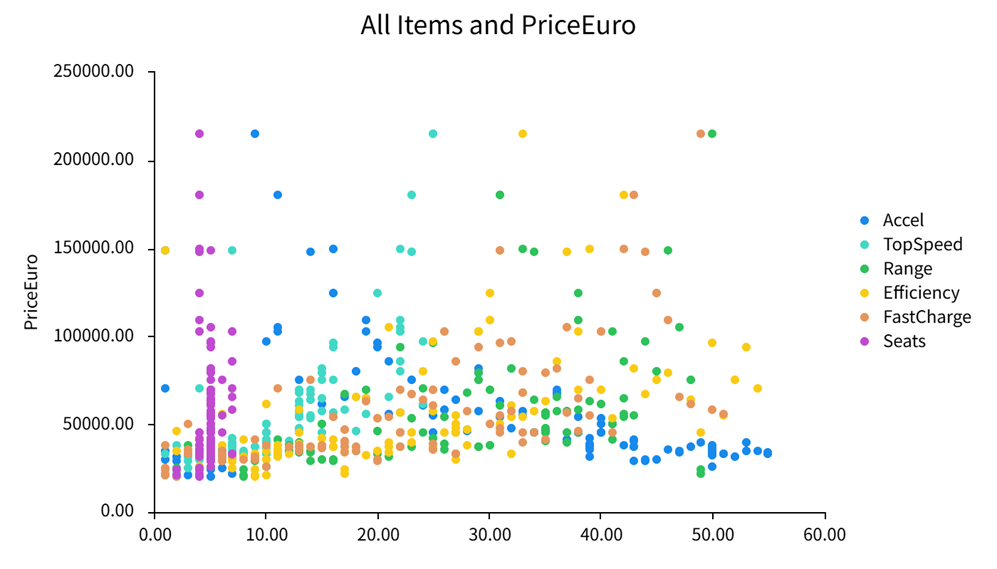
Figure 1: Scatter plot of numerical variables with the price of EV
Figure 2 shows the correlation of the numerical variables and the price of the EV. It can indicate that “TopSpeed”, “Range”, “Efficiency” and “Fast Charge” have a significant positive correlation with the price of the EV, because the Pearson Coefficient of those variables are greater than 0.5; “Accel” Variable, on the other hand, reveals a negative Pearson Coefficient value, meaning that “Accel” has a significant negative correlation with the price of the EV; “Seats” variable displays a Pearson Coefficient of 0.02. However, considering that the “Seats” variable is not linear to the dependent variable, this paper used the Spearman Coefficient to measure its correlation with the price of the EV. And it shows a coefficient of 0.2, which means that it has a positive correlation with the dependent variable.
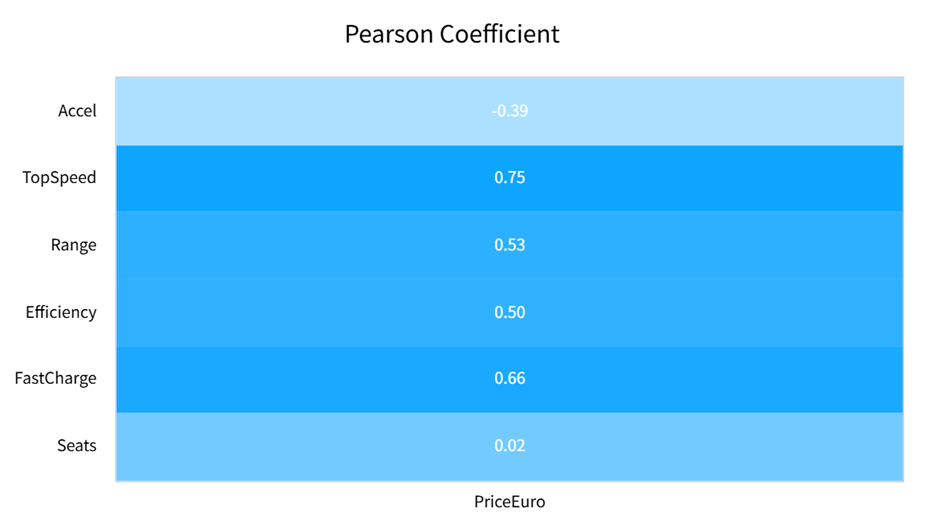
Figure 2: Numerical variables correlation
3.2. Model results
Table 2 and 3 show part of one-way ANOVA tests of categorical variables. “Segment”, “BodyStyle”, “PowerTrain”, “RapidCharge” have a p value less than 0.05, which means they are valid, exhibiting significant difference for the price of the EV in different groups. Yet the p value for “PlugType” is too high, meaning that it is not significant for the price of the EV. Notably, the “Brands” variable contains too many brands within one variable, causing the failure of using One-way ANOVA test to analyze it.
Table 2: Part of one-way ANOVA tests for RapidCharge
RapidCharge (Mean ± S.D.) | F | p Value | ||
No (n = 5) | Yes (n = 95) | |||
PriceEuro | 26154.40 ± 6790.52 | 57271.78 ± 34810.53 | 3.951 | 0.050* |
* p < 0.05 ** p < 0.01
Table 3: Part of one-way ANOVA tests for PowerTrain
PowerTrain (Mean ± S.D.) | F | p Value | |||
AWD (n = 38) | FWD (n = 37) | RWD (n = 25) | |||
PriceEuro | 85801.16 ± 39157.84 | 35395.16 ± 8784.66 | 40061.04 ± 11865.32 | 43.032 | 0.000** |
* p < 0.05 ** p < 0.01
Table 4 shows the multivariable linear regression of 11 variables. The model can be written as a linear function: \( PriceEuro = 52188.181- 296.914 * Accel +… + 11157.998 * Segment \) . The adjusted R-squared is 0.766, indicating that the Accel, TopSpeed, Range, Efficiency, FastCharge, Seats, Brand, RapidCharge, PowerTrain, BodyStyle, Segment are able to explain 76.6% of the adjustment of the price of the EV. The model also passes the F test, given that F = 30.405 and p = 0.000, smaller than 0.05. Multicollinearity issues do not exist in this model because the Variance Inflation Factor (VIF) of all variables are lower than 5, and all the sample tolerance is higher than 0.2. Moreover, the D-W is around 2, suggesting no autocorrelation exist.
Among all the variables, the p value of “Accel”, “TopSpeed”, “Seats”, “RapidCharge”, “PowerTrain”, “Segment” has a relatively small p value of 0.033, 0.011, 0.000, 0.040, 0.019 and 0.000. This means that these variables have a significant impact on the market price of the EV. While “Range”, “Efficiency”, “FastCharge”, “Brand” and “BodyStyle” have no significant effect on it due to the relatively high p value they have. In addition, it can be observed that “Accel”, “Seats”, “PowerTrain” have a negative regression coefficient, indicating that these variables have significant negative impact on the price of the EV; “TopSpeed”, “RapidCharge”, “Segment” have positive regression coefficient, showing positive influence on the price of the EV.
Table 4: Multivariable linear regression
Unstandardized | Standardized | t | p Value | Collinearity Diagnostic | |||
B | Std. Error | Beta | VIF | Tolerance | |||
Constant | 52188.181 | 20880.434 | - | 2.499 | 0.014* | - | - |
Accel | -296.914 | 136.685 | -0.139 | -2.172 | 0.033* | 1.738 | 0.575 |
TopSpeed | 1520.730 | 588.261 | 0.268 | 2.585 | 0.011* | 4.550 | 0.220 |
Range | 141.065 | 202.736 | 0.054 | 0.696 | 0.488 | 2.501 | 0.400 |
Efficiency | -102.016 | 187.465 | -0.041 | -0.544 | 0.588 | 2.388 | 0.419 |
FastCharge | 54.240 | 243.060 | 0.022 | 0.223 | 0.824 | 4.266 | 0.234 |
Seats | -15315.211 | 2895.241 | -0.357 | -5.290 | 0.000** | 1.926 | 0.519 |
Brand | -156.058 | 198.868 | -0.048 | -0.785 | 0.435 | 1.564 | 0.639 |
RapidCharge | 22192.021 | 10639.770 | 0.140 | 2.086 | 0.040* | 1.914 | 0.522 |
PowerTrain | -6707.472 | 2795.037 | -0.152 | -2.400 | 0.019* | 1.705 | 0.587 |
BodyStyle | -155.479 | 921.027 | -0.011 | -0.169 | 0.866 | 1.880 | 0.532 |
Segment | 11157.998 | 1895.857 | 0.553 | 5.885 | 0.000** | 3.730 | 0.268 |
R-squared | 0.792 | ||||||
Adjust R-squared | 0.766 | ||||||
F Test | F (11, 88) = 30.405, p = 0.000 | ||||||
D-W | 2.109 | ||||||
Note: Dependent Variable = PriceEuro
* p < 0.05 ** p < 0.01
4. Conclusion
In this paper, it can be concluded that the positive factors that will affect the market price of EV includes the maximum speed it can reach, the segments of cars and the rapid charging function; the negative factors that will impact the EV price are the acceleration of the EV; the seats number and the power train types. This conclusion still has room for improvement, considering that the dataset used in this paper only contains 100 samples, if the future study could enlarge the sample size, the model could have a higher R-squared value and lesser VIF value, further leading to a more reliable conclusion. Moreover, the multivariable linear regression model might not be the best option for this research, other researchers can try some machine-learning algorithms, such as random forest, or other advanced models to predict the impact of different variables on the price of EV, or more models could be used in the future research to improve the accuracy of the analysis. Besides, there are some other factors that this paper did not include due to the limitations of dataset and techniques, it would be better to add more quantitative and qualitative variables into the research.
Authors contribution
All the authors contributed equally and their names were listed in alphabetical order.
References
[1]. Twigg, M.V. (2007) Progress and future challenges in controlling automotive exhaust gas emissions. Applied Catalysis B: Environmental, 70, 2-15.
[2]. Ning, H.U., et al. (2004) Research of vehicle classification method in used car price evaluation. Journal of Shanghai University of Engineering Science.
[3]. Varma, M., et al. (2020) Comparative analysis of green house gases emission in conventional vehicles and electric vehicles. International Journal of Advanced Science and Technology, 29, 689-695.
[4]. Hertzke, P., et al. (2018) The global electric-vehicle market is amped up and on the rise. McKinsey Cent. Futur. Mobil, 1, 1-8.
[5]. Pelegov, D.V. and Jean-Jacques, C. (2022) Electric car market analysis using open data: Sales, volatility assessment, and forecasting. Sustainability, 15, 399.
[6]. Zou, P., et al. (2017) Electricity Markets Evolution with the Changing Generation Mix: An Empirical Analysis Based on China 2050 High Renewable Energy Penetration Roadmap. Applied Energy, 185, 56–67.
[7]. Huang, J.P., et al. (2019) A Comprehensive Analysis on Development and Transition of the Solar Thermal Market in China with More than 70% Market Share Worldwide. Energy, 174, 611–624.
[8]. Zhang, S.J., et al. (2020) China in Global Wind Power Development: Role, Status and Impact. Renewable and Sustainable Energy Reviews, 127, 109881.
[9]. Santalco, A. (2012) How and When China Will Exceed Its Renewable Energy Deployment Targets. Energy Policy, 51, 652–661.
[10]. Yang, X.J., et al. (2016) China’s Renewable Energy Goals by 2050. Environmental Development, 20, 83-90.
Cite this article
Ou,H.;Wang,R. (2025). Analysis of Factors That Affect the Price of Electric Vehicles. Theoretical and Natural Science,106,85-91.
Data availability
The datasets used and/or analyzed during the current study will be available from the authors upon reasonable request.
Disclaimer/Publisher's Note
The statements, opinions and data contained in all publications are solely those of the individual author(s) and contributor(s) and not of EWA Publishing and/or the editor(s). EWA Publishing and/or the editor(s) disclaim responsibility for any injury to people or property resulting from any ideas, methods, instructions or products referred to in the content.
About volume
Volume title: Proceedings of the 3rd International Conference on Mathematical Physics and Computational Simulation
© 2024 by the author(s). Licensee EWA Publishing, Oxford, UK. This article is an open access article distributed under the terms and
conditions of the Creative Commons Attribution (CC BY) license. Authors who
publish this series agree to the following terms:
1. Authors retain copyright and grant the series right of first publication with the work simultaneously licensed under a Creative Commons
Attribution License that allows others to share the work with an acknowledgment of the work's authorship and initial publication in this
series.
2. Authors are able to enter into separate, additional contractual arrangements for the non-exclusive distribution of the series's published
version of the work (e.g., post it to an institutional repository or publish it in a book), with an acknowledgment of its initial
publication in this series.
3. Authors are permitted and encouraged to post their work online (e.g., in institutional repositories or on their website) prior to and
during the submission process, as it can lead to productive exchanges, as well as earlier and greater citation of published work (See
Open access policy for details).
References
[1]. Twigg, M.V. (2007) Progress and future challenges in controlling automotive exhaust gas emissions. Applied Catalysis B: Environmental, 70, 2-15.
[2]. Ning, H.U., et al. (2004) Research of vehicle classification method in used car price evaluation. Journal of Shanghai University of Engineering Science.
[3]. Varma, M., et al. (2020) Comparative analysis of green house gases emission in conventional vehicles and electric vehicles. International Journal of Advanced Science and Technology, 29, 689-695.
[4]. Hertzke, P., et al. (2018) The global electric-vehicle market is amped up and on the rise. McKinsey Cent. Futur. Mobil, 1, 1-8.
[5]. Pelegov, D.V. and Jean-Jacques, C. (2022) Electric car market analysis using open data: Sales, volatility assessment, and forecasting. Sustainability, 15, 399.
[6]. Zou, P., et al. (2017) Electricity Markets Evolution with the Changing Generation Mix: An Empirical Analysis Based on China 2050 High Renewable Energy Penetration Roadmap. Applied Energy, 185, 56–67.
[7]. Huang, J.P., et al. (2019) A Comprehensive Analysis on Development and Transition of the Solar Thermal Market in China with More than 70% Market Share Worldwide. Energy, 174, 611–624.
[8]. Zhang, S.J., et al. (2020) China in Global Wind Power Development: Role, Status and Impact. Renewable and Sustainable Energy Reviews, 127, 109881.
[9]. Santalco, A. (2012) How and When China Will Exceed Its Renewable Energy Deployment Targets. Energy Policy, 51, 652–661.
[10]. Yang, X.J., et al. (2016) China’s Renewable Energy Goals by 2050. Environmental Development, 20, 83-90.