


1. Introduction
With the continuous increase in global car ownership, the incidence of road traffic accidents is also rising. According to the “Global Status Report on Road Safety 2023” released by the World Health Organization, road traffic accidents are now the leading cause of death for people aged 5-29 and the twelfth leading cause of death across all age groups [1]. Data released by the Chinese Ministry of Public Security indicates that a total of 1,753,254 road traffic accidents occurred in China in 2023, an 8% increase compared to 2022. These accidents resulted in 500,000 deaths, a 4% increase, and 60,000 injuries, a 5% increase [2].
Therefore, to develop more effective preventative strategies, the assessment and research of road traffic accident risks is increasingly important. Existing roadside safety research focuses on two main areas: first, risk assessment of roadside accidents based on a large number of accident cases, using mathematical analysis models to explore risk factors affecting accident frequency, number, and severity; second, the use of advanced data fusion, data preception, and other technologies for proactive risk assessment and early warning [3]. These approaches can also be applied to road traffic accident risk research. Prior to this, Chen et al. Use a hybrid of factors such as environment, practice effects, and road geometry on traffic accidents, with greater consideration given to the role of temporal effects in traffic accident analysis and prediction [4]. Xu et al. Used K-means clustering analysis and logistic regression to analyze the impact of different highway traffic states on traffic accident risk [5]. To address the issues of insufficient accuracy and lack of interpretability in regression models, Dong et al. improved the random forest method and SHAP method to explore the degree of influence of various factors on different accident risk categories, thus achieving model interpretation [3].
Studies of traffic accident risk have identified four main categories of significant causative factors: road, vehicle, driver, and environment [3]. This paper uses a large number of data cases to train and establish a random forest model to predict traffic accident risk, identify the importance of each influencing factor in the prediction model, and compare the model's fit with that of other methods.
This paper mainly considers the impact of weather and roadside facilities on traffic accident risk, including specific factors such as visibility, wind speed, precipitation, the presence of traffic lights, and bus stops. Furthermore, the risk assessment of traffic accidents primarily considers two factors: the severity of the accident and the duration of the impact.
2. Methods
2.1. Data sources and explanations
The dataset used is from Kaggle and represents a nationwide traffic accident dataset covering 49 US states. The accident data was collected via multiple APIs between February 2016 and March 2020. These APIs are maintained by various entities, including national and state transportation departments, law enforcement agencies, traffic cameras, and traffic sensors within road networks [6,7]. The original dataset contains approximately 1.5 million accident records spanning five years. To facilitate processing, this paper selects only the 1,178,913 traffic accident records from 2020.
2.2. Indicator selection and description
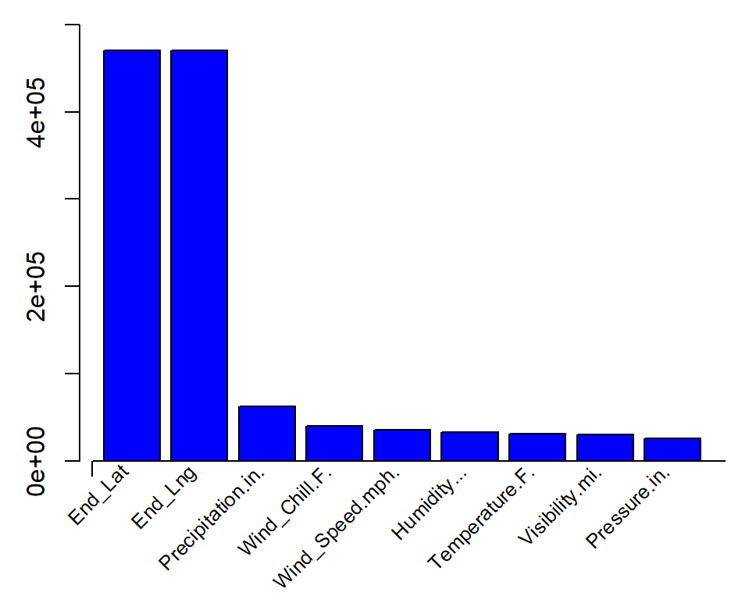
First, preprocess the data. As shown in Figure 1, some columns have a high number of missing values. Remove columns where more than 20% of the data is missing, and then remove irrelevant variables.
Ultimately, the dependent variables were Severity and Duration. Among the independent variables, 5 weather-related variables and 8 roadside facility variables were selected. Mean imputation was used to fill missing values for temperature, humidity, air pressure, and visibility. Missing precipitation values were replaced with 0, and the missing wind speed values were imputed using a forward fill method. Table 1 shows the research variables.
|
Variable |
Data type |
||
|
Dependent variable |
Severity(1-4) |
integer |
|
|
Duration(s) |
numeric |
||
|
Independent variable |
Weather factors |
Humidit(%) |
Numeric |
|
Pressure(in) |
Numeric |
||
|
Visibility(mi) |
Numeric |
||
|
Wind_Speed(mph) |
Numeric |
||
|
Precipitation(in) |
Numeric |
||
|
Roadside facilities |
Bump |
Logical |
|
|
Crossing |
Logical |
||
|
Give_Way |
Logical |
||
|
Junction |
Logical |
||
|
Railway |
Logical |
||
|
Stop |
Logical |
||
|
Traffic_Calming |
Logical |
||
|
Traffic_Signal |
Logical |
||
2.3. Method introduction
This paper will utilize the random forest method for research. Random forest is an ensemble learning technique based on decision trees. It generates a large number of decision trees from training data by constructing and combining multiple decision trees, randomly selecting features at each split, and averaging the final results to improve model precision and accuracy.
This paper randomly divides the dataset into two independent subsets: a training dataset (accounting for 70% of the data) and a test set (accounting for 30% of the data). The training set is used to calibrate and fine-tune the model, and the test set is used to evaluate the model's accuracy.
Here, random forests are not only used to solve multi-classification problems, but also for regression analysis.
Integrating multiple, independently trained decision trees enhances prediction accuracy and mitigates overfitting. By aggregating the predictions from these trees, random forests offer a comprehensive data analysis, leading to precise forecasts [8].
In processing the data samples, this paper also employs a tree-based multi-classification algorithm designed for imbalanced data, transforming the multi-classification problem into a binary one. This method identifies the majority class within the multi-class samples by counting the instances in each category. It then designates this majority class as the positive class, combines the remaining classes into a negative class, and builds a classifier. This process is repeated iteratively to construct an imbalanced binary multi-classification tree [9,10].
To address imbalanced data samples, SMOTE oversampling is utilized to generate synthetic minority class samples using nearest neighbor algorithms, making it particularly well-suited for handling imbalanced datasets.
First, calculate the Euclidean distance between each sample and all other samples in the minority class dataset to identify the k nearest neighbors. Second, select a sampling factor N, randomly choose N samples from the nearest neighbors, and generate new samples by performing a random linear combination with the original sample [7].
3. Results analysis
3.1. Predicted severity
The dataset categorizes accident severity into four levels, labeled "1, 2, 3, 4," with "1" being the least severe. Initially, the number of samples within each of the four levels is counted to examine the distribution.
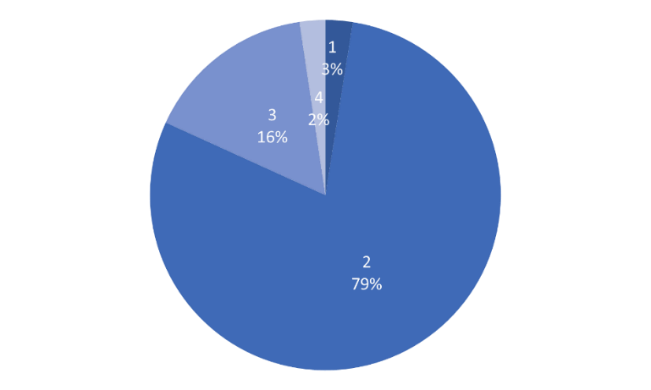
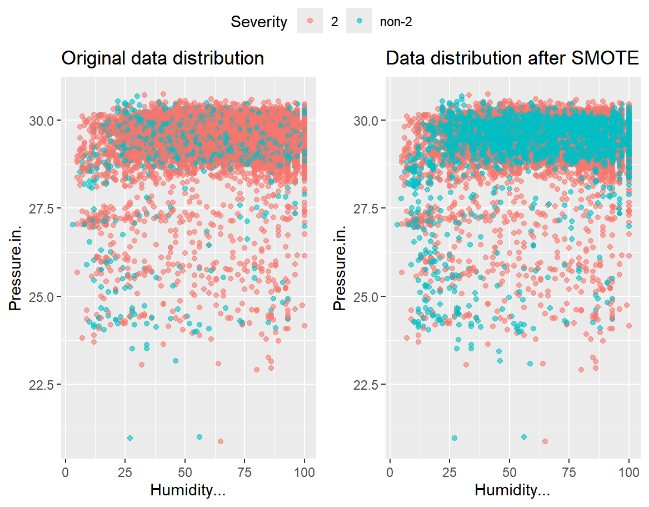
First, the distribution of the Severity variable in the dataset is illustrated in Figure 2. As is evident, the data distribution is imbalanced. Therefore, a tree-based multi-class classification algorithm designed for imbalanced data is required to transform the four classes into two: "2" and "non-2", effectively converting the multi-class problem into a binary classification problem. The SMOTE oversampling technique is then applied to balance the sample data. The resulting data distribution after sampling is shown in Figure 3.
3.1.1. Parameter selection
In random forests, mtry is a key parameter representing the number of features randomly sampled from the full set of features at each node split to determine the best split. The ntree parameter specifies the number of decision trees to be built. One should experiment with different mtry values, observing the model's performance metrics to select the optimal value. Here, precision and the Kappa coefficient are used to evaluate model performance. The Kappa coefficient, derived from the confusion matrix, measures the agreement between the classification model's predictions and the actual outcomes.
|
mtry |
Accuracy |
Kappa |
|
2 |
0.787 |
0.033 |
|
4 |
0.757 |
0.043 |
|
6 |
0.754 |
0.044 |
Based on a comprehensive consideration of the results in Table 2, a value of mtry=2 is selected. With mtry fixed at this value, ntree is then varied to evaluate the model and identify the optimal parameter combination.
|
ntree |
Accuracy(Mean) |
Kappa(Mean) |
|
100 |
0.7852 |
0.0247 |
|
200 |
07858 |
0.0272 |
|
300 |
0.7857 |
0.0263 |
Considering the results in Table 3 comprehensively, a parameter value of ntree=200 was selected. After adjusting the parameter combinations, the model was trained, and the ROC curve was shown in Figure 4. The AUC value, representing the area under the ROC curve, is greater than 0.5 and less than 1, indicating the model performs better than random chance. Even with parameter tuning, the AUC for this model isn't particularly high. This may be because weather and roadside infrastructure factors are somewhat related to the actual causes of traffic accidents, but the correlation isn't strong. Therefore, predicting the severity of traffic accidents using only these two factors does not yield highly accurate results.

3.1.2. Importance analysis
Random forest models were used to make predictions, with the seven weather variables and eight roadside facility variables serving as independent variables, respectively. The corresponding variable importance scores were then obtained.
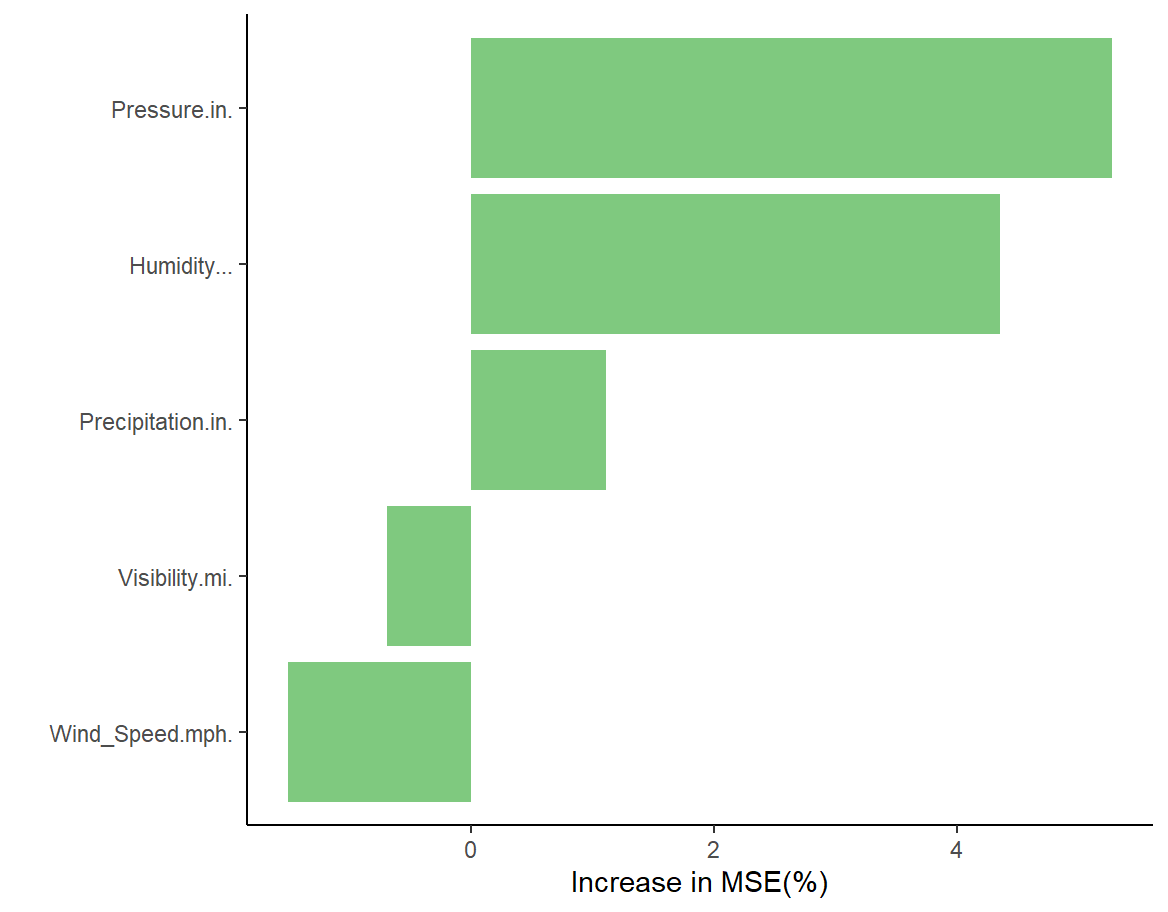
As can be seen from Figures 5 and 6, among the weather factors, pressure (Perssure.in.) and humidity (Humidity...) play a more significant role in predicting the severity of traffic accidents, while visibility (Visibility.im) and precipitation (Precipitation.in.) have less impact on predicting accident severity.
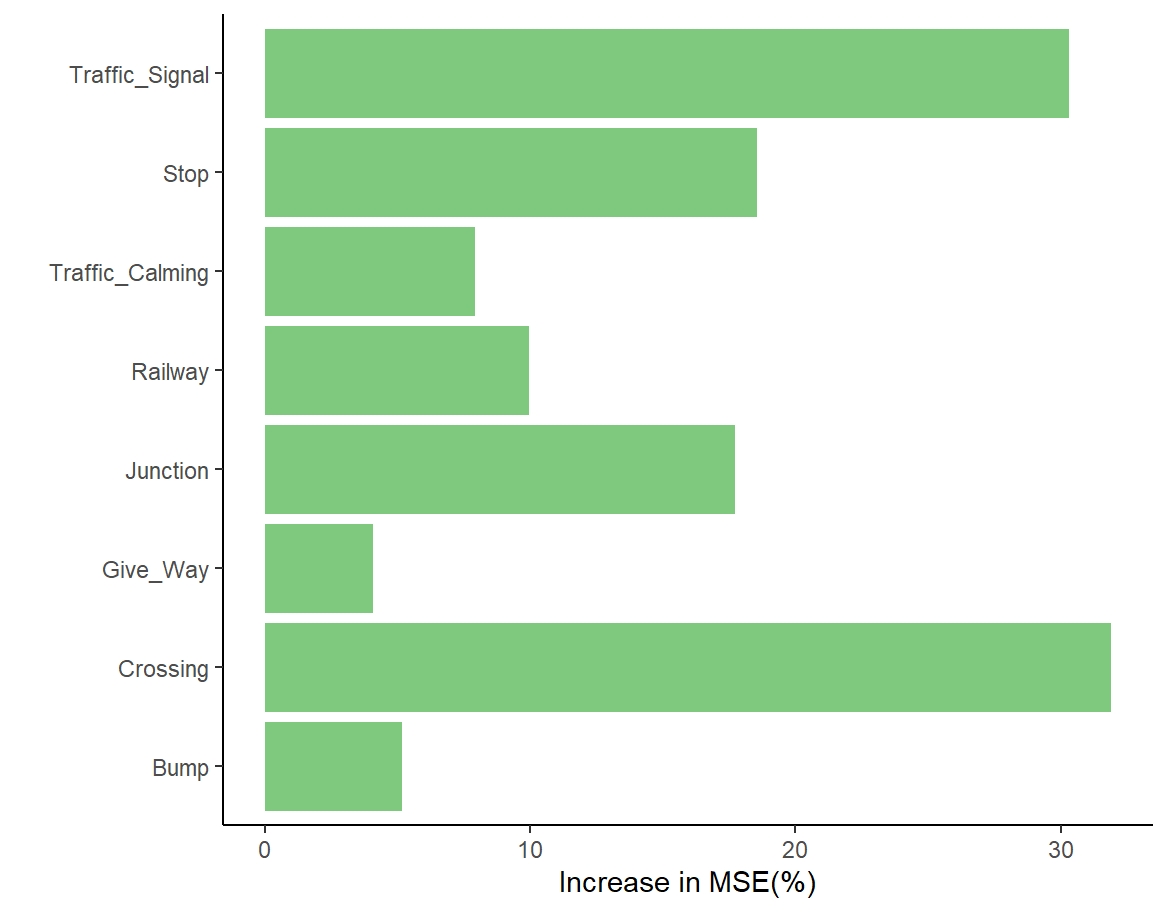
Among the roadside facility factors, the presence of intersections (Crossing), traffic signals (Traffic_Signal), bus stops (Stop), and junctions (Junction) has a greater influence on predicting severity, whereas the presence of yield signs (Give_way) and speed bumps (Bump) has a smaller influence on the prediction results.
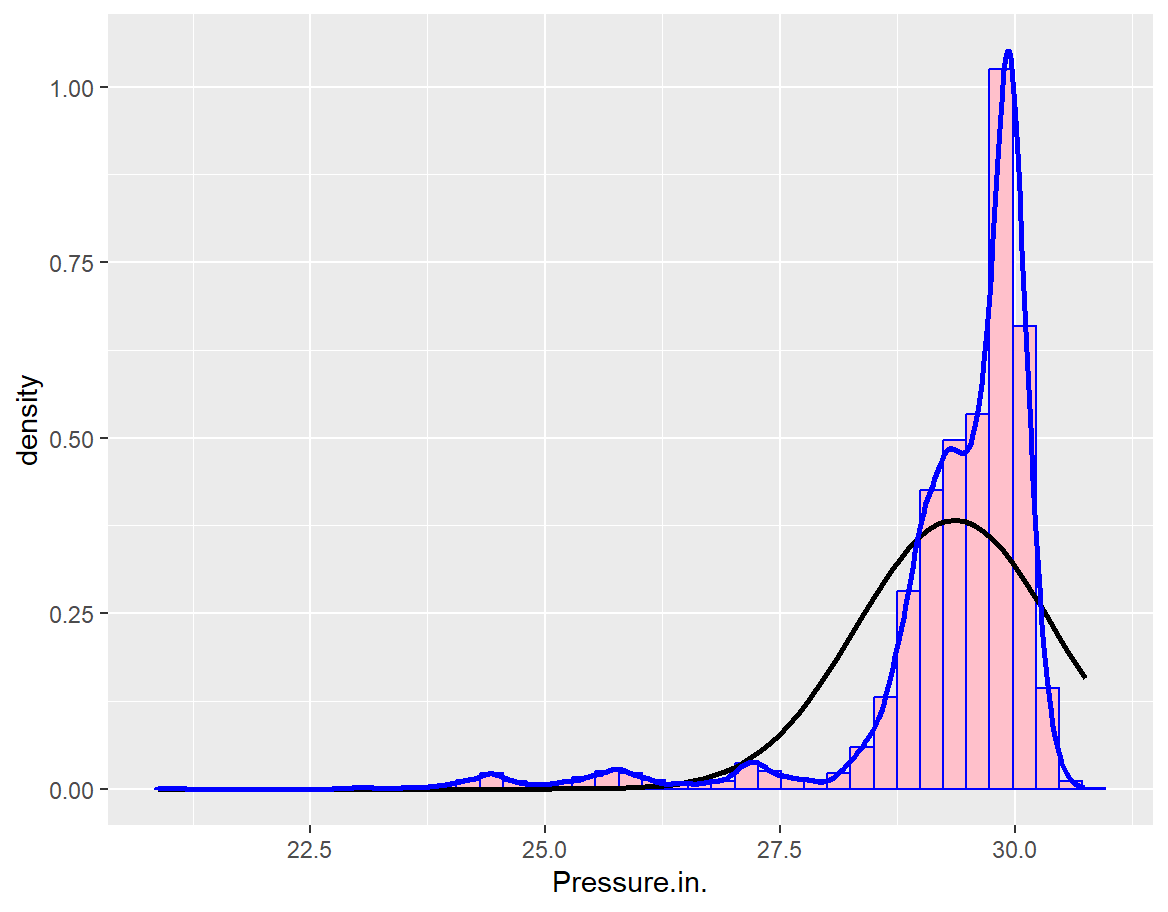
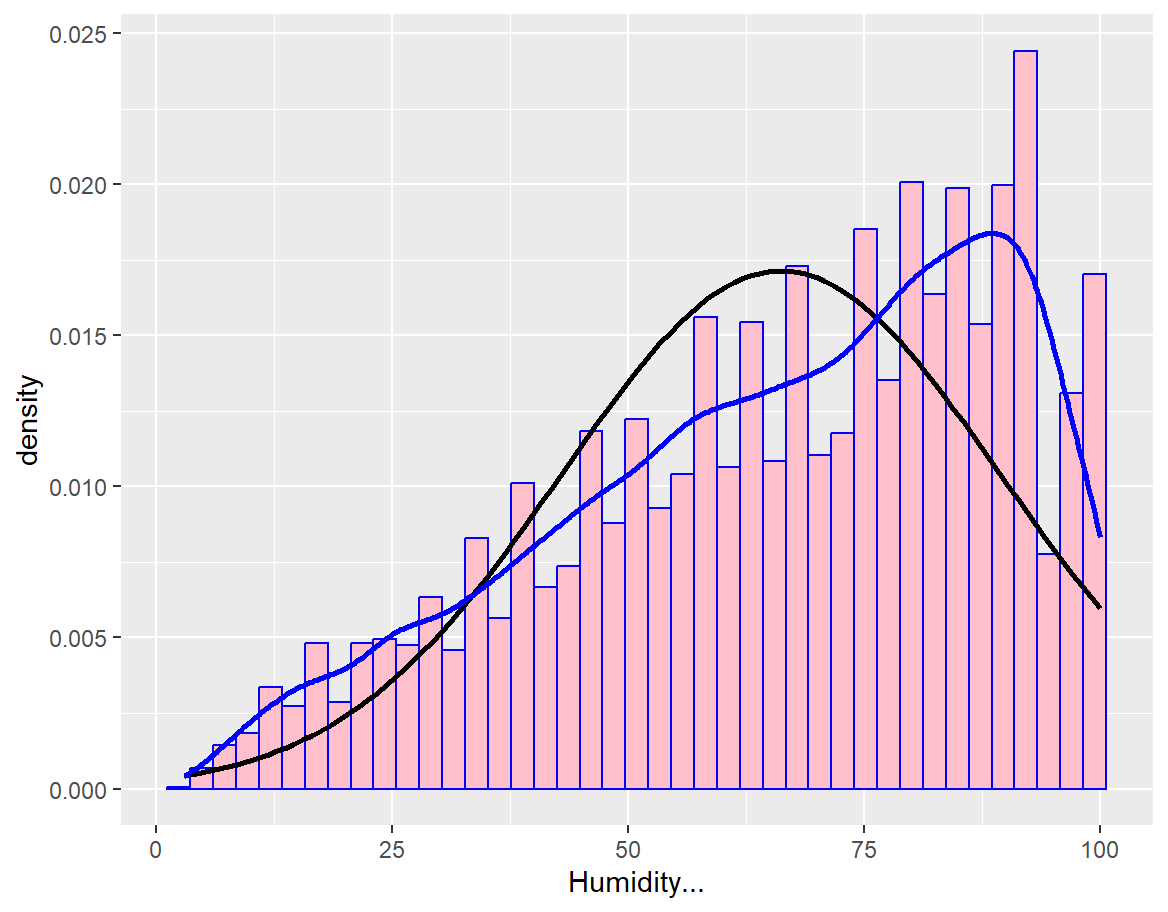
Based on the statistical results from the original dataset, as illustrated in Figures 7 and 8, the paper can conclude that more severe traffic accidents are more likely to happen when the pressure is approximately 30.0 inches. Higher humidity also correlates with a greater likelihood of severe traffic accidents. Areas near intersections, junctions, and stations are also more prone to serious traffic accidents.
3.2. Accident impact duration
Predicting the duration of traffic accident impact is reframed from a classification task to a regression problem. Here, a random forest is employed for regression analysis. Each decision tree outputs a continuous value, and the final prediction is the average of the predictions from all trees. The same variables are used to train the model and determine feature importance.
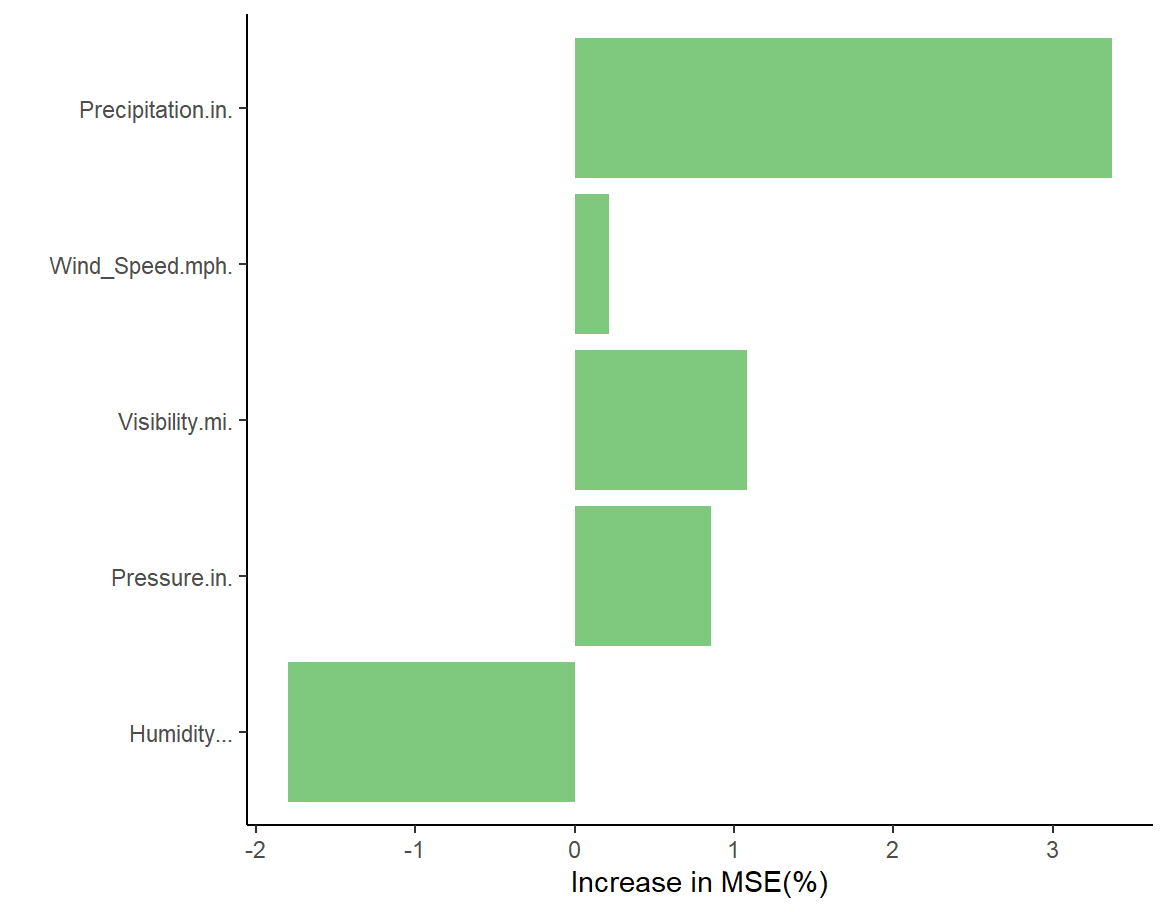
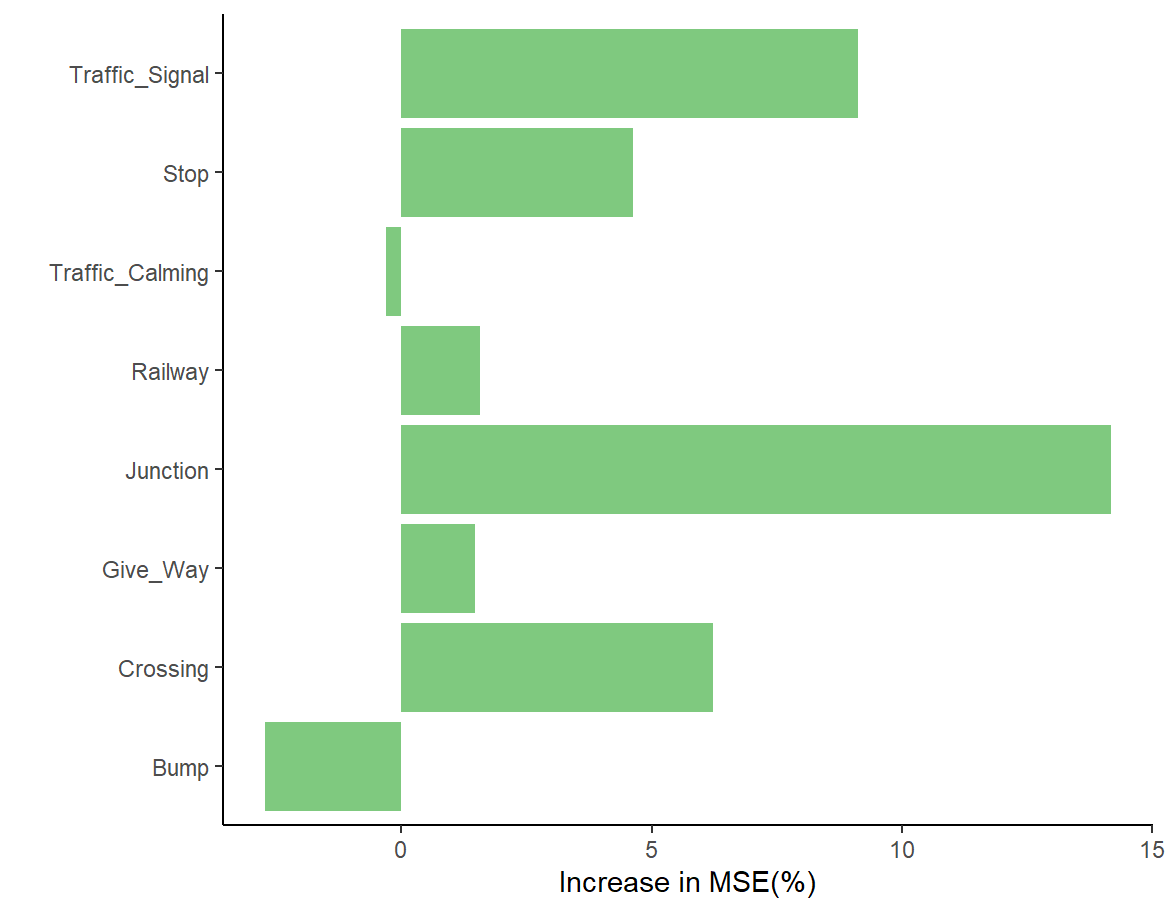
Figures 9 and 10 show that, among weather factors, precipitation (Precipitation.in.) and humidity (Humidity…) are more influential in predicting the duration of impact, while wind speed (Wind_Speed.mph.) has a negligible effect. Regarding roadside facilities, the presence of junctions (Junction), traffic signals (Traffic_Signal), and crossings (Crossing) are more important predictors of duration, whereas traffic calming zones (Traffic_Calming) are almost irrelevant.
Subsequently, different machine learning methods are employed to predict the duration of traffic accident impact, with the aim of comparing and identifying the algorithm model that provides the best fit. A comparison of the fitting effects is then conducted for the Random Forest algorithm, Neural Network algorithm, AdaBoost algorithm, Support Vector Machine algorithm, and XGBoost algorithm.
Among these, neural networks are a machine learning technique that mimics the structure and function of neurons in the human brain. They process and transmit information through multiple layers of interconnected nodes, each with associated weights and thresholds. In each iteration, AdaBoost "forces" the new weak learner to focus more on the samples that are difficult to classify by increasing the weights of samples misclassified by the previous weak learner and decreasing the weights of correctly classified samples. Finally, the predictions of all weak learners are combined through weighted averaging or weighted voting to obtain the final strong learner. A Support Vector Machine (SVM) is a powerful supervised learning algorithm used for classification and regression analysis in machine learning. Its goal is to find a hyperplane in the feature space that separates data points of different classes while maximizing the margin between them.
XGBoost is an efficient gradient boosting decision tree algorithm. It builds upon GBDT, significantly enhancing the model's performance.
R2 is a goodness-of-fit metric; a higher value indicates a better fit. Mean Absolute Error (MAE) represents the average difference between true and fitted values. Median Absolute Deviation (MAD) is the median of the absolute residuals and is robust to outliers. Mean Absolute Percentage Error (MAPE) represents the average percentage error and is robust to outliers. Explained Variance Score (EVS) measures the proportion of variance in the data explained by the model; a higher value is better.
|
Metrics |
Random Forest |
Neural Network |
Adaboost |
Support Vector Machine |
XGboost |
|
R2 |
0.833 |
0.004 |
0.135 |
0.074 |
0.255 |
|
MAE |
37.607 |
88.750 |
125.780 |
76.162 |
77.921 |
|
MAD |
21.984 |
62.700 |
100.118 |
36.969 |
51.641 |
|
MAPE |
42.992 |
116.726 |
192.078 |
65.080 |
101.251 |
|
EVS |
0.834 |
0.004 |
0.014 |
0.001 |
0.255 |
Table 4 shows that the random forest algorithm provides more accurate predictions and a better fit compared to the other algorithms.
4. Conclusions
To conduct risk research and prediction of road traffic accidents, this paper establishes a random forest model based on real traffic accident data from the United States in 2020. Accident severity and the duration of the accident's impact are used as dependent variables, considering 5 weather-related variables and 8 roadside facility variables. Furthermore, the data was preprocessed using a tree-based multi-class classification algorithm for imbalanced data and the SMOTE algorithm, leading to the following conclusions:
(1) In predicting both severity and duration, humidity plays a significant role; higher humidity correlates with more severe road traffic accidents. The presence of nearby traffic lights is also a crucial factor, suggesting that more serious accidents are more likely to occur near intersections and junctions.
(2) Among the machine learning methods compared, the random forest algorithm proves to be the most accurate in predicting the risk of road traffic accidents. Therefore, it can be used for advance evaluation and early warning of traffic accident risks.
(3) Regarding the model's fit and predictive accuracy, neither the random forest regression analysis nor the binary classification solution in this paper achieved a high level of accuracy. This suggests that the correlation between weather and road infrastructure factors and the occurrence of road traffic accidents is not strong, and these factors only play a partial role in risk prediction. The risk of road traffic accidents is also related to many other factors, such as human factors.
Future research could incorporate additional related influencing factors, such as human factors, to further investigate traffic accident risks. This would allow for the development of relevant safety measures to reduce the incidence of traffic accidents and associated casualties.
References
[1]. Sun, C. Y., Dong, Q., Wang, Y. W., Ma, F. H., Xie, T. C., Li, M. (2024). A Machine Learning-Based Analysis Method for Rollover Accident Severity. Journal of Traffic Engineering, 68-77.
[2]. Dong, C. J., Wan, Y. J., Li, P. H. (2025). Multi-Category Traffic Accident Risk Assessment Based on Interpretable Random Forest. Journal of Beijing University of Technology, 1-10.
[3]. Cheng, R., Pan, Y., Dai, J. J., Wang, T., Xie, J. C. (2023). A Review of Roadside Accident Risk Assessment and Roadside Safety Design Research on Highways. China Safety Science Journal, 33(09)214-226.
[4]. Chen, F., Chen , S., Ma, X. (2018). Analysis of hourly crash likelihood using unbalanced panel data mixed logit model and real-time driving environmental big data. Journal of Safety Research, 65153-159.
[5]. Xu, C. C., Liu, P., Wang, W., Li, Z. B. (2012). Evaluation of the impacts of traffic states on crash risks on freeways. Accident Analysis and Prevention, 47162-171.
[6]. Moosavi, S., Mohammad H. S., Srinivasan P., Rajiv R., (2019). A Countrywide Traffic Accident Dataset. arXiv preprint arXiv.
[7]. Zhang, S. Y., Wang, A. Y. (2025). Credit Risk Assessment of Small and Medium Enterprises Based on SMOTE-Boruta-LightGBM. Times Economics and Trade, 22(04): 42-48.
[8]. Wang, L. M., Zhu, L. J., Liu, J. G. (2025). Prediction of Coal Volatile Matter Content Based on Terahertz Spectroscopy and Random Forest Algorithm. Chinese Journal of Inorganic Analytical Chemistry, 15(06): 867-873.
[9]. Moosavi, S., Mohammad, H. S., Srinivasan P., Radu T., Rajiv, R., (2019). Accident Risk Prediction based on Heterogeneous Sparse Data: New Dataset and Insights. In proceedings of the 27th ACM SIGSPATIAL International Conference on Advances in Geographic Information Systems.
[10]. Wang, X. (2016). Multi-Class Classification Method for Imbalanced Data Based on Tree Structure. Journal of Lvliang University, 6(02): 8-10.
Cite this article
Liu,H. (2025). Road Traffic Accident Risk Prediction Based on Random Forest Model. Theoretical and Natural Science,134,62-72.
Data availability
The datasets used and/or analyzed during the current study will be available from the authors upon reasonable request.
Disclaimer/Publisher's Note
The statements, opinions and data contained in all publications are solely those of the individual author(s) and contributor(s) and not of EWA Publishing and/or the editor(s). EWA Publishing and/or the editor(s) disclaim responsibility for any injury to people or property resulting from any ideas, methods, instructions or products referred to in the content.
About volume
Volume title: Proceedings of CONF-APMM 2025 Symposium: Controlling Robotic Manipulator Using PWM Signals with Microcontrollers
© 2024 by the author(s). Licensee EWA Publishing, Oxford, UK. This article is an open access article distributed under the terms and
conditions of the Creative Commons Attribution (CC BY) license. Authors who
publish this series agree to the following terms:
1. Authors retain copyright and grant the series right of first publication with the work simultaneously licensed under a Creative Commons
Attribution License that allows others to share the work with an acknowledgment of the work's authorship and initial publication in this
series.
2. Authors are able to enter into separate, additional contractual arrangements for the non-exclusive distribution of the series's published
version of the work (e.g., post it to an institutional repository or publish it in a book), with an acknowledgment of its initial
publication in this series.
3. Authors are permitted and encouraged to post their work online (e.g., in institutional repositories or on their website) prior to and
during the submission process, as it can lead to productive exchanges, as well as earlier and greater citation of published work (See
Open access policy for details).
References
[1]. Sun, C. Y., Dong, Q., Wang, Y. W., Ma, F. H., Xie, T. C., Li, M. (2024). A Machine Learning-Based Analysis Method for Rollover Accident Severity. Journal of Traffic Engineering, 68-77.
[2]. Dong, C. J., Wan, Y. J., Li, P. H. (2025). Multi-Category Traffic Accident Risk Assessment Based on Interpretable Random Forest. Journal of Beijing University of Technology, 1-10.
[3]. Cheng, R., Pan, Y., Dai, J. J., Wang, T., Xie, J. C. (2023). A Review of Roadside Accident Risk Assessment and Roadside Safety Design Research on Highways. China Safety Science Journal, 33(09)214-226.
[4]. Chen, F., Chen , S., Ma, X. (2018). Analysis of hourly crash likelihood using unbalanced panel data mixed logit model and real-time driving environmental big data. Journal of Safety Research, 65153-159.
[5]. Xu, C. C., Liu, P., Wang, W., Li, Z. B. (2012). Evaluation of the impacts of traffic states on crash risks on freeways. Accident Analysis and Prevention, 47162-171.
[6]. Moosavi, S., Mohammad H. S., Srinivasan P., Rajiv R., (2019). A Countrywide Traffic Accident Dataset. arXiv preprint arXiv.
[7]. Zhang, S. Y., Wang, A. Y. (2025). Credit Risk Assessment of Small and Medium Enterprises Based on SMOTE-Boruta-LightGBM. Times Economics and Trade, 22(04): 42-48.
[8]. Wang, L. M., Zhu, L. J., Liu, J. G. (2025). Prediction of Coal Volatile Matter Content Based on Terahertz Spectroscopy and Random Forest Algorithm. Chinese Journal of Inorganic Analytical Chemistry, 15(06): 867-873.
[9]. Moosavi, S., Mohammad, H. S., Srinivasan P., Radu T., Rajiv, R., (2019). Accident Risk Prediction based on Heterogeneous Sparse Data: New Dataset and Insights. In proceedings of the 27th ACM SIGSPATIAL International Conference on Advances in Geographic Information Systems.
[10]. Wang, X. (2016). Multi-Class Classification Method for Imbalanced Data Based on Tree Structure. Journal of Lvliang University, 6(02): 8-10.