


1. Introduction
Parkinson's Disease (PD) is a prevalent neurodegenerative disorder where early diagnosis is critical for improving patient outcomes and management strategies [1,2]. The incidence of PD is estimated at 21 cases per 100,000 person-years, with the risk increasing substantially with age. Early diagnosis is critical for improving patient outcomes and management strategies. To aid in this effort, clinical research has identified several key protein biomarkers, including α-synuclein (α-syn), amyloid-beta 42, and neurofilament light chain (NF-L), whose levels in cerebrospinal fluid can help diagnose and monitor neurodegenerative conditions [3].These widely studied proteins are encoded by the genes SNCA, APP, and NEFL, respectively.
While these biomarkers are invaluable, they are typically measured from bulk fluid or tissue samples, which averages the molecular signal from millions of different cells. This approach masks the specific contributions of individual cell types. With the recent technological advance of single-cell/single-nucleus RNA sequencing (sc/snRNA-seq), it is now possible to dissect gene expression with unprecedented resolution [4]. This technology allows us to ask a more refined question: what is happening to these critical diagnostic marker genes at the level of individual neurons, astrocytes, and microglia within the brains of PD patients?
Therefore, this study leverages a publicly available single-nucleus transcriptomic dataset from the human prefrontal cortex to provide a high-resolution view of these diagnostic markers. We aim to characterize the cell-type-specific expression and co-expression patterns of SNCA, APP, and NEFL to determine how their cellular behavior is altered in Parkinson's Disease.
2. Method
2.1. Single-cell RNA sequencing dataset
The analysis was performed using a publicly available snRNA-seq dataset from Zhu et al. [5] The data is taken from twelve people - six patients with PD and six heathy controls with same sex and age. The ages of those people are between the range 63 to 96 years with mean age 75.9. The data is taken from the tissue from the prefrontal cortex Brodmann area 9. This dataset was processed by using Python to quantify the expression levels of target genes and to assess co-expression patterns and correlations between them across identified cell populations.
2.2. Data analysis
The snRNA-seq analysis was conducted in Python, primarily utilizing the Scanpy and Seaborn libraries. First, the complete dataset was constructed by integrating the raw gene expression count matrix with its corresponding metadata file, which contained cell type and condition annotations. Using this data object, the objective was to compare gene expression and correlation patterns between Health Control (HC) and Parkinson's Disease (PD) samples within major human brain cell types: excitatory neurons (ExN), inhibitory neurons (InN), oligodendrocytes (Oligo), astrocytes (Astro), microglia (MG), oligodendrocyte precursor cells (OPC), endothelial cells (Endo), and T cells [5].
The analysis began with data visualization and quality control. Uniform Manifold Approximation and Projection (UMAP) was first applied to visualize the overall cellular landscape and confirm the distribution of cell types across both HC and PD conditions. A heatmap of canonical marker genes was then generated to validate the accuracy of the cell type annotations. Following this, condition-specific expression was assessed by creating dotplots to visualize the expression levels and the percentage of expressing cells for the three target genes (SNCA, APP, and NEFL). This step was performed separately for HC and PD cohorts to identify changes in gene expression within each cell type.
To conclude the analysis, the relationships between the target genes were investigated through a co-expression study. Pairwise scatterplots were generated for each gene combination within every cell type and condition. The strength and significance of these associations were quantified by calculating Pearson correlation coefficients (r) and corresponding p-values. Finally, the correlation coefficients were compiled and visualized in a summary heatmap using Seaborn, providing a direct comparison of the gene co-expression network between the HC and PD groups.
2.3. Statistical analysis
All statistical analyses were performed using Python v3.12.3 with the Scanpy (v1.10.4) and Seaborn (v0.13.2) libraries. To assess the co-expression of SNCA, APP, and NEFL, pairwise linear relationships were quantified using the Pearson correlation coefficient (r) from scipy library (v1.13.1).
This analysis was conducted independently for each major cell type within both the Health Control (HC) and Parkinson's Disease (PD) cohorts. The statistical significance of each correlation was determined by calculating a corresponding p-value. A correlation was generally considered statistically significant if the p-value was less than 0.05. Cells express both genes were included in the analysis. The resulting correlation coefficients were visualized using summary heatmaps to compare co-expression patterns between the two conditions.
3. Results
3.1. Dataset quality and cell type identification
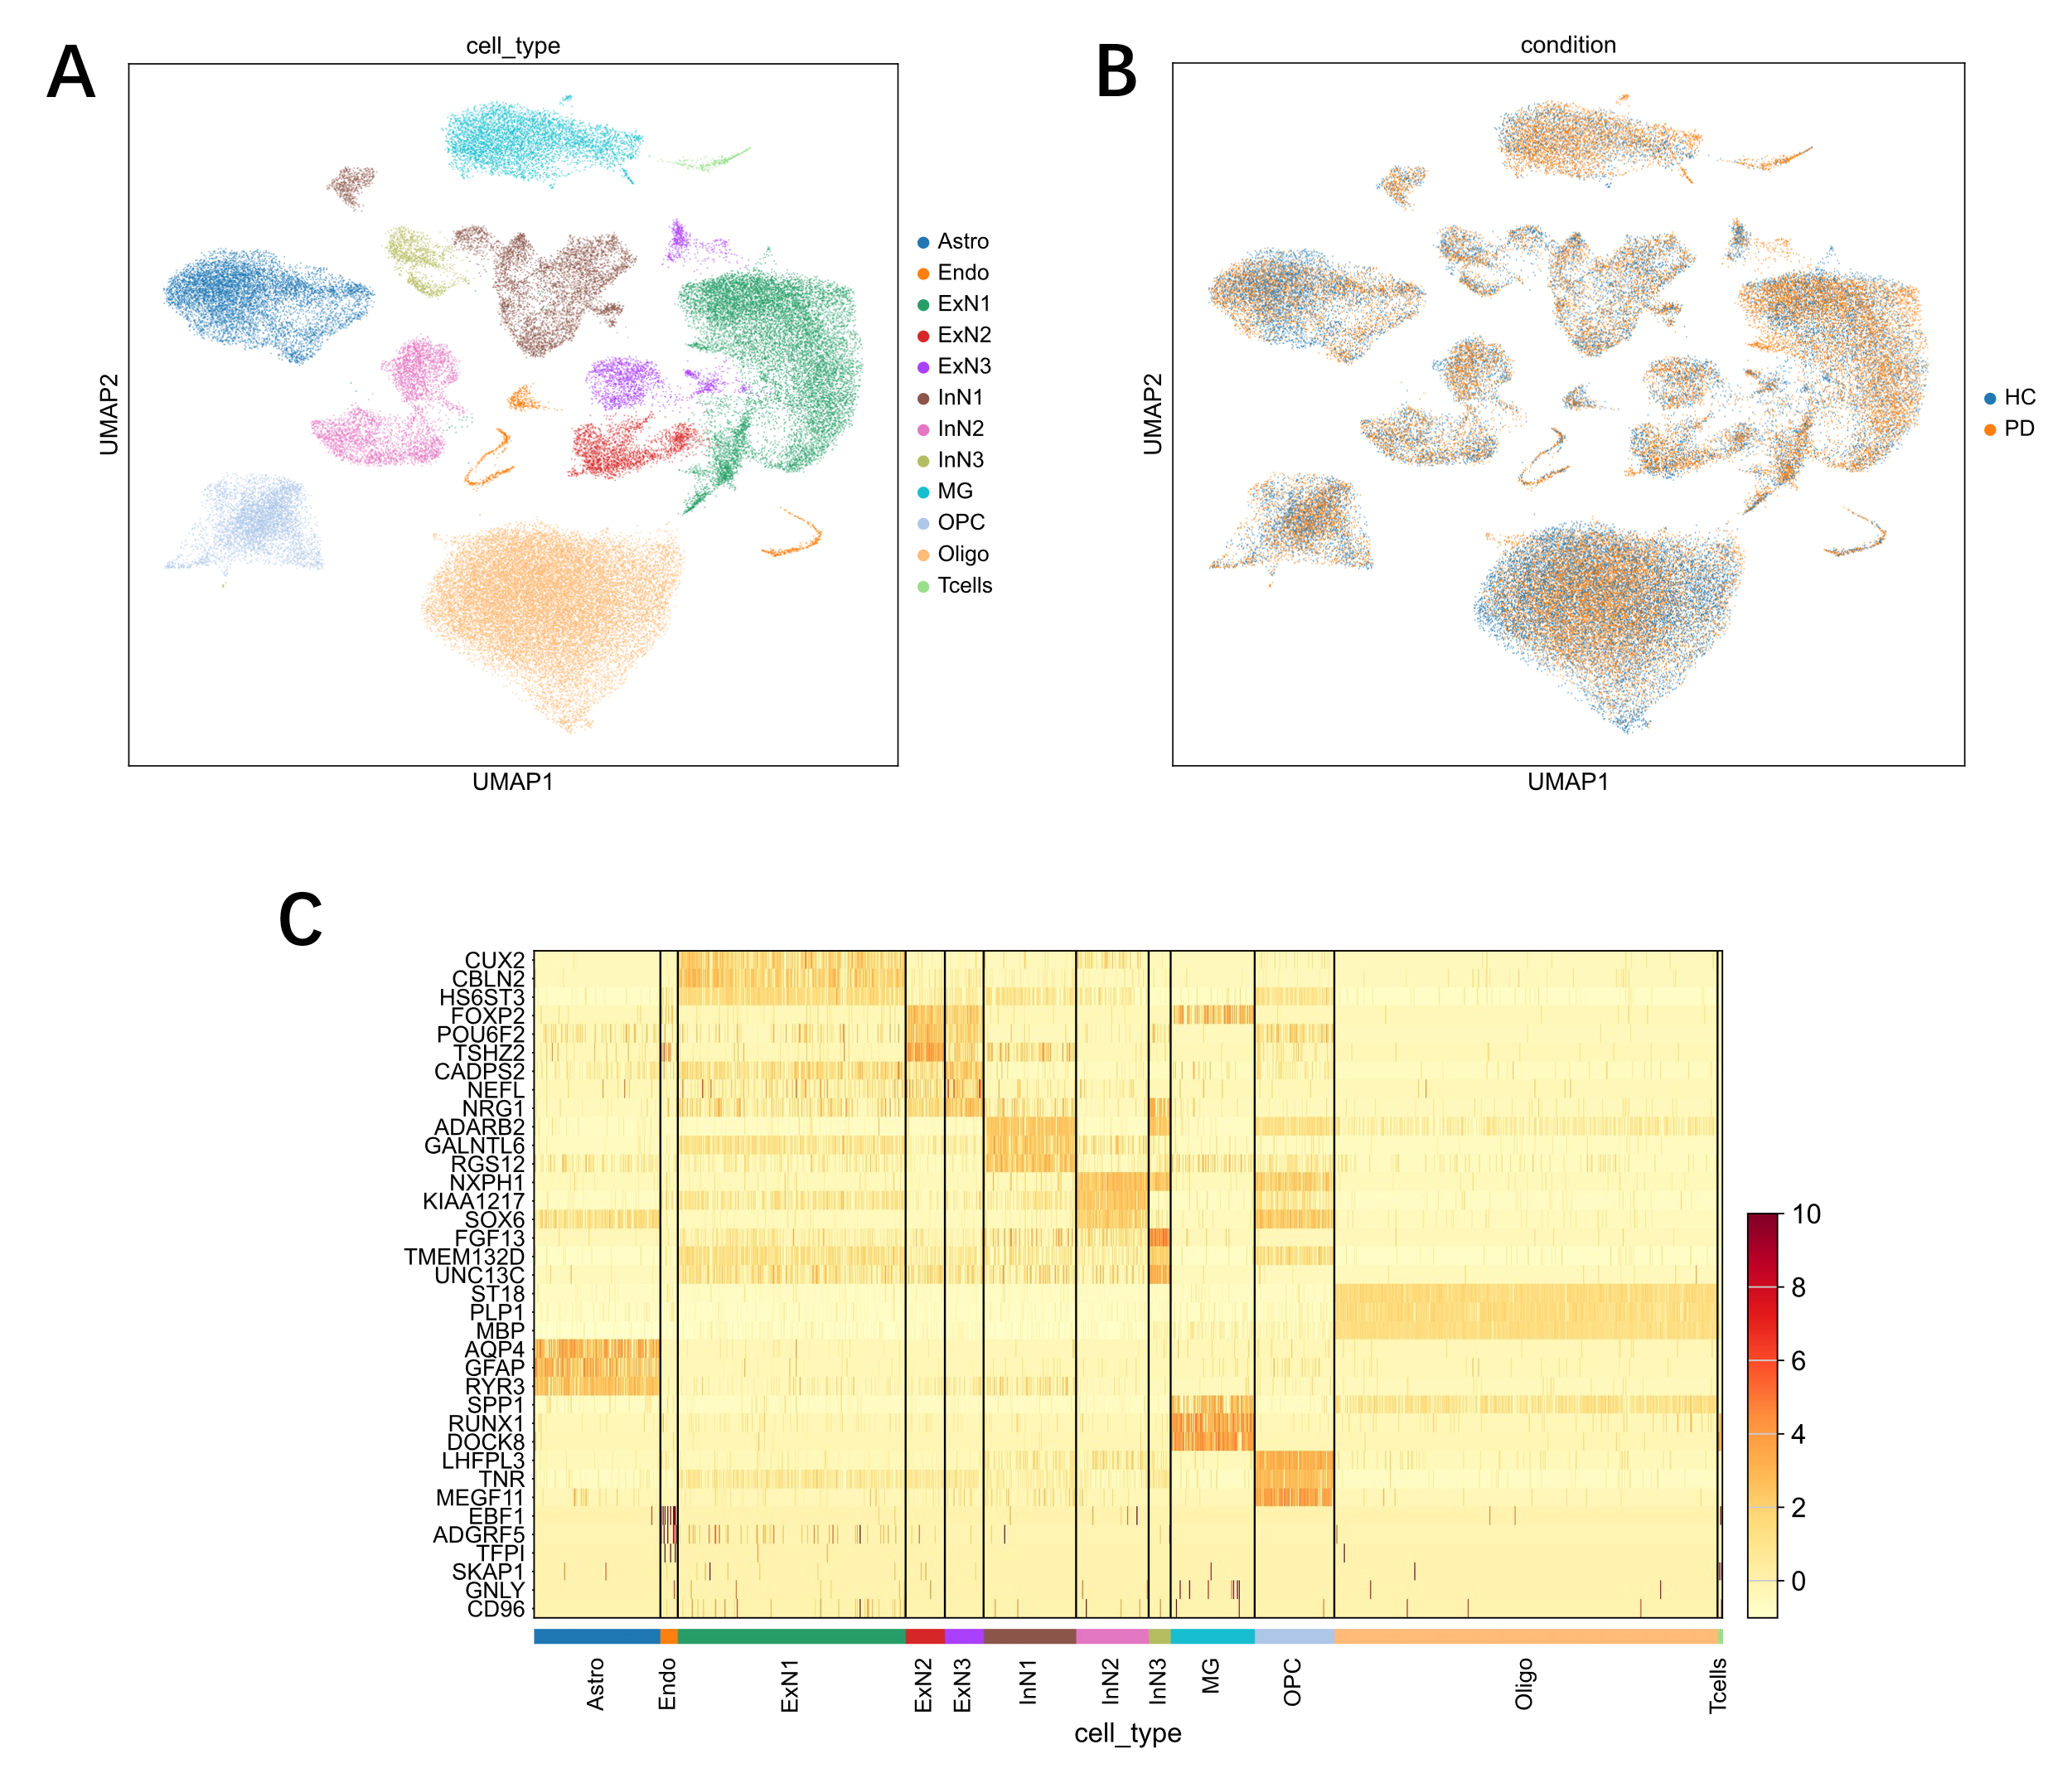
The single-cell RNA sequencing dataset was processed as the author described in the original paper to visualize the cellular composition of the prefrontal cortex tissue samples [5]. Uniform Manifold Approximation and Projection (UMAP) revealed distinct clusters corresponding to eight major brain cell types, including neuronal and glial populations (Fig. 1A). Critically, cells from both Health Control (HC) and Parkinson's Disease (PD) donors were evenly distributed across the UMAP projection, indicating that there were no significant batch effects and that the dataset was suitable for comparative analysis (Fig. 1B). The cell type annotations were validated by the specific expression of known marker genes for each cluster (Fig. 1C).
3.2. Decreased NEFL expression in a subset of excitatory neurons in Parkinson's Disease
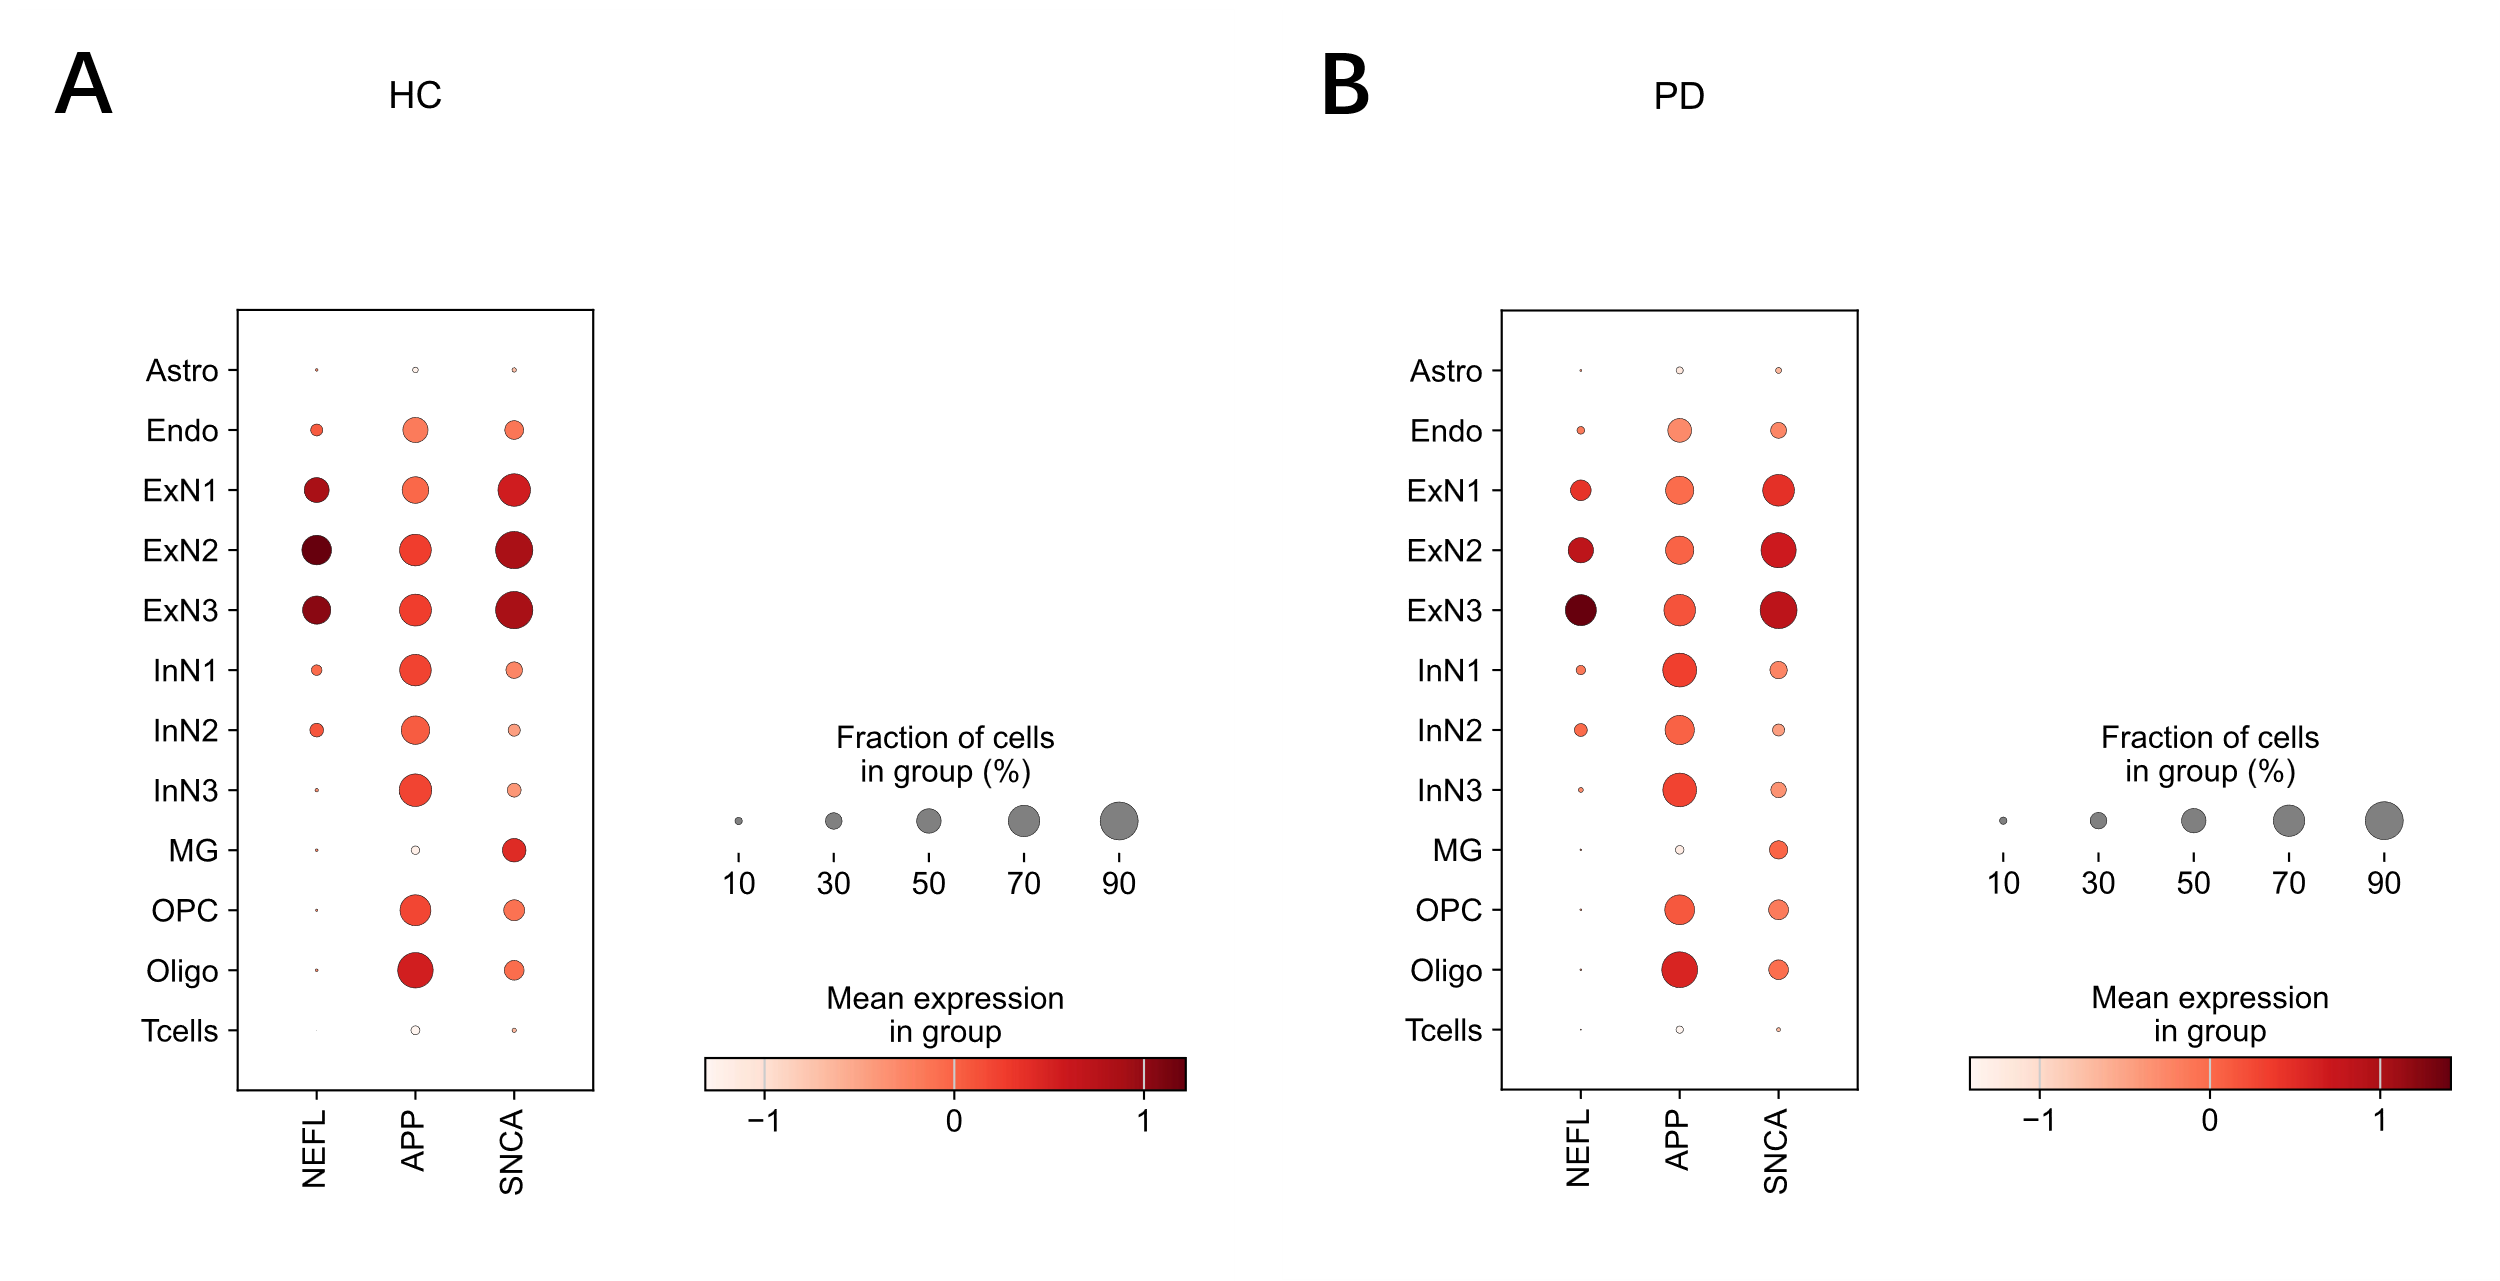
To assess changes in gene expression, the levels of SNCA, APP, and NEFL were compared between HC and PD cohorts across all cell types (Fig. 2). While the expression of SNCA and APP remained broadly comparable between the two conditions, a notable difference was observed for NEFL. Specifically, the expression of NEFL was significantly reduced in the excitatory neuron subtypes ExN1 and ExN2 in the PD brain compared to the HC brain (Fig 2, A and B). This reduction was evident in both the mean expression level (color intensity) and the fraction of cells expressing the gene (dot size).
3.3. Parkinson's Disease is characterized by rewired gene co-expression networks
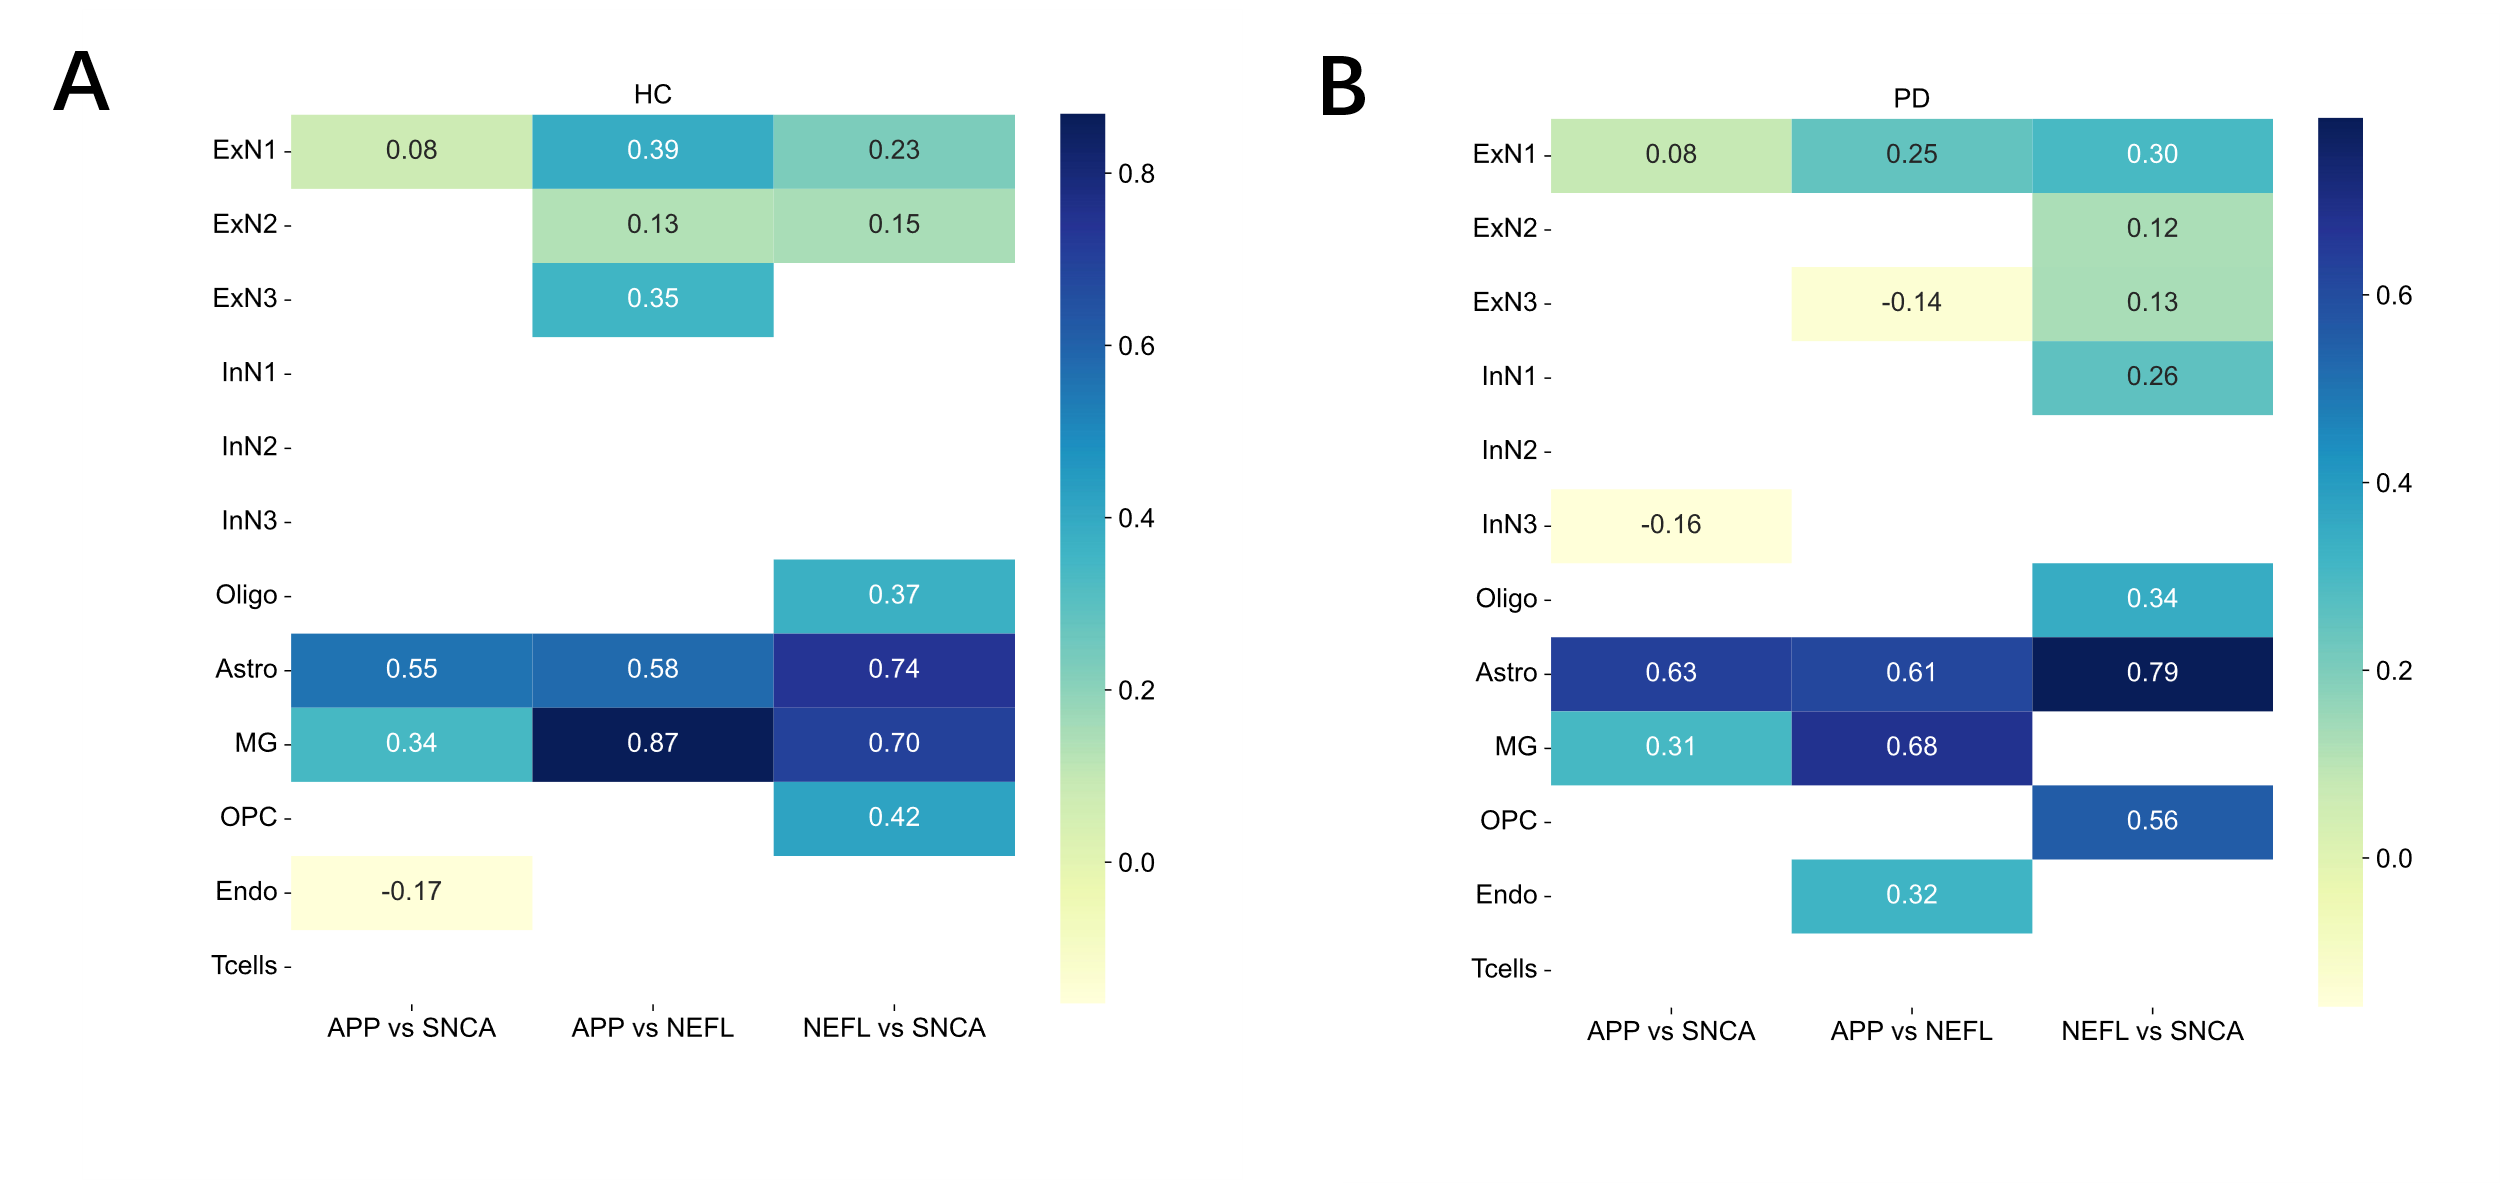
The co-expression relationships between the three genes were quantified using Pearson correlation and compared between conditions (Fig. 3). The analysis revealed a substantial rewiring of gene correlation networks in the PD brain. In astrocytes (Astro), the correlations involving SNCA were stronger in PD than in HC; for instance, the NEFL vs SNCA correlation increased from r = 0.74 in HC to r = 0.79 in PD. Conversely, a dramatic loss of correlation was observed in microglia (MG), where the strong positive correlation between NEFL and SNCA in HC (r = 0.70) was nearly absent in PD (r = 0.33). Furthermore, a strong positive correlation between APP and SNCA (r = 0.68) emerged in T-cells in the PD cohort, a relationship that was not observed in the HC group.
4. Discussion
This study reveals a complex transcriptomic landscape in the PD prefrontal cortex, characterized by the specific downregulation of neuronal NEFL and a large-scale, cell-type-specific rewiring of a gene network implicated in neurodegeneration. The observed reduction of NEFL transcripts within a subset of excitatory neurons provides a potential cellular mechanism underlying a key clinical biomarker of PD. As NEFL encodes a critical neurofilament protein required for cytoskeletal integrity, its transcriptional downregulation is indicative of neuronal stress and compromised structural maintenance [6]. This finding is consistent with extensive clinical evidence of elevated NF-L protein in the cerebrospinal fluid of PD patients, as structurally compromised neurons are known to release their contents into the extracellular space [7].Our data thus link the clinical biomarker to a specific transcriptomic event within a vulnerable neuronal population.
The extensive remodeling of gene co-expression networks, particularly within glial cells, suggests a shift in cellular state toward a reactive, disease-associated phenotype. The altered correlations in astrocytes and microglia indicate that SNCA, APP, and NEFL may be integrated into coordinated neuroinflammatory or stress-response pathways that are activated during the disease process [8]. This network-level reorganization suggests that the functional consequence of these genes in PD is context-dependent and driven by the reactive state of their cellular environment.
It is important to acknowledge the limitations of this study. The analysis was conducted on a cohort of twelve individuals. While this is typical for single-cell studies, the inherent genetic and environmental variation across human samples may limit the generalizability of our findings. Furthermore, the cohort was matched for sex to reduce variability, which means these results may not be directly applicable to both sexes without further validation. Finally, single-cell transcriptomic data can be sparse; for some cell types, the low fraction of cells expressing the target genes may affect the statistical power of the correlation analyses, warranting caution in their interpretation.
In conclusion, this work demonstrates that the transcriptomic signature of PD extends beyond simple changes in gene expression to include a fundamental reorganization of regulatory networks. The data highlight the dual pathology of neuronal dysfunction and a concerted reactive gliosis, offering insights that may inform the development of both cell-type-specific therapeutic strategies and more refined, systems-level diagnostic biomarkers.
5. Conclusion
This study utilized single-cell transcriptomics to investigate cell-type-specific gene expression changes in the prefrontal cortex of individuals with Parkinson's Disease (PD). Our analysis revealed two primary findings. First, we identified a significant downregulation of NEFL gene expression specifically within excitatory neuron populations in the PD brain compared to healthy controls (HC). Second, we uncovered a substantial, cell-type-specific remodeling of the co-expression network between SNCA, APP, and NEFL, most prominently in glial cells such as astrocytes and microglia.
These results provide critical insights into the molecular underpinnings of PD. The reduction in neuronal NEFL offers a cellular mechanism for the elevated levels of neurofilament light chain protein observed clinically in the cerebrospinal fluid of PD patients, linking a transcriptomic event to a key biomarker of neurodegeneration. The profound rewiring of gene correlations in glial cells underscores the active role of neuroinflammation in the disease, suggesting these genes become part of a coordinated, reactive cellular program.
Future research should aim to validate these transcriptomic findings at the protein level and employ functional studies to determine the pathological consequences of these altered gene networks. Ultimately, this work highlights the necessity of a cell-type-specific approach to understanding PD and suggests that targeting these altered cellular networks could offer new avenues for diagnostics and therapeutic intervention.
References
[1]. Hague SM. Neurodegenerative disorders: Parkinson’s disease and Huntington’s disease. J Neurol Neurosurg Psychiatry. 2005; 76(8): 1058-1063. doi: 10.1136/jnnp.2004.060186
[2]. Becker G, Müller A, Braune S, et al. Early diagnosis of Parkinson’s disease. J Neurol. 2002; 249(0): 1-1. doi: 10.1007/s00415-002-1309-9
[3]. Xiang C, Cong S, Tan X, et al. A meta-analysis of the diagnostic utility of biomarkers in cerebrospinal fluid in Parkinson’s disease. Npj Park Dis. 2022; 8(1): 165. doi: 10.1038/s41531-022-00431-7
[4]. Ding J, Adiconis X, Simmons SK, et al. Systematic comparison of single-cell and single-nucleus RNA-sequencing methods. Nat Biotechnol. 2020; 38(6): 737-746. doi: 10.1038/s41587-020-0465-8
[5]. Zhu B, Park JM, Coffey SR, et al. Single-cell transcriptomic and proteomic analysis of Parkinson’s disease brains. Sci Transl Med. 2024; 16(771): eabo1997. doi: 10.1126/scitranslmed.abo1997
[6]. Yuan A, Rao MV, Veeranna, Nixon RA. Neurofilaments and Neurofilament Proteins in Health and Disease. Cold Spring Harb Perspect Biol. 2017; 9(4): a018309. doi: 10.1101/cshperspect.a018309
[7]. Yuan A, Nixon RA. Neurofilament Proteins as Biomarkers to Monitor Neurological Diseases and the Efficacy of Therapies. Front Neurosci. 2021; 15: 689938. doi: 10.3389/fnins.2021.689938
[8]. Toader C, Tataru CP, Munteanu O, et al. Decoding Neurodegeneration: A Review of Molecular Mechanisms and Therapeutic Advances in Alzheimer’s, Parkinson’s, and ALS. Int J Mol Sci. 2024; 25(23): 12613. doi: 10.3390/ijms252312613
Cite this article
Jiang,T. (2025). Altered Gene Co-expression Landscapes in the Parkinson's Disease Brain at Single-Nucleus Resolution. Theoretical and Natural Science,137,102-107.
Data availability
The datasets used and/or analyzed during the current study will be available from the authors upon reasonable request.
Disclaimer/Publisher's Note
The statements, opinions and data contained in all publications are solely those of the individual author(s) and contributor(s) and not of EWA Publishing and/or the editor(s). EWA Publishing and/or the editor(s) disclaim responsibility for any injury to people or property resulting from any ideas, methods, instructions or products referred to in the content.
About volume
Volume title: Proceedings of ICBioMed 2025 Symposium: AI for Healthcare: Advanced Medical Data Analytics and Smart Rehabilitation
© 2024 by the author(s). Licensee EWA Publishing, Oxford, UK. This article is an open access article distributed under the terms and
conditions of the Creative Commons Attribution (CC BY) license. Authors who
publish this series agree to the following terms:
1. Authors retain copyright and grant the series right of first publication with the work simultaneously licensed under a Creative Commons
Attribution License that allows others to share the work with an acknowledgment of the work's authorship and initial publication in this
series.
2. Authors are able to enter into separate, additional contractual arrangements for the non-exclusive distribution of the series's published
version of the work (e.g., post it to an institutional repository or publish it in a book), with an acknowledgment of its initial
publication in this series.
3. Authors are permitted and encouraged to post their work online (e.g., in institutional repositories or on their website) prior to and
during the submission process, as it can lead to productive exchanges, as well as earlier and greater citation of published work (See
Open access policy for details).
References
[1]. Hague SM. Neurodegenerative disorders: Parkinson’s disease and Huntington’s disease. J Neurol Neurosurg Psychiatry. 2005; 76(8): 1058-1063. doi: 10.1136/jnnp.2004.060186
[2]. Becker G, Müller A, Braune S, et al. Early diagnosis of Parkinson’s disease. J Neurol. 2002; 249(0): 1-1. doi: 10.1007/s00415-002-1309-9
[3]. Xiang C, Cong S, Tan X, et al. A meta-analysis of the diagnostic utility of biomarkers in cerebrospinal fluid in Parkinson’s disease. Npj Park Dis. 2022; 8(1): 165. doi: 10.1038/s41531-022-00431-7
[4]. Ding J, Adiconis X, Simmons SK, et al. Systematic comparison of single-cell and single-nucleus RNA-sequencing methods. Nat Biotechnol. 2020; 38(6): 737-746. doi: 10.1038/s41587-020-0465-8
[5]. Zhu B, Park JM, Coffey SR, et al. Single-cell transcriptomic and proteomic analysis of Parkinson’s disease brains. Sci Transl Med. 2024; 16(771): eabo1997. doi: 10.1126/scitranslmed.abo1997
[6]. Yuan A, Rao MV, Veeranna, Nixon RA. Neurofilaments and Neurofilament Proteins in Health and Disease. Cold Spring Harb Perspect Biol. 2017; 9(4): a018309. doi: 10.1101/cshperspect.a018309
[7]. Yuan A, Nixon RA. Neurofilament Proteins as Biomarkers to Monitor Neurological Diseases and the Efficacy of Therapies. Front Neurosci. 2021; 15: 689938. doi: 10.3389/fnins.2021.689938
[8]. Toader C, Tataru CP, Munteanu O, et al. Decoding Neurodegeneration: A Review of Molecular Mechanisms and Therapeutic Advances in Alzheimer’s, Parkinson’s, and ALS. Int J Mol Sci. 2024; 25(23): 12613. doi: 10.3390/ijms252312613