


1. Introduction
Inflammation reaction is a common pathophysiological process in various kinds of diseases, such as IgA vasculitis, wound infection, Alzheimer’s disease, and cancer [1-4]. Localizing the inflammation region offers critical clinical insights and facilitates accurate diagnosis and treatment. However, traditional histological analysis for inflammation is time-consuming, highly invasive, and lacks in situ information [5]. To address this limitation, a variety of imaging techniques, such as photoluminescent (PL) [6], positron emission tomography (PET) [7], ultrasonic (US) [8], and magnetic resonance imaging (MRI) [9] have been developed for in situ detection and monitoring of the inflammation region. Among these imaging techniques, MRI stands out as a safe and promising approach to imaging due to its noninvasive nature, unlimited tissue penetration, and high soft tissue resolution [10,11].
Magnetic resonance imaging (MRI) contrast agents are employed to enhance the contrast between inflamed and normal tissues by reduce relaxation time of protons in bulk water [12]. These agents are broadly classified into T1- and T2-weighted contrast agents based on their relaxation mechanisms [13]. Common T1-weighted agents include metal-based contrast agents such as manganese (Mn²⁺), iron (Fe³⁺), and gadolinium (Gd³⁺) [14-16], whereas T2 contrast agents are typically based on superparamagnetic iron oxide nanoparticles (SPIONPs) [17,18]. Notably, compared to T2 contrast agents, T1 contrast agents can produce brighter signals and provide more distinct contrast in MRI images in inflammation detection. Gd-based T1 contrast agents are widely used in clinical settings; however, they pose significant risks of toxicity, including neural and renal damage, especially at high doses [19,20]. In contrast, Fe-based contrast agents possess a similar electron configuration to Gd and are considered safer due to the natural abundance of iron in the body and their biocompatibility [21,22]. However, current research on Fe complexes focuses on structural modification and relaxation rate improvement, whereas major limitations are still present due to their poor targeting specificity to pathological sites and low signal-to-background ratio, hindering accurate MRI diagnoses [23-25].
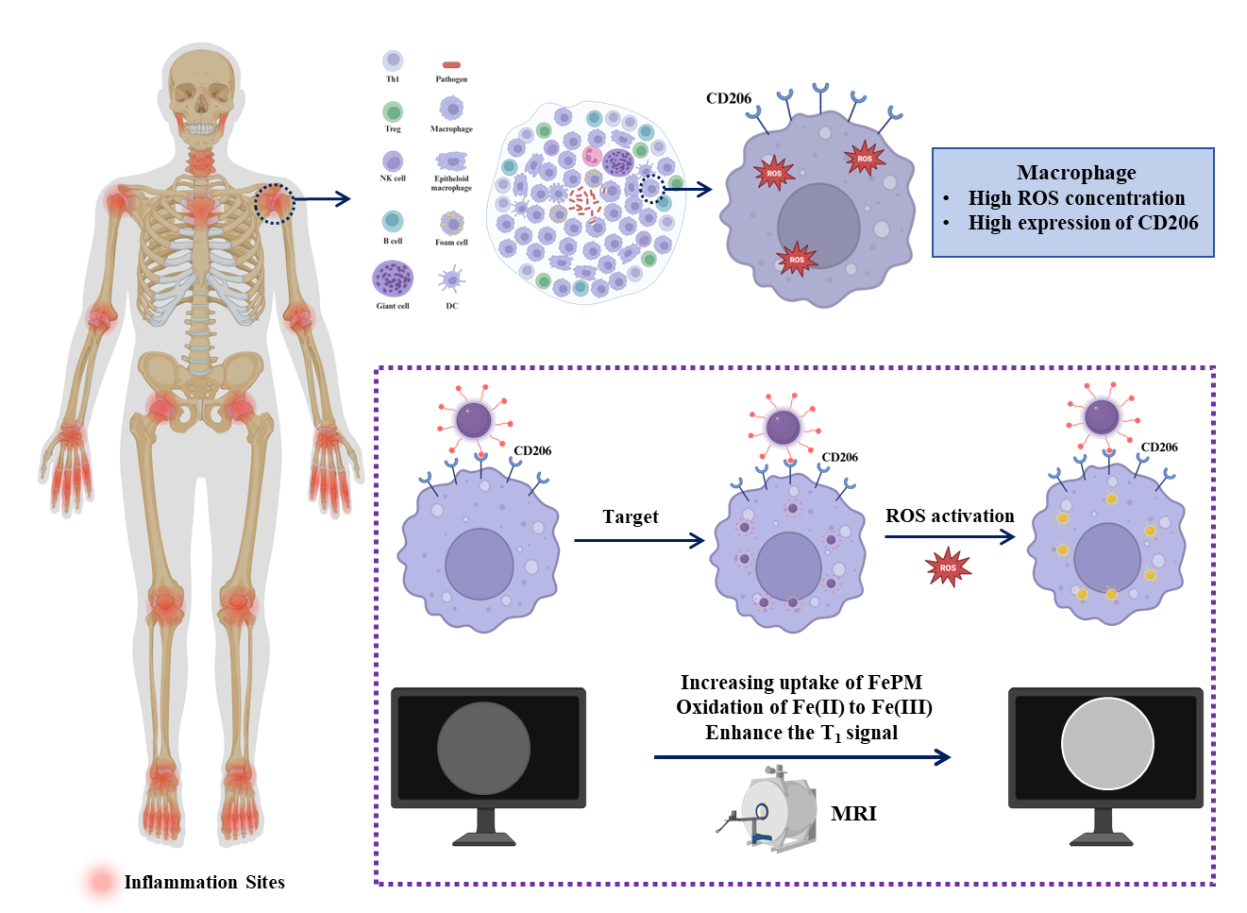
Reactive oxygen species (ROS)—such as superoxide (O₂⁻), hydrogen peroxide (H₂O₂), hydroxyl radicals (OH), and singlet oxygen (¹O₂)—are overproduced during inflammatory responses [26]. Specifically, macrophages, as a critical component of the innate immune system, are recruited to the inflammation region and actively produce significant amounts of ROS [27-30]. The ROS in macrophages is generated through two primary mechanisms: in the cytoplasm via NADPH oxidases and in the mitochondria via the electron transport chain (ETC) [31,33]. NADPH oxidases, located in the cytoplasmic membrane, catalyze the conversion of O2 to O2-, which subsequently forms H2O2. The production of ROS is amplified during inflammation due to increased phagocytosis, which elevates the number of NADPH oxidases. Additionally, mitochondrial ROS are produced through the ETC, particularly in complex IV, where electrons interact with hydrogen ions and O2 to generate H2O2. Therefore, developing probes that target ROS offers a promising approach for detecting active inflammatory regions in the body.
In this study, we prepared a ROS-responsive iron complex (FePM) as a T1-enhanced contrast agent, and the complex was synthesized by chelating Fe(II) with gallic acid (GA) and further functionalized with mannose to enable specific targeting of CD206 expressed on macrophage surfaces (Figure 1). PVP and PEG were also introduced to act as template agents and maintain stability, respectively. We first characterized the morphology and structural composition of FePM and investigated its ROS response in MRI. Furthermore, FePM demonstrated excellent biocompatibility and macrophage-specific targeting, highlighting its potential as an ideal MRI contrast agent for precise inflammation detection.
2. Experimental section
2.1. Materials
Iron(II) chloride tetrahydrate (FeCl₂·4H₂O, 99%) was obtained from Sigma-Aldrich. Polyvinylpyrrolidone (PVP, Mₙ ≈ 8000) was sourced from Ponsure Biotechnology. DOPA-PEG₂₀₀₀-FA (Mₙ ≈ 2000) was procured from Xi'an Ruixi Biological Technology. Gallic acid (GA, 98%) was purchased from Adamas-Beta. Cell culture reagents were acquired from Gibco. All chemicals were used as received without additional purification. CD206 antibody was purchased from Abcam. Donkey anti-rabbit secondary antibody 647 was purchased from ThermoFisher. 2′,7′-Dichlorodihydrofluorescein diacetate (DCFH-DA) was obtained from Beyotime Biotechnology.
2.2. Characterization
The morphological characteristics of the nanoparticles were examined using a Hitachi HT-7700 transmission electron microscope (TEM). Optical properties were assessed by recording ultraviolet-visible (UV-vis) absorption spectra on a Shimadzu UV-1280 spectrophotometer. For colloidal characterization, nanoparticle size distribution and surface charge (zeta potential) were determined through dynamic light scattering (DLS) measurements performed on a Malvern Nano-ZS 90 system. Chemical composition analysis was carried out by Fourier-transform infrared (FT-IR) spectroscopy (Thermo Scientific Nicolet 6700) using the potassium bromide pellet method. Magnetic resonance properties were evaluated in vitro with a 0.5 T NMR analyzer (GY-PNMR-10, Shanghai Huantong Corporation) to measure relaxation times and acquire MRI images. Quantitative iron analysis was performed via inductively coupled plasma mass spectrometry (ICP-MS, Thermo Fisher iCAP RQ). Cell viability was determined through CCK-8 assays measured on a Biotek Elx 800 microplate reader. Surface elemental composition and iron oxidation states were investigated using X-ray photoelectron spectroscopy (XPS, ThermoFisher Nexsa™).
2.3. Synthesis of FePM
The FePM complex was synthesized under inert nitrogen atmosphere to prevent oxidation. In a typical preparation, ferrous chloride monohydrate (FeCl2·H2O, 230 mg), polyvinylpyrrolidone (PVP, 800 mg), and DOPAC-mPEG2000-Mannose conjugate (100 mg) were dissolved in 40 mL of deionized water at ambient temperature (25°C) with constant magnetic stirring. After homogenizing the mixture for 5 minutes, a freshly prepared gallic acid (GA) solution (10 mL, 10 mg/mL in DI water) was introduced dropwise using a syringe pump at a rate of 2 mL/min. The reaction was allowed to proceed for 24 hours under continuous stirring to ensure complete complex formation. The crude product was then purified through multiple washing cycles with deionized water, followed by concentration using centrifugal ultrafiltration (100 kDa molecular weight cutoff membrane) at 6000 rpm for 5 minutes per cycle. The purified FePM nanocomplex was finally collected and stored under refrigeration at 4°C for further characterization and application.
2.4. Longitudinal relaxation analysis
The MRI properties of FePM were evaluated before and after ROS activation by measuring the longitudinal relaxation time (T1) at various Fe concentrations (0–0.5 mM) using a 0.5 T MRI system. For ROS-treated samples, solutions were incubated with 100 μM H2O2 (2 h, 37°C) prior to analysis. Then, H2O2 (10 mM) was added into another aqueous solution with the same set of concentrations of Fe. After 30 min of incubation, the NPs were tested with the same categories as the set mentioned above. The r₁ relaxivity of FePM was determined from the slope of 1/T₁ versus Fe concentration plots, both before and after treatment with 10 mM H₂O₂ (Equation 1).
Equation 1. The longitudinal relaxivity (r₁) was calculated according to Equation 1, where T₁,₀ denotes the intrinsic longitudinal relaxation time of the pure solvent system measured in the absence of FePM, and [C] represents the molar concentration of iron in the FePM complex. The r₁ value (in mM⁻¹s⁻¹) was determined from the slope of the linear plot of 1/T₁ versus [C].
2.5. Cell culturing
For cellular experiments, RAW 264.7 murine macrophages (CD206-positive cells) and human umbilical vein endothelial cells (HUVECs, CD206-negative control) were obtained from the National Collection of Authenticated Cell Cultures. The RAW 264.7 cell line was selected as it abundantly expresses the mannose receptor CD206 on its surface membrane, while HUVECs exhibit only basal CD206 expression levels. Both cell lines were maintained in Dulbecco's Modified Eagle Medium (DMEM) supplemented with 10% fetal bovine serum (FBS) and 1% penicillin-streptomycin antibiotic mixture, and cultured at 37°C in a humidified 5% CO₂ atmosphere.
2.6. CD206 expression
For immunofluorescence analysis, RAW 264.7 macrophages and HUVECs were separately seeded in confocal-compatible dishes and cultured for 12 hours at 37°C. After PBS washing, cells were fixed with 4% PFA for 15 min, then blocked with 3% BSA for 1 hour. Samples were incubated with anti-CD206 primary antibody (1:50) overnight at 4°C, followed by fluorescent secondary antibodies (1:200) for 30 min in the dark. Nuclei were stained with DAPI (1 μg/mL) for 5 min before confocal imaging.
2.7. In vitro, ROS assay
To detect intracellular ROS, RAW 264.7 macrophages and HUVECs were separately seeded in confocal-compatible dishes and cultured overnight at 37°C with 5% CO₂. After PBS washing, cells were incubated with 10 μM DCFH-DA in serum-free medium for 30 min at 37°C. Following additional PBS washes to remove excess probe, live-cell confocal imaging was performed immediately. Fluorescence intensity was quantified to compare ROS levels between cell types.
2.8. Cell prussian blue stain
Raw 264.7 cells were placed in a 24-well plate, each well containing 4×10⁴ RAW 264.7 cells. The cells were cultured overnight. Medium containing FePM was then added to the experimental group. After incubating for an additional 12 h, the medium containing the FePM was removed with a pipette. Following PBS washing, cells were fixed using 4% paraformaldehyde (PFA) for 30 min at room temperature. After PFA removal and subsequent PBS rinsing, Prussian blue staining solution was applied. The samples were protected from light and maintained at room temperature for 30 min to allow complete staining. Final PBS washes were performed prior to microscopic observation.
2.9. ICP-MS
Aqua Regia was first prepared by mixing 1 part of nitric acid and 3 parts of hydrochloric acid. The mixture was left to react for at least 30 minutes. Meanwhile, the cells were cultured in eight petri dishes (diameter = 10 cm). Four of the Petri dishes were supplemented with FePM, while the other four served as control groups without FePM. After the cells reached a density of 70-80%, FePM was added to the four experimental dishes, and fresh medium was added to the control dishes. The cells were then cultured for 12 h. The medium in the eight Petri dishes was removed using a pipette, and the dishes were washed with PBS to remove any remaining FePM on the cell membranes or dish walls. In each petri dish, trypsin was added to digest cells and to remove them from the dish walls for 1-2 minutes. Medium containing FBS (3 mL) was then added to the eight dishes to stop cell digestion. The cells were mixed with a pipette, and the eight petri dishes were transferred into eight centrifuge tubes. The cells were centrifuged for 4 minutes at 1000 rpm. The 4 mL mixture of medium and FBS was removed from each centrifuge tube and replaced with PBS. The cells were counted through a hemocytometer. For each of the eight tubes, 10 μL of the cell solution was added onto the hemocytometer. The cells with PBS in the eight tubes were centrifuged again. The PBS was then removed through a pipette, and the prepared Agua Reiga (200 μL) was added into each of the eight tubes and cultured for 12 h. DI water (4800 μL) was finally added to the eight tubes. The 5 mL solution was mixed using a pipette and filtered through a filter (hole diameter = 0.45 μm). The concentration of iron components in the filtered solution was measured.
2.10. Preparation of cell sample for TEM
1. Sample pre-treatment: The cells were collected in 3 petri dishes (diameter = 10 cm). FePM was added to the cell samples, and the medium was removed through a pipette. After the petri dishes were washed with PBS on ice, trypsin was added to digest the cells for 1-2 minutes. Medium containing FBS was then added to the Petri dishes to stop digestion. The cells were centrifuged at 4 °C to obtain the cell precipitates. After removing the medium/FBS mixture by centrifugation, the cell pellets were resuspended in fresh PBS. Primary fixation was performed using 2.5% glutaraldehyde in PBS for 1 h at room temperature, followed by PBS washing. Secondary fixation was then carried out with 1% osmium tetroxide for 1 h at 4°C. Finally, the samples underwent three PBS washing cycles (5 min each) to remove residual fixatives.
2. Dehydration and transition: The cells were immersed in ethanol solutions with gradiented concentrations (30%, 50%, 70%, 90%, 100%), each time for 10-15 minutes. The 100% ethanol was performed twice.
3. Embedding and polymerization: The dehydrated cells were first immersed in a 1:1 solution of Propylene oxide and resin (Epon 812 + DDSA + MNA + DMP-30). The cells were then placed in an embedding mold, and fresh resin was added. The resin was then allowed to solidify in a 60 °C oven.
4. Ultra-thin sectioning: An Ultramicrotome was used to slice through the resin until cell samples were visible. Ultra-thin sections (50-70 nm) were then obtained and placed on copper grids for TEM observation. For visible samples under the microscope, the samples were dyed with Uranyl Acetate at room temperature for 15-30 minutes and then with Lead Citrate for 5 minutes. The cells were finally washed with water.
5. Microscopy observation: The dyed cells were observed through TEM.
2.11. Cytotoxicity assay
RAW 264.7 macrophages and HUVECs were plated in 96-well plates at optimal densities and cultured for 12 h under standard conditions (37°C, 5% CO₂). After reaching logarithmic growth, the cells were incubated with FePM at graded concentrations (0.26, 0.40, 0.59, 0.89, 1.33, and 2.0 mM) in complete medium for 24 h. Viability was then quantified with the CCK-8 assay by adding 10 μL of reagent per well and incubating for 2 h at 37°C. Absorbance was read at 450 nm using a microplate reader, using untreated cells as controls.
2.12. In vitro MRI studies
For in vitro MRI characterization, FePM was diluted in either deionized water or 10 mM H₂O₂ to form a concentration series (0.075–1.2 mM). After incubation at 37 °C for 2 h, T₁-weighted images were acquired using a 0.5 T NMR analyzer with a spin-echo sequence (TR = 500.0 ms, TE = 134 ms, NS = 1).
To evaluate the contrast enhancement in macrophages, Raw 264.7 cells were treated with 1 mM FePM (iron basis) for 2 h. Human umbilical vein endothelial cells (HUVECs) subjected to the same treatment served as a control group, while untreated cells of both types were used as blanks. After incubation, all cells were harvested and imaged at 35 °C under identical NMR conditions and acquisition parameters.
3. Results and discussion
3.1. Characterization of FePM
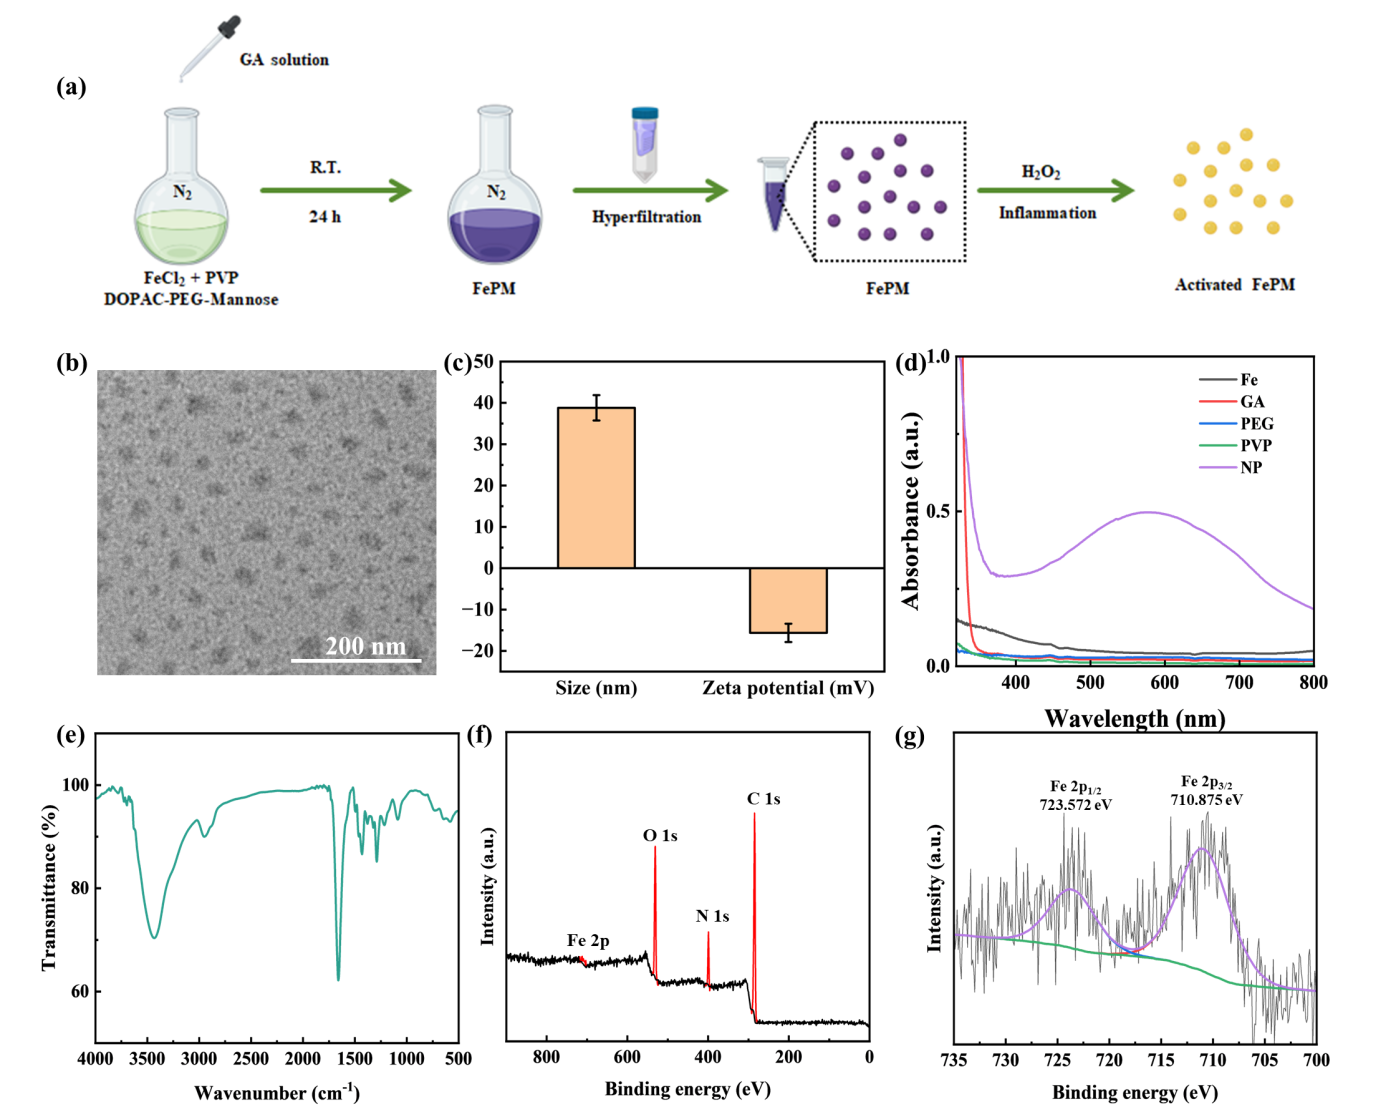
The FePM preparation process is shown in Figure 2a. GA solution was added dropwise into the mixture of FeCl2·4H2O, PVP, and DOPC-mPEG2000-Mannose to form a Fe complex, where GA stabilized the structure of the Fe ion and enhanced its coordination. During the reaction process, the PVP served as a template agent that regulated the over-growth of the NP; PEG not only connected the Fe ion to the contrast agent and increased the NP’s biocompatibility and solubility, but also enabled the NP to target macrophages via terminal mannose which can bind to CD206 located on the membrane surface of macrophages.
We systematically characterized the structural and physicochemical properties of the synthesized Fe complex using multiple analytical techniques. Transmission electron microscopy (TEM) analysis revealed the nanoparticles exhibited a monodisperse spherical morphology with an average diameter of 30 nm (Figure 2b). Dynamic light scattering (DLS) measurements showed an increased hydrodynamic diameter of 38.81 ± 3.25 nm (Figure 2c), which can be attributed to the hydration layer surrounding the hydrophilic PEG coating. The negative zeta potential of -15 mV further confirmed the presence of surface PEG molecules (Figure 2c).
FT-IR spectroscopy demonstrated successful incorporation of gallic acid (GA), as evidenced by the characteristic carbonyl stretching vibration at 1659 cm⁻¹ (Figure 2e). UV-Vis spectroscopy revealed a distinct ligand-to-metal charge transfer (LMCT) band at 590 nm (Figure 2d), confirming effective coordination between GA and Fe(II) centers. X-ray photoelectron spectroscopy (XPS) analysis verified the presence of Fe²⁺ species in the nanoparticles (Figures 2f and 2g).
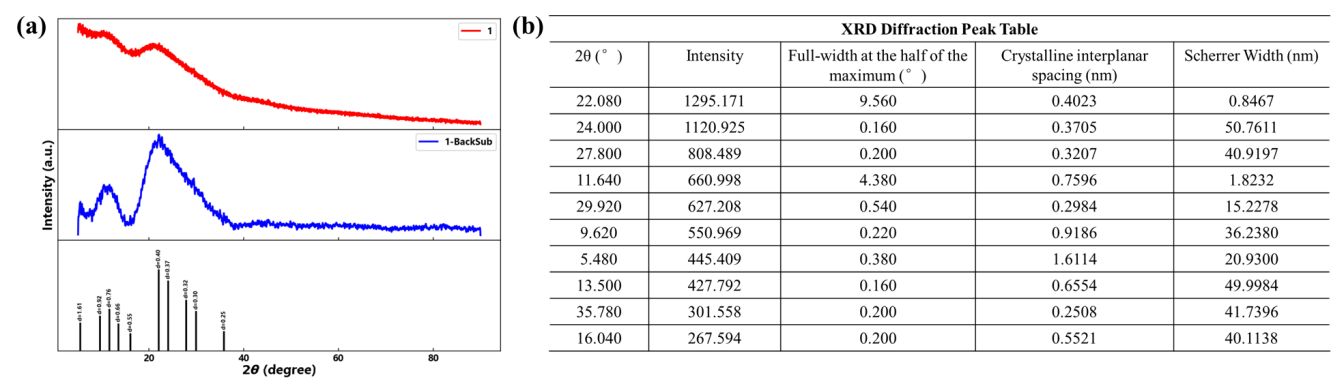
X-ray diffraction (XRD) analysis confirmed the crystalline nature of FePM, with characteristic diffraction peaks observed at 2θ values of 5.48°, 9.62°, 11.64°, 13.5°, 16.04°, 22.08°, 24°, 27.8°, 29.92°, and 35.78° (Figure 3). These well-defined diffraction peaks indicate the formation of an ordered crystal structure.
3.2. Longitudinal relaxation analysis
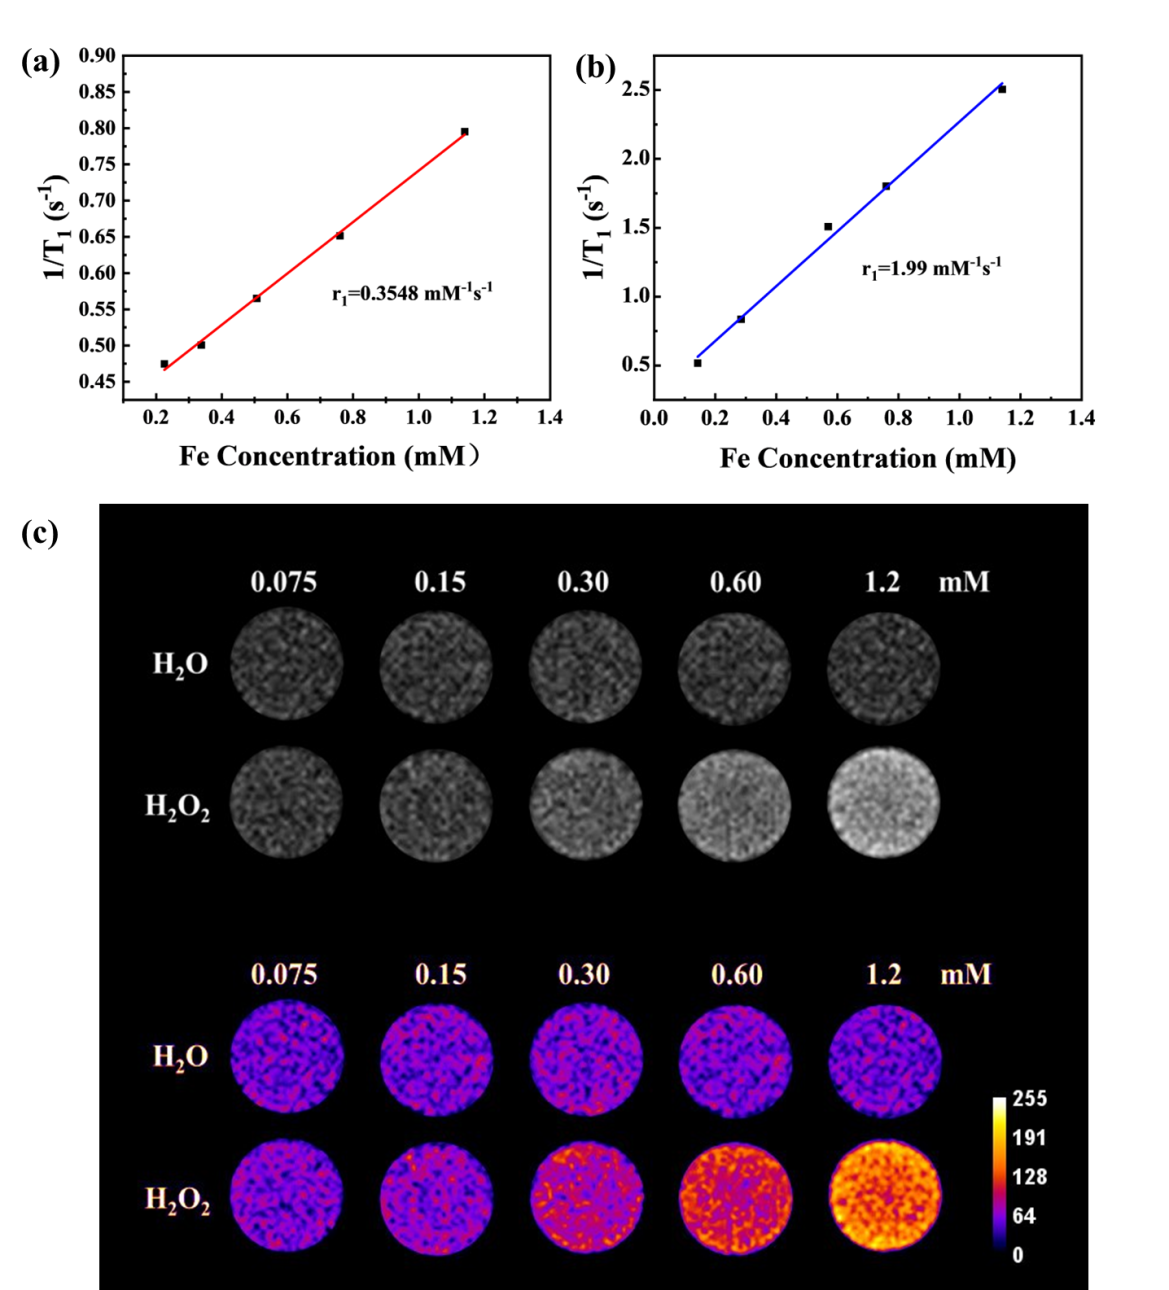
To determine whether the FePM could serve as a ROS-responsive T1 enhanced contrast agent, both the longitudinal relaxivity (r1) and T1-weighted MRI before and after the activation of H2O2 solution was evaluated on a 0.5 T MRI scanner. As shown in Figure 4a and 4b, after ROS activation, the r1 of Fe complex was 1.99 mM s-1, which was 5.6 times higher than the complex before ROS interaction. This difference may be attributed to the increased electron spin after the oxidation of Fe(II) to Fe(III). The FePM displayed minimal signal enhancement along with Fe concentration increase without ROS-induced activation (Figure 4c). After oxidation by H2O2, the T1-weighted images of the FePM showed a dose-dependent increase in the signal intensity along with Fe concentration. At the same concentration, FePM showed substantially higher signal intensity in the presence of H2O2 compared to in the absence of H2O2.
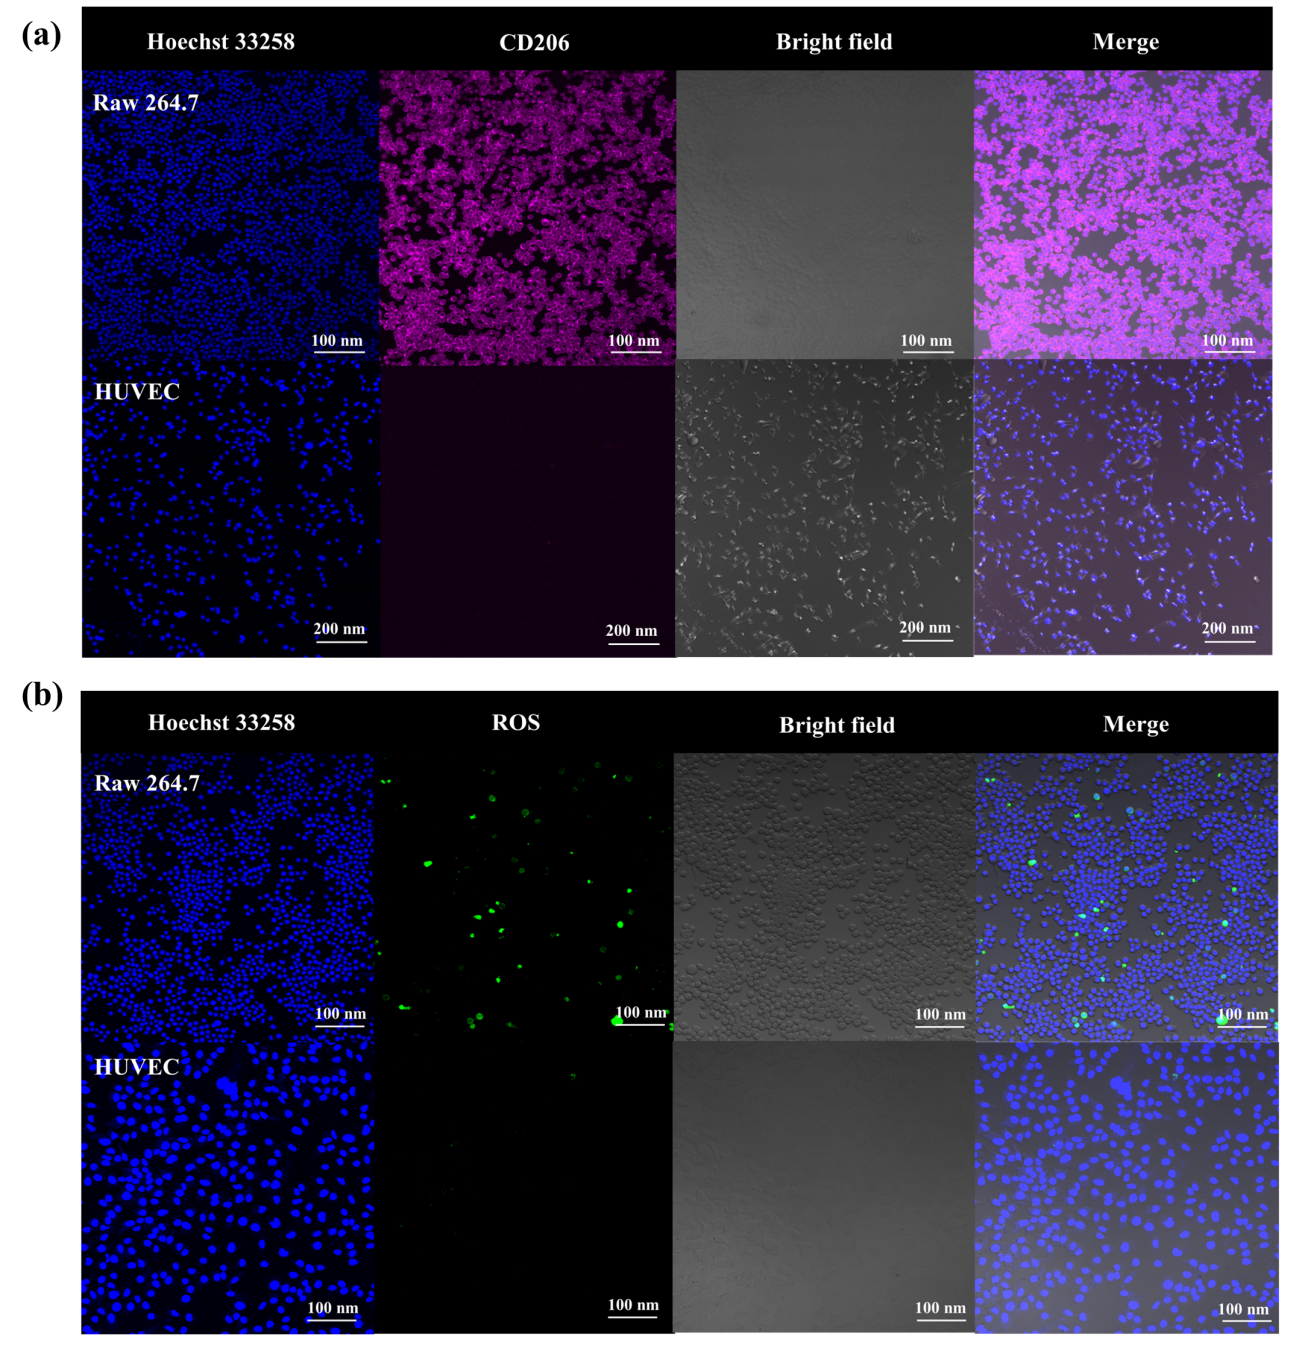
3.3. CD206 expression and ROS detection in macrophages
Immunofluorescence was used to examine the level of CD206 expression on macrophages. Compared with HUVEC (human umbilical vein endothelial cell), RAW 264.7 cells (a murine macrophage-like cell line) exhibited a higher signal of CD206 on the membrane (Figure 5a). Moreover, a considerably upregulated level of ROS could be observed in the Raw 264.7 cells but not in HUVEC (Figure 5b).
3.4. Cellular uptake of FePM NPs
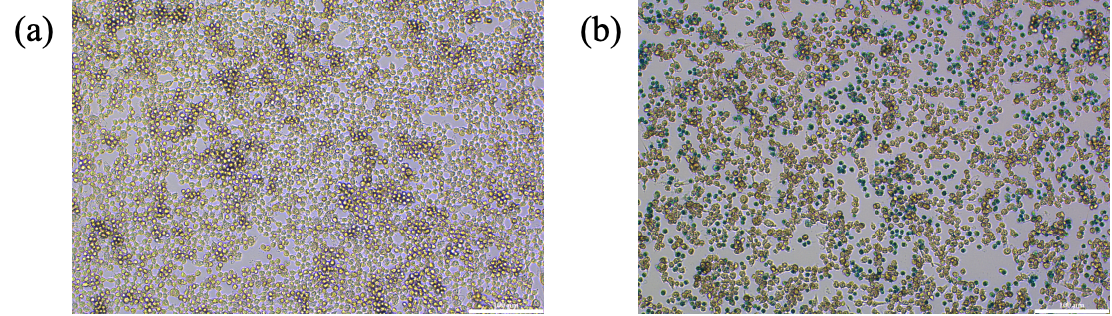
Prussian Blue Dye is a standard method to locate iron element contents within a cell. Under acidic environments, potassium hexacyanoferrate (II) and iron ions form a blue precipitate (Prussian blue). Prussian blue dye was used to stain two samples of Raw 264.7, with and without the presence of FePM nanoparticles. We then assessed the intake of FePM NPs in the macrophage. Compared to the control group (Figure 6a), the experimental group treated with FePM (Figure 6b) displayed blue dots resulting from the iron reaction, confirming the macrophage uptake of FePM NPs.
3.5. Quantitative analysis
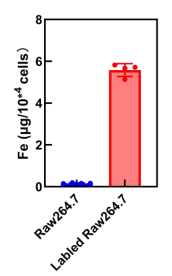
ICP-MS was used to provide accurate quantitative analysis of iron ion levels in RAW 264.7 cells. As shown in Figure 7, the iron concentration (≈6 µg/104 cells) for RAW264.7 cells labeled by FePM was significantly higher than those without labeling (≈0).
3.6. Cell transmission electron microscopy
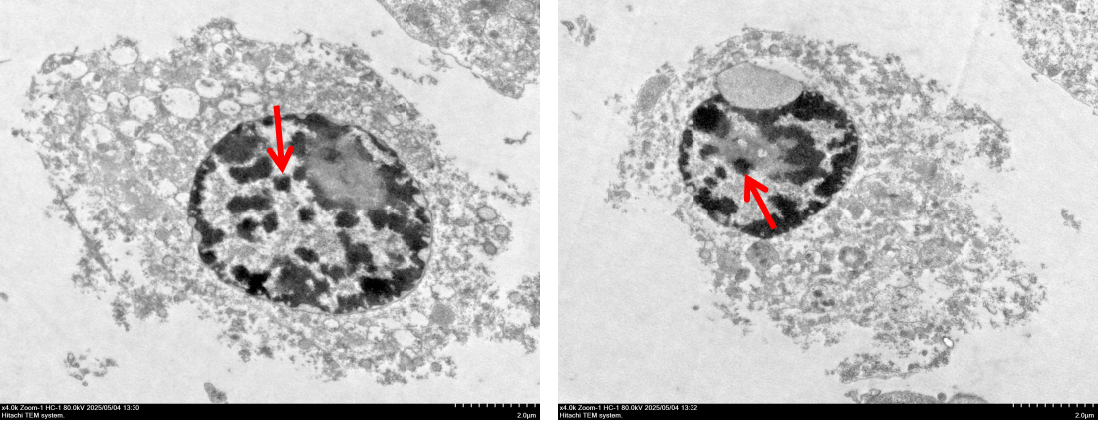
To confirm the presence of FePM in cells after absorption, transmission electron microscopy (TEM) was used to visualize the distribution and dispersion of FePM within the cell. TEM images of the RAW 264.7 cell clearly showed FePM uptake (Figure 8). Notably, the NPs were observed to cluster in the cytoplasm rather than the cell membrane.
3.7. Cytotoxicity
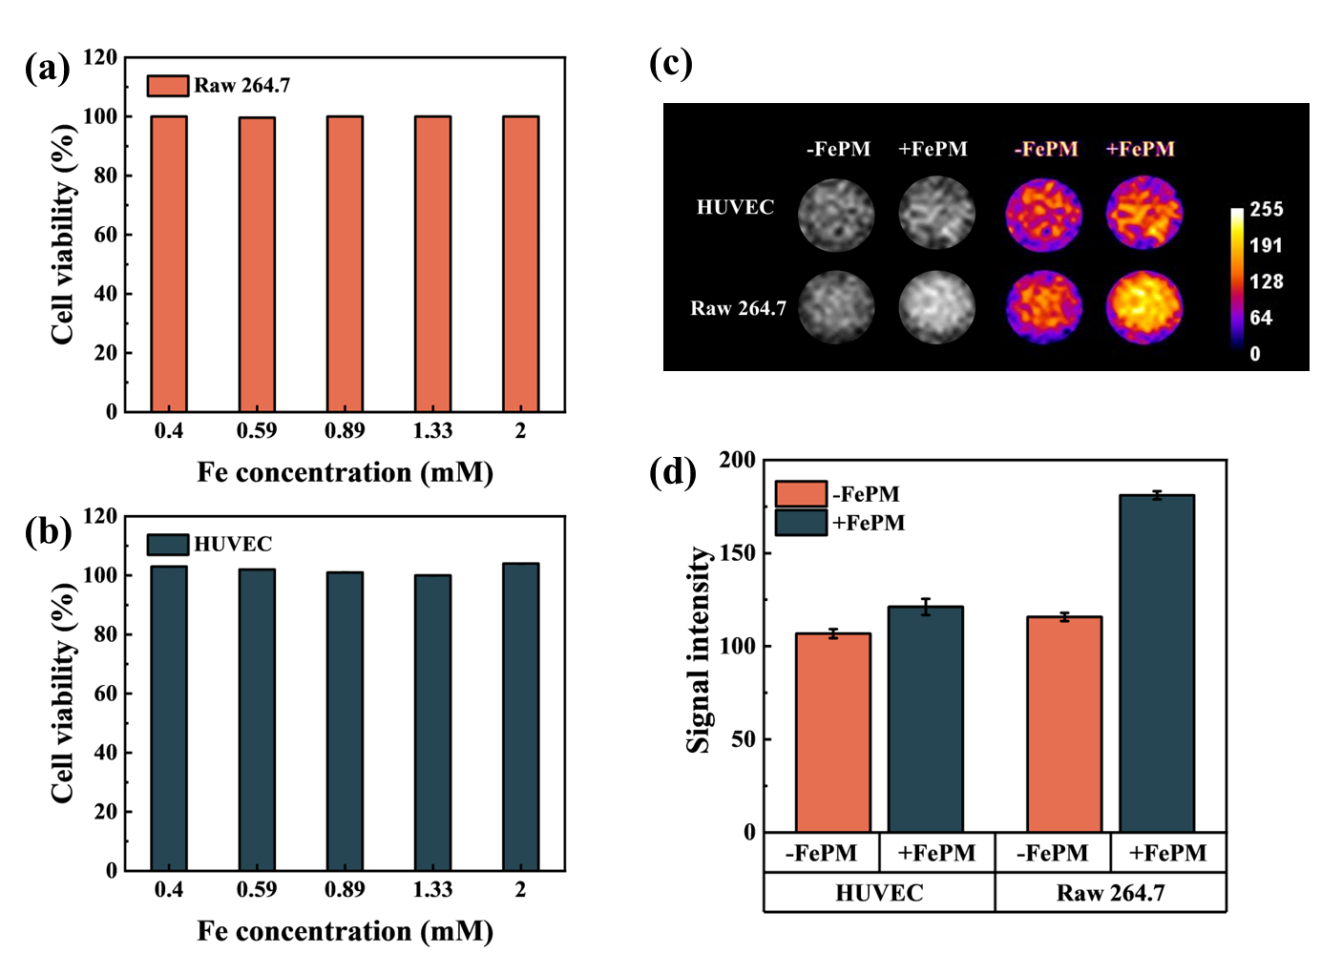
We then tested the biocompatibility of FePM by performing a cytotoxicity test on RAW 264.7 cells and HUVEC. As shown in Figure 9a and 9b, the FePM displayed no apparent toxicity to RAW 264.7 cells and HUVEC, even at Fe concentrations up to 2 mM.
3.8. In vitro MRI
To verify the MRI signal enhancing effect, the T1-weighted MRI images of RAW 264.7 cells and HUVEC treated with FePM NPs were obtained. The MRI signal intensity was significantly enhanced in FePM-treated cells compared to untreated controls (Figure 9c), confirming its efficacy as a contrast agent. In particular, the FePM NPs resulted in a more significant signal enhancement in RAW 264.7 cells compared to the HUVEC. Quantitative analyses (Figure 9d) revealed that the signal intensity of RAW 264.7 cells incubated with FePM increased by 30% and 80% compared to the HUVEC and non-treated cells, respectively. This may be attributed to both the mannose-mediated targeting strategy and the higher ROS levels in macrophages.
4. Conclusions
We have designed and synthesized FePM, a novel ROS-responsive and macrophage-targeting iron-based T1 MRI contrast agent, for inflammation imaging. By integrating Fe(II)-gallic acid coordination with mannose-mediated targeting of CD206 on macrophage surface, FePM remains MRI-silent under physiological conditions but exhibits a 5.6-fold increase in T1 relaxivity upon ROS-triggered oxidation to Fe(III) in inflammatory microenvironments. In vitro experiments demonstrated enhanced MRI signal in macrophages, minimal cytotoxicity, and specific cellular uptake, collectively confirming FePM’s potential in imflammation imaging. These results highlight FePM as a promising candidate for sensitive and precise inflammation detection, paving the way for its further translation in clinical MRI diagnostics.
References
[1]. Pillebout, E.; Sunderkötter, C. In IgA vasculitis, Seminars in immunopathology, Springer: 2021; pp 729-738.
[2]. LeBert, D. C.; Huttenlocher, A. In Inflammation and wound repair, Seminars in immunology, Elsevier: 2014; pp 315-320.
[3]. Coussens, L. M.; Werb, Z., Inflammation and cancer. Nature 2002, 420 (6917), 860-867.
[4]. Holmes, C., Systemic inflammation and A lzheimer’s disease. Neuropathology and applied neurobiology 2013, 39 (1), 51-68.
[5]. Zhao, M.; Wang, R.; Li, B.; Fan, Y.; Wu, Y.; Zhu, X.; Zhang, F., Precise in vivo inflammation imaging using in situ responsive cross‐linking of glutathione‐modified ultra‐small NIR‐II lanthanide nanoparticles. Angewandte Chemie 2019, 131 (7), 2072-2076.
[6]. Liu, Q.; Zhong, Y.; Su, Y.; Zhao, L.; Peng, J., Real-time imaging of hepatic inflammation using hydrogen sulfide-activatable second near-infrared luminescent nanoprobes. Nano Letters 2021, 21 (11), 4606-4614.
[7]. Tarkin, J. M.; Joshi, F. R.; Rudd, J. H., PET imaging of inflammation in atherosclerosis. Nature Reviews Cardiology 2014, 11 (8), 443-457.
[8]. Lindner, J. R.; Song, J.; Xu, F.; Klibanov, A. L.; Singbartl, K.; Ley, K.; Kaul, S., Noninvasive ultrasound imaging of inflammation using microbubbles targeted to activated leukocytes. Circulation 2000, 102 (22), 2745-2750.
[9]. Stoll, G.; Bendszus, M., Imaging of inflammation in the peripheral and central nervous system by magnetic resonance imaging. Neuroscience 2009, 158 (3), 1151-1160.
[10]. Lazovic, J.; Goering, E.; Wild, A. M.; Schützendübe, P.; Shiva, A.; Löffler, J.; Winter, G.; Sitti, M., Nanodiamond‐Enhanced Magnetic Resonance Imaging. Advanced Materials 2024, 36 (11), 2310109.
[11]. Schramm, S.; Börner, C.; Reichert, M.; Baum, T.; Zimmer, C.; Heinen, F.; Bonfert, M. V.; Sollmann, N., Functional magnetic resonance imaging in migraine: A systematic review. Cephalalgia 2023, 43 (2), 03331024221128278.
[12]. Xiao, Y.-D.; Paudel, R.; Liu, J.; Ma, C.; Zhang, Z.-S.; Zhou, S.-K., MRI contrast agents: Classification and application. International journal of molecular medicine 2016, 38 (5), 1319-1326.
[13]. Estelrich, J.; Sánchez-Martín, M. J.; Busquets, M. A., Nanoparticles in magnetic resonance imaging: from simple to dual contrast agents. International journal of nanomedicine 2015, 1727-1741.
[14]. Cheng, Z.; Thorek, D. L.; Tsourkas, A., Gd-conjugated dendrimer nanoclusters as a tumor-targeted T1 magnetic resonance imaging contrast agent. Angewandte Chemie (International ed. in English) 2010, 49 (2), 346.
[15]. Pan, D.; Schmieder, A. H.; Wickline, S. A.; Lanza, G. M., Manganese-based MRI contrast agents: past, present, and future. Tetrahedron 2011, 67 (44), 8431-8444.
[16]. Snyder, E. M.; Asik, D.; Abozeid, S. M.; Burgio, A.; Bateman, G.; Turowski, S. G.; Spernyak, J. A.; Morrow, J. R., A class of FeIII macrocyclic complexes with alcohol donor groups as effective T1 MRI contrast agents. Angewandte Chemie 2020, 132 (6), 2435-2440.
[17]. Sousa, F.; Sanavio, B.; Saccani, A.; Tang, Y.; Zucca, I.; Carney, T. M.; Mastropietro, A.; Jacob Silva, P. H.; Carney, R. P.; Schenk, K., Superparamagnetic nanoparticles as high efficiency magnetic resonance imaging T2 contrast agent. Bioconjugate chemistry 2017, 28 (1), 161-170.
[18]. Hong, S.; Chang, Y.; Rhee, I., Chitosan-coated ferrite (Fe3O4) nanoparticles as a T2 contrast agent for magnetic resonance imaging. J. Korean Phys. Soc 2010, 56 (3), 868-873.
[19]. Iyad, N.; Ahmad, M. S.; Alkhatib, S. G.; Hjouj, M., Gadolinium contrast agents-challenges and opportunities of a multidisciplinary approach: Literature review. European Journal of Radiology Open 2023, 11, 100503.
[20]. Coimbra, S.; Rocha, S.; Sousa, N. R.; Catarino, C.; Belo, L.; Bronze-da-Rocha, E.; Valente, M. J.; Santos-Silva, A., Toxicity Mechanisms of Gadolinium and Gadolinium-Based Contrast Agents—A Review. International Journal of Molecular Sciences 2024, 25 (7), 4071.
[21]. Uzal-Varela, R.; Lucio-Martínez, F.; Nucera, A.; Botta, M.; Esteban-Gómez, D.; Valencia, L.; Rodríguez-Rodríguez, A.; Platas-Iglesias, C., A systematic investigation of the NMR relaxation properties of Fe (III)-EDTA derivatives and their potential as MRI contrast agents. Inorganic Chemistry Frontiers 2023, 10 (5), 1633-1649.
[22]. Yan, J.; Lu, Z.; Xu, M.; Liu, J.; Zhang, Y.; Yin, J.; Cao, Y.; Pei, R., A tumor-targeting and ROS-responsive iron-based T 1 magnetic resonance imaging contrast agent for highly specific tumor imaging. Journal of Materials Chemistry B 2023, 11 (14), 3176-3185.
[23]. Baranyai, Z.; Carniato, F.; Nucera, A.; Horváth, D.; Tei, L.; Platas-Iglesias, C.; Botta, M., Defining the conditions for the development of the emerging class of Fe III-based MRI contrast agents. Chemical Science 2021, 12 (33), 11138-11145.
[24]. Chen, S.; An, L.; Yang, S., Low-molecular-weight Fe (III) complexes for MRI contrast agents. Molecules 2022, 27 (14), 4573.
[25]. Kuźnik, N.; Wyskocka, M., Iron (III) contrast agent candidates for MRI: a survey of the structure–effect relationship in the last 15 years of studies. European Journal of Inorganic Chemistry 2016, 2016 (4), 445-458.
[26]. Chelombitko, M., Role of reactive oxygen species in inflammation: a minireview. Moscow University Biological Sciences Bulletin 2018, 73, 199-202.
[27]. Fujiwara, N.; Kobayashi, K., Macrophages in inflammation. Current Drug Targets-Inflammation & Allergy 2005, 4 (3), 281-286.
[28]. Lee, C.-H.; Choi, E. Y., Macrophages and inflammation. Journal of Rheumatic Diseases 2018, 25 (1), 11-18.
[29]. Liu, Y.-C.; Zou, X.-B.; Chai, Y.-F.; Yao, Y.-M., Macrophage polarization in inflammatory diseases. International journal of biological sciences 2014, 10 (5), 520.
[30]. Murray, P. J., Macrophage polarization. Annual review of physiology 2017, 79 (1), 541-566.
[31]. Lambeth, J. D., NOX enzymes and the biology of reactive oxygen. Nature Reviews Immunology 2004, 4 (3), 181-189.
[32]. Brandes, R. P.; Weissmann, N.; Schröder, K., Nox family NADPH oxidases: molecular mechanisms of activation. Free Radical Biology and Medicine 2014, 76, 208-226.
[33]. Turrens, J. F., Mitochondrial formation of reactive oxygen species. The Journal of physiology 2003, 552 (2), 335-344.
Cite this article
Li,J. (2025). A Macrophages-Targeting and ROS-Responsive Iron-Based T1Magnetic Resonance Imaging Contrast Agent for Inflammation Imaging. Theoretical and Natural Science,137,130-142.
Data availability
The datasets used and/or analyzed during the current study will be available from the authors upon reasonable request.
Disclaimer/Publisher's Note
The statements, opinions and data contained in all publications are solely those of the individual author(s) and contributor(s) and not of EWA Publishing and/or the editor(s). EWA Publishing and/or the editor(s) disclaim responsibility for any injury to people or property resulting from any ideas, methods, instructions or products referred to in the content.
About volume
Volume title: Proceedings of ICBioMed 2025 Symposium: AI for Healthcare: Advanced Medical Data Analytics and Smart Rehabilitation
© 2024 by the author(s). Licensee EWA Publishing, Oxford, UK. This article is an open access article distributed under the terms and
conditions of the Creative Commons Attribution (CC BY) license. Authors who
publish this series agree to the following terms:
1. Authors retain copyright and grant the series right of first publication with the work simultaneously licensed under a Creative Commons
Attribution License that allows others to share the work with an acknowledgment of the work's authorship and initial publication in this
series.
2. Authors are able to enter into separate, additional contractual arrangements for the non-exclusive distribution of the series's published
version of the work (e.g., post it to an institutional repository or publish it in a book), with an acknowledgment of its initial
publication in this series.
3. Authors are permitted and encouraged to post their work online (e.g., in institutional repositories or on their website) prior to and
during the submission process, as it can lead to productive exchanges, as well as earlier and greater citation of published work (See
Open access policy for details).
References
[1]. Pillebout, E.; Sunderkötter, C. In IgA vasculitis, Seminars in immunopathology, Springer: 2021; pp 729-738.
[2]. LeBert, D. C.; Huttenlocher, A. In Inflammation and wound repair, Seminars in immunology, Elsevier: 2014; pp 315-320.
[3]. Coussens, L. M.; Werb, Z., Inflammation and cancer. Nature 2002, 420 (6917), 860-867.
[4]. Holmes, C., Systemic inflammation and A lzheimer’s disease. Neuropathology and applied neurobiology 2013, 39 (1), 51-68.
[5]. Zhao, M.; Wang, R.; Li, B.; Fan, Y.; Wu, Y.; Zhu, X.; Zhang, F., Precise in vivo inflammation imaging using in situ responsive cross‐linking of glutathione‐modified ultra‐small NIR‐II lanthanide nanoparticles. Angewandte Chemie 2019, 131 (7), 2072-2076.
[6]. Liu, Q.; Zhong, Y.; Su, Y.; Zhao, L.; Peng, J., Real-time imaging of hepatic inflammation using hydrogen sulfide-activatable second near-infrared luminescent nanoprobes. Nano Letters 2021, 21 (11), 4606-4614.
[7]. Tarkin, J. M.; Joshi, F. R.; Rudd, J. H., PET imaging of inflammation in atherosclerosis. Nature Reviews Cardiology 2014, 11 (8), 443-457.
[8]. Lindner, J. R.; Song, J.; Xu, F.; Klibanov, A. L.; Singbartl, K.; Ley, K.; Kaul, S., Noninvasive ultrasound imaging of inflammation using microbubbles targeted to activated leukocytes. Circulation 2000, 102 (22), 2745-2750.
[9]. Stoll, G.; Bendszus, M., Imaging of inflammation in the peripheral and central nervous system by magnetic resonance imaging. Neuroscience 2009, 158 (3), 1151-1160.
[10]. Lazovic, J.; Goering, E.; Wild, A. M.; Schützendübe, P.; Shiva, A.; Löffler, J.; Winter, G.; Sitti, M., Nanodiamond‐Enhanced Magnetic Resonance Imaging. Advanced Materials 2024, 36 (11), 2310109.
[11]. Schramm, S.; Börner, C.; Reichert, M.; Baum, T.; Zimmer, C.; Heinen, F.; Bonfert, M. V.; Sollmann, N., Functional magnetic resonance imaging in migraine: A systematic review. Cephalalgia 2023, 43 (2), 03331024221128278.
[12]. Xiao, Y.-D.; Paudel, R.; Liu, J.; Ma, C.; Zhang, Z.-S.; Zhou, S.-K., MRI contrast agents: Classification and application. International journal of molecular medicine 2016, 38 (5), 1319-1326.
[13]. Estelrich, J.; Sánchez-Martín, M. J.; Busquets, M. A., Nanoparticles in magnetic resonance imaging: from simple to dual contrast agents. International journal of nanomedicine 2015, 1727-1741.
[14]. Cheng, Z.; Thorek, D. L.; Tsourkas, A., Gd-conjugated dendrimer nanoclusters as a tumor-targeted T1 magnetic resonance imaging contrast agent. Angewandte Chemie (International ed. in English) 2010, 49 (2), 346.
[15]. Pan, D.; Schmieder, A. H.; Wickline, S. A.; Lanza, G. M., Manganese-based MRI contrast agents: past, present, and future. Tetrahedron 2011, 67 (44), 8431-8444.
[16]. Snyder, E. M.; Asik, D.; Abozeid, S. M.; Burgio, A.; Bateman, G.; Turowski, S. G.; Spernyak, J. A.; Morrow, J. R., A class of FeIII macrocyclic complexes with alcohol donor groups as effective T1 MRI contrast agents. Angewandte Chemie 2020, 132 (6), 2435-2440.
[17]. Sousa, F.; Sanavio, B.; Saccani, A.; Tang, Y.; Zucca, I.; Carney, T. M.; Mastropietro, A.; Jacob Silva, P. H.; Carney, R. P.; Schenk, K., Superparamagnetic nanoparticles as high efficiency magnetic resonance imaging T2 contrast agent. Bioconjugate chemistry 2017, 28 (1), 161-170.
[18]. Hong, S.; Chang, Y.; Rhee, I., Chitosan-coated ferrite (Fe3O4) nanoparticles as a T2 contrast agent for magnetic resonance imaging. J. Korean Phys. Soc 2010, 56 (3), 868-873.
[19]. Iyad, N.; Ahmad, M. S.; Alkhatib, S. G.; Hjouj, M., Gadolinium contrast agents-challenges and opportunities of a multidisciplinary approach: Literature review. European Journal of Radiology Open 2023, 11, 100503.
[20]. Coimbra, S.; Rocha, S.; Sousa, N. R.; Catarino, C.; Belo, L.; Bronze-da-Rocha, E.; Valente, M. J.; Santos-Silva, A., Toxicity Mechanisms of Gadolinium and Gadolinium-Based Contrast Agents—A Review. International Journal of Molecular Sciences 2024, 25 (7), 4071.
[21]. Uzal-Varela, R.; Lucio-Martínez, F.; Nucera, A.; Botta, M.; Esteban-Gómez, D.; Valencia, L.; Rodríguez-Rodríguez, A.; Platas-Iglesias, C., A systematic investigation of the NMR relaxation properties of Fe (III)-EDTA derivatives and their potential as MRI contrast agents. Inorganic Chemistry Frontiers 2023, 10 (5), 1633-1649.
[22]. Yan, J.; Lu, Z.; Xu, M.; Liu, J.; Zhang, Y.; Yin, J.; Cao, Y.; Pei, R., A tumor-targeting and ROS-responsive iron-based T 1 magnetic resonance imaging contrast agent for highly specific tumor imaging. Journal of Materials Chemistry B 2023, 11 (14), 3176-3185.
[23]. Baranyai, Z.; Carniato, F.; Nucera, A.; Horváth, D.; Tei, L.; Platas-Iglesias, C.; Botta, M., Defining the conditions for the development of the emerging class of Fe III-based MRI contrast agents. Chemical Science 2021, 12 (33), 11138-11145.
[24]. Chen, S.; An, L.; Yang, S., Low-molecular-weight Fe (III) complexes for MRI contrast agents. Molecules 2022, 27 (14), 4573.
[25]. Kuźnik, N.; Wyskocka, M., Iron (III) contrast agent candidates for MRI: a survey of the structure–effect relationship in the last 15 years of studies. European Journal of Inorganic Chemistry 2016, 2016 (4), 445-458.
[26]. Chelombitko, M., Role of reactive oxygen species in inflammation: a minireview. Moscow University Biological Sciences Bulletin 2018, 73, 199-202.
[27]. Fujiwara, N.; Kobayashi, K., Macrophages in inflammation. Current Drug Targets-Inflammation & Allergy 2005, 4 (3), 281-286.
[28]. Lee, C.-H.; Choi, E. Y., Macrophages and inflammation. Journal of Rheumatic Diseases 2018, 25 (1), 11-18.
[29]. Liu, Y.-C.; Zou, X.-B.; Chai, Y.-F.; Yao, Y.-M., Macrophage polarization in inflammatory diseases. International journal of biological sciences 2014, 10 (5), 520.
[30]. Murray, P. J., Macrophage polarization. Annual review of physiology 2017, 79 (1), 541-566.
[31]. Lambeth, J. D., NOX enzymes and the biology of reactive oxygen. Nature Reviews Immunology 2004, 4 (3), 181-189.
[32]. Brandes, R. P.; Weissmann, N.; Schröder, K., Nox family NADPH oxidases: molecular mechanisms of activation. Free Radical Biology and Medicine 2014, 76, 208-226.
[33]. Turrens, J. F., Mitochondrial formation of reactive oxygen species. The Journal of physiology 2003, 552 (2), 335-344.