


1. Introduction
The Alzheimer’s Disease (AD), broadly causing dementia among the elderly people, is a rapidly growing global health concern recognized by the World Health Organization (WHO), that has significant impacts for individuals and families worldwide [1,2]. In 1906, physician Alois Alzheimer’s discovery of a woman with memory loss and hallucinations marks the beginning of research into the disease that came to bear his name [3]. By the 1990s, Alzheimer’s disease was defined pathologically by the presence of amyloid plaques and neurofibrillary tangles at postmortem [4], although their role in disease still remained controversial at the time [5]. Later advanced biomarkers in fluid and imaging have facilitated the detection of these pathological markers in patients, including amyloid-β and tau [6]. The identification of amyloid-β in 1984 and tau in 1987 were major milestones in AD research, with amyloid-β buildup remaining central to the understanding of the disease and APP gene mutations linked to familial AD [7].
In 1993, researchers identified a version of APOE that critically increases the risk of developing late-onset Alzheimer’s disease [8]. The APOE gene, which encodes a protein involved in fat-binding metabolism in the brain, is recognized as a primary risk factor for the most common form of the disease [7]. APOE codes for apolipoprotein E (ApoE), a glycoprotein that binds to fatty substances such as cholesterol, and forms lipoprotein particles. This is substantial for redistributing cholesterol and other lipids throughout the brain [9]. As a key genetic risk factor for Alzheimer’s disease (AD), ApoE has three variants (ApoE2, ApoE3, and ApoE4) that affect AD risk differently [10]. ApoE4 increases the risk of AD by impairing amyloid-β clearance and causing microglial dysfunction, while ApoE2 is protective [11]. Research shows that individuals with two copies of ApoE4 are significantly more likely to develop AD, and those with two copies of ApoE2 have the lowest risk [12]. Meanwhile, the copies of ApoE4 gene person have may greatly affect the age of Alzheimer development [13].
The objective of this paper is to investigate the role of the ApoE4 variant in cell generation and degeneration within the context of Alzheimer’s Disease. By exploring its contribution to neurodegeneration, this research aims to enhance our understanding of how ApoE4 drives the progression of AD. Gaining insight into these mechanisms will not only provide a clearer picture of the genetic risk factors associated with the disease but also offer potential directions for developing treatments that specifically address the effects of ApoE4-related degeneration. Understanding these pathways is essential for improving therapeutic strategies, particularly for individuals carrying the ApoE4 variant.
2. Method
All datasets were obtained from the Seattle Alzheimer’s Disease Brain Cell Atlas (SEA-AD) [14]. The datasets included: Donor metadata, which contained demographic and genetic information, including APOE genotype. MRI volumetric data, providing structural measurements of cortical and subcortical brain regions. Quantitative neuropathology summary data, reporting tau pathology, amyloid burden, neuroinflammation markers, and cellular density. RNA sequencing data from the Middle Temporal Gyrus (MTG) and Prefrontal Cortex (PFC) regions, available in the “donor object” subfolder [15]. The first three data sets were merged into a single comprehensive database, integrating donor-level genetic, imaging, pathology, and clinical data. The APOE genotype column was used to categorize individuals into ApoE4+ (carriers of at least one APOE4 allele) and ApoE4- (non-carriers) groups for further analysis. All statistical analyses were performed in Python (Pandas, NumPy, and SciPy): Two-sample t-tests were used to compare groups. A significance threshold of p < 0.05 was applied. Figures were generated using Matplotlib, with bar graphs showing mean values, error bars representing standard deviation, and significant p-values displayed on the graphs.
2.1. Identification of significant parameters in pathology, imaging, and clinical data
To identify differences in pathological, imaging, and clinical parameters between ApoE4+ and ApoE4- individuals, an initial screening was completed first, where a total of 116 significant parameters were identified by applying two-sample t-tests to all numeric variables in the dataset. Parameters with p < 0.05 were considered statistically significant. A final selection was made of a subset of 15 significant parameters that was selected for visualization, focusing on measures related to grey matter pathology, brain volume, and clinical progression. Statistical analysis was conducted in Python using SciPy. Figures were generated using Matplotlib, where bar graphs displayed mean values, with error bars representing the standard error of the mean. Parameters with p < 0.05 were marked as statistically significant.
2.2. Cell type identification and comparison in the MTG and PFC
For Figures 4 and 5, RNA sequencing data from the MTG and PFC regions were analyzed to identify differences in brain cell composition between ApoE4+ and ApoE4- individuals. Cell classification was conducted using single-cell RNA sequencing (scRNA-seq) data analysis workflows established previously [16]. Briefly, raw sequencing data were processed using Scanpy, a Python-based computational toolkit widely employed for scRNA-seq data analysis [17]. This process involved quality control, normalization, dimensionality reduction, clustering, and cell type annotation according to standard procedures outlined in recent literature [18]. Unique cell types were identified, and their relative abundances were calculated as a percentage of total cells within each region. Then a two-sample t-tests were performed for each of the 24 identified cell types to determine significant differences between ApoE4+ and ApoE4- groups. This analysis was conducted separately for MTG and PFC datasets. Statistical analysis was performed using Python (SciPy), with a significance threshold [6] of p < 0.05. Figures were generated using Matplotlib, where bar graphs displayed mean cell proportions, error bars indicating standard deviation, and p-values above significant comparisons.
3. Result
The effects of the ApoE4 gene on Alzheimer's disease pathology were assessed by comparing several key parameters between ApoE4+ and ApoE4- groups. Specifically, neuroinflammation markers, amyloid burden, brain volume metrics, and clinical symptoms were analyzed, represented by 15 significant parameters. The initial analysis included 116 significant parameters obtained from 84 patients, but only 15 parameters related to the total or number of grey matter regions were graphed here, as all different layers under one category showed similar results.
3.1. Accelerated clinical progression in ApoE4+ individuals
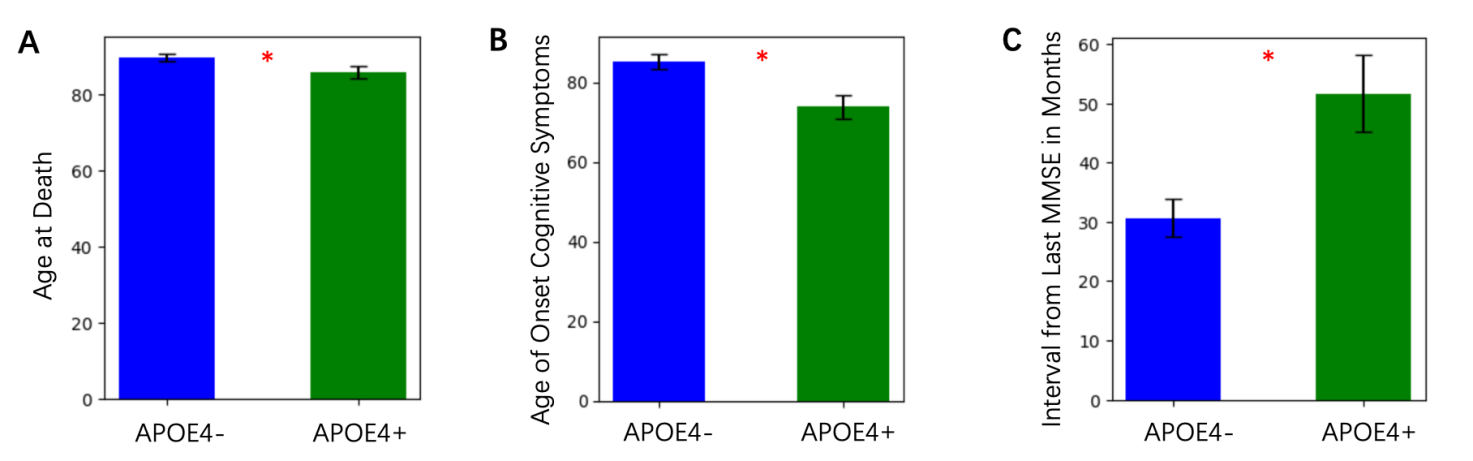
Age-related clinical measurements, including age of onset for cognitive symptoms and interval from the last Mini-Mental State Examination (MMSE), were compared across groups. ApoE4+ individuals had a significantly lower age at death compared to ApoE4- individuals (Figure 1A). ApoE4+ individuals demonstrated an earlier age of onset of cognitive symptoms by approximately 5 years compared to ApoE4- individuals (Figure 1B). The interval from the last MMSE in months was shorter in ApoE4+ individuals, reflecting potentially faster disease progression (Figure 1C), although the difference was marginal.
3.2. Enhanced pathology markers in ApoE4+ alzheimer’s disease
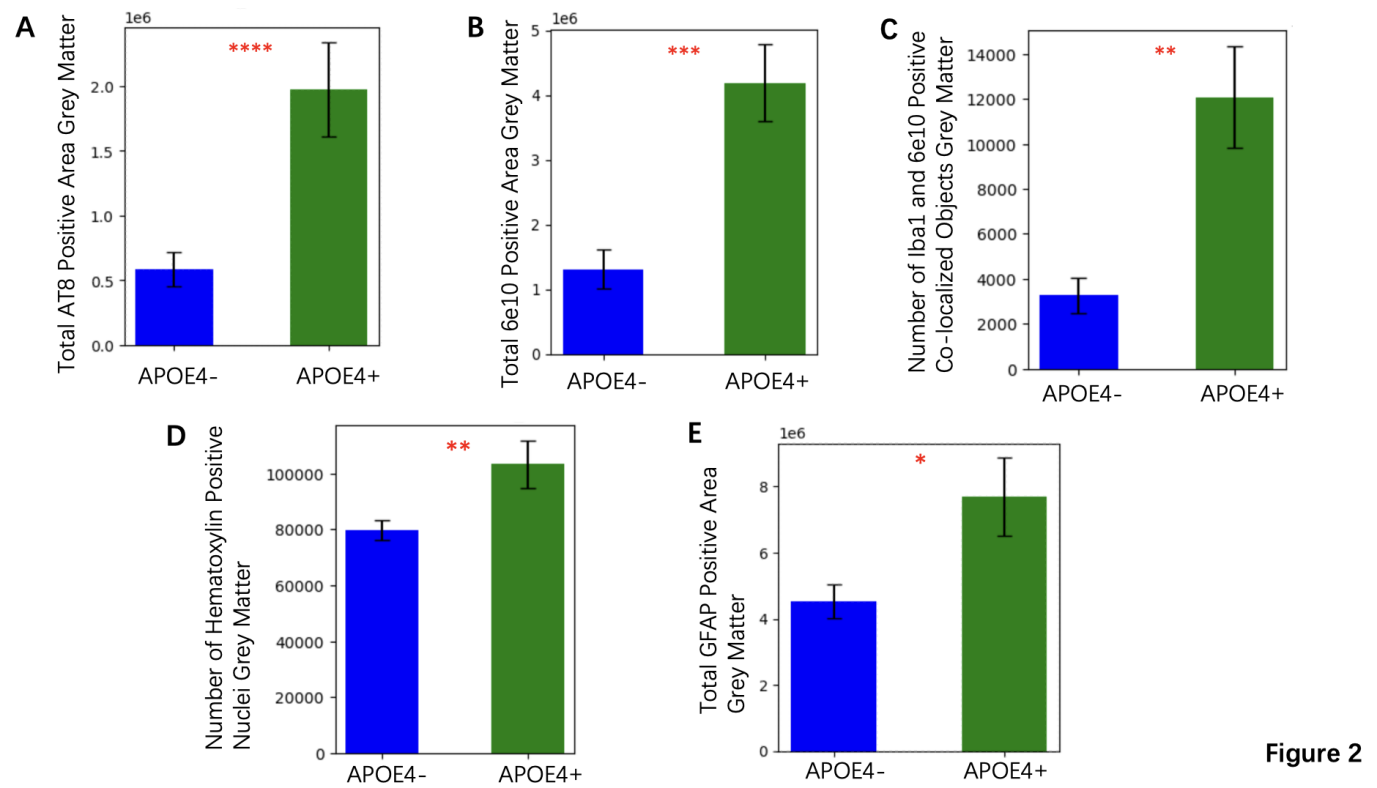
The total AT8 positive area in grey matter, a marker of tau pathology, was significantly higher in the ApoE4+ group compared to the ApoE4- group, with mean increase of 32%, p =7.80e-06 (Figure 2A). Similarly, the total 6e10 positive area in grey matter, which specifically detects amyloid beta (Aβ) protein, indicating the amyloid burden, showed a mean increase of 28% in the ApoE4+ individuals (p =6.52e-04) (Figure 2B). The number of Iba1 and 6e10 positive co-localized objects, which reflects neuroinflammation and amyloid association, was also significantly increased in ApoE4+ participants compared to ApoE4- participants with a mean increase of 25% (p =0.002) (Figure 2C). These data suggest that the presence of the ApoE4 gene exacerbates both tau and amyloid pathology, along with related inflammatory responses. ApoE4+ individuals exhibited significantly larger total GFAP positive areas in grey matter, with mean increase of 20% (p < 0.05) (Figure 2E). Moreover, the number of hematoxylin-positive nuclei, which indicate changes in cellular density, proliferation, or other cellular responses to pathology, was also increased in the ApoE4+ group (p =0.0068) (Figure 2D). These results imply an ongoing response to injury or stress in brain regions vulnerable to Alzheimer's pathology among ApoE4+ individuals.
3.3. Imaging reveals volume loss in ApoE4+ alzheimer’s
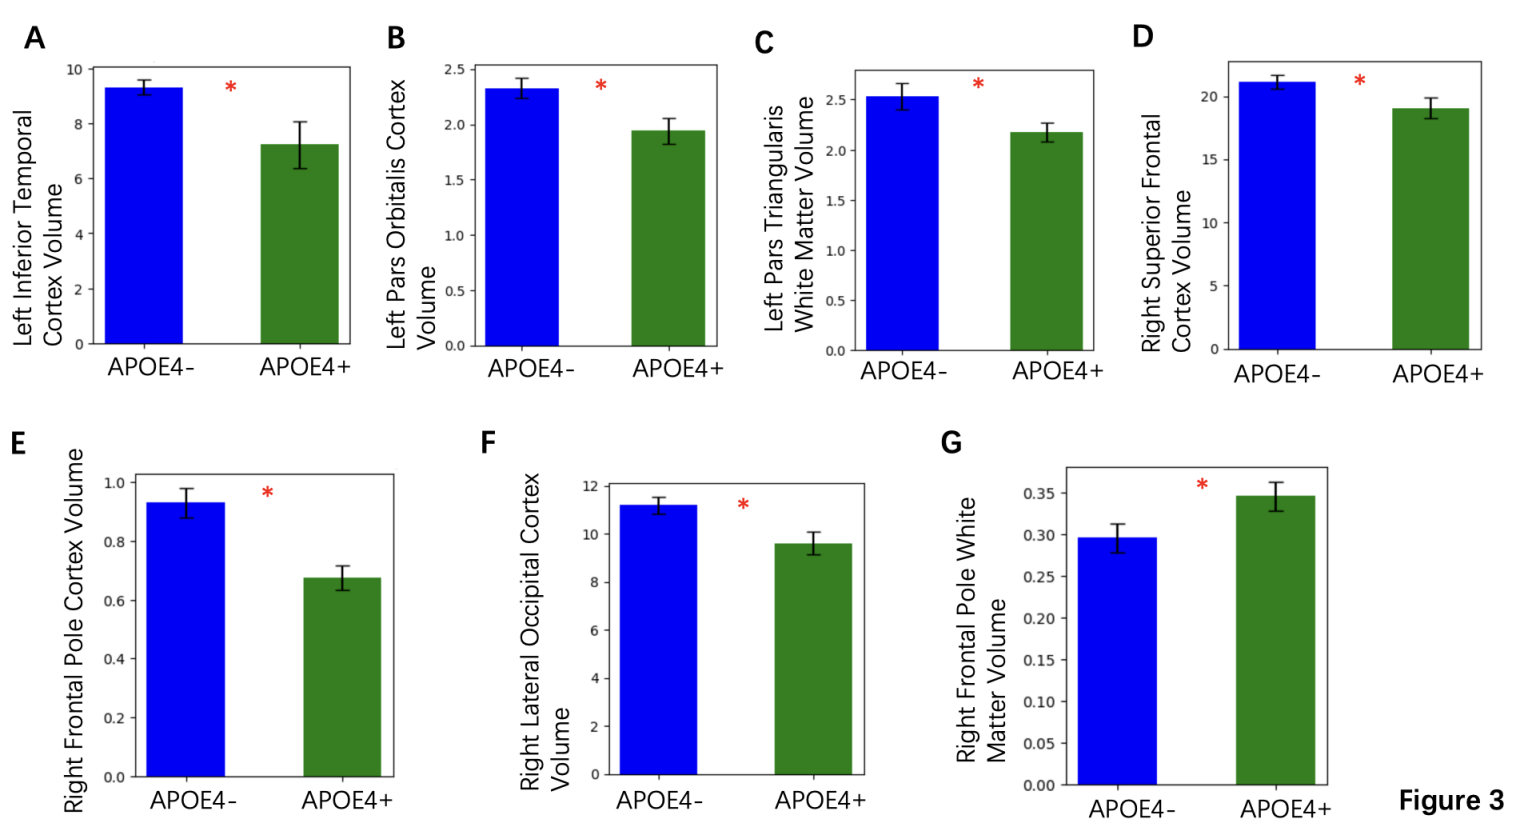
Analysis of cortical and subcortical volumes showed significant reductions in specific regions among ApoE4+ individuals. The left inferior temporal cortex and right lateral occipital cortex volumes were notably reduced in the ApoE4+ group with mean reduction of 15% and 12%, respectively (both p < 0.05) (Figures 3A and 3F). Similar volume reductions were observed in the right frontal pole and superior frontal cortex (Figures 3E and 3D). The graphs presented here focus on parameters where the difference between ApoE4+ and ApoE- was statistically significant, indicating that the ApoE4 gene contributes to the acceleration of Alzheimer-related neurodegenerative processes, with implications for disease progression and cognitive decline.
3.4. Regional analysis of PFC brain cell types
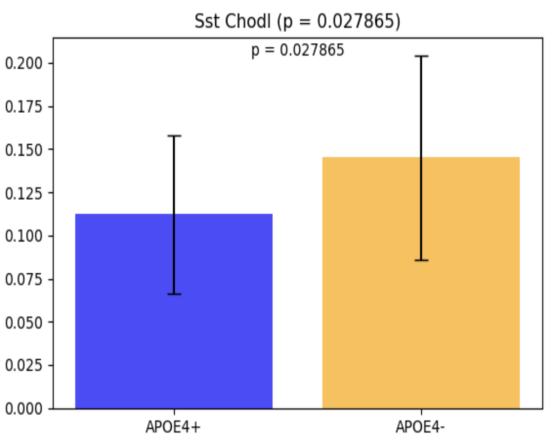
To investigate the impact of the ApoE4 genotype on brain cell populations in the prefrontal cortex (PFC), RNA sequencing (RNA-seq) analysis was performed, focusing on 24 distinct brain cell types. Among these, Sst Chodl was identified as the only cell type showing a statistically significant difference between ApoE4+ and ApoE4- groups. ApoE4+ individuals exhibited a reduced proportion of Sst Chodl cells compared to ApoE4- individuals (p = 0.027865; Figure 4). This finding highlights a potential regional specificity of ApoE4-related alterations in inhibitory interneurons within the PFC.
3.5. Regional analysis of MTG brain cell types
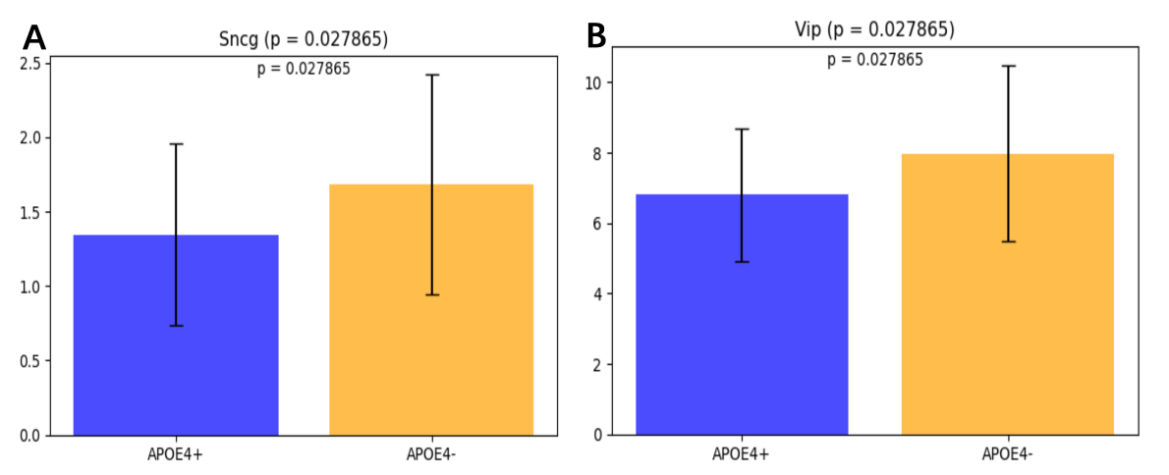
To determine whether the previously identified difference in Sst Chodl was region-specific or part of a broader pattern, RNA sequencing (RNA-seq) analysis was conducted on the middle temporal gyrus (MTG) region of the brain. A total of 24 cell types were analyzed using two-sample t-tests to compare ApoE4+ and ApoE4- individuals. Two cell types, Sncg and Vip, were significantly different between the ApoE4+ and ApoE4- groups. The proportion of Sncg cells was significantly lower in ApoE4+ individuals compared to ApoE4- individuals (t-stat = -2.117567, p = 0.038687). The proportion of Vip cells was also significantly reduced in ApoE4+ individuals (t-stat = -2.300484, p = 0.024877).
4. Discussion
This study showed the significant impact of the ApoE4 gene on Alzheimer’s disease pathology, clinical progression, and brain cell composition. By comparing ApoE4+ and ApoE4- individuals, it is observed that the ApoE4 genotype is associated with more severe pathology, faster disease progression, and specific cellular alterations. The disease usually starts with mild memory problems and progressively leads to cognitive decline, difficulties in performing complex daily tasks, and other cognitive impairments [1,19]. By the time Alzheimer’s disease (AD) is clinically diagnosed, significant neuronal loss and neuropathological lesions are present in various brain regions [20,21].
ApoE4+ individuals showed clear signs of accelerated clinical decline compared to ApoE4- individuals. The earlier onset of cognitive symptoms, approximately five years earlier on average, indicates the role of ApoE4 in facilitating disease progression. Additionally, according to the lower age at death, ApoE4+ individuals had a shorter lifespan. While the interval between the last Mini-Mental State Examination (MMSE) and death was also shorter, this difference was less pronounced. These findings emphasize the need for early detection and intervention for ApoE4 carriers, who appear to face a faster trajectory of cognitive decline and disease progression [22,23]. Research shows cognitive decline begins 12 years before dementia, first affecting semantic memory, followed by global deficits, mild dependence after two years, and rapid worsening in the final three years [24]. The ability to identify individuals with very mild symptoms before the onset of dementia is significant [25,26]. Several diagnostic criteria related to imaging techniques and cerebrospinal fluid biomarkers have been published to establish a multivariate classification for Alzheimer’s disease [27,28].
Neuroimaging results revealed significant volume reductions in cortical and subcortical regions in ApoE4+ individuals. Specifically, reductions in the left inferior temporal cortex and right lateral occipital cortex, with mean decreases of 15% and 12%, respectively, suggest that ApoE4 contributes to widespread neurodegeneration. Additional volume loss in the right frontal pole and superior frontal cortex further underscores the vulnerability of critical brain regions to ApoE4-mediated damage. AD leads to a significant reduction in brain weight and volume, with certain brain regions and neuronal populations being more affected than others. While neuronal loss is evident in specific areas, much of the overall brain volume decline appears to result from the shrinkage and degeneration of neuronal processes [29,30]. These structural changes align with the observed clinical decline, reinforcing the connection between ApoE4, brain volume loss, and cognitive impairment.
Our analysis of molecular markers further supports the exacerbating role of ApoE4 in Alzheimer’s pathology. Research has shown that the ApoE4 allele is strongly associated with cognitive function near death [31]; however, this relationship is largely mediated by AD pathology, which remained a strong predictor of cognitive decline, with similar findings observed across different measures of neurotic plaques [9], diffuse plaques, and neurofibrillary tangles [32]. The significant increase in tau pathology, as shown by a 32% higher AT8-positive area in ApoE4+ individuals, underscores the role of ApoE4 in amplifying tau aggregation. Similarly, the 28% increase in amyloid burden, reflected by 6e10-positive areas, suggests that ApoE4 contributes to amyloid pathology [22,33]. Diverse lines of evidence suggest that amyloid-β (Aβ) peptides lead to AD pathogenesis30. In addition, the significant rise in Iba1 and 6e10 co-localized objects, which are markers of neuroinflammation, indicate an enhanced inflammatory response in ApoE4+ individuals [34]. Markers of cellular stress and glial activation, such as increased GFAP-positive areas and hematoxylin-positive nuclei, further emphasized the heightened cellular responses to pathology in ApoE4+ individuals [35,36]. Together, these findings indicate that ApoE4 not only accelerates the core pathological features of Alzheimer’s disease but also drives inflammation and glial activation, which may amplify the neurodegenerative process [37,38].
Among the 24 brain cell types analyzed in the Prefrontal Cortex (PFC) region, Sst Chodl was the only cell type that showed a statistically significant difference between ApoE4+ and ApoE4- groups. ApoE4+ individuals exhibited a reduced proportion of Sst Chodl cells (p = 0.027865). The Sst Chodl GABAergic cortical interneuron is a rare inhibitory neuron that produces somatostatin and chondrolectin [39,40]. It helps regulate neural activity by balancing excitatory signals, preventing excessive excitation in the brain [41]. Significant synaptic rewiring in somatostatin due to reduced cholinergic drive has been observed in mice with AD-like pathology [42]. This disruption contributes to memory deficits, underscoring the crucial role of somatostatins in AD-related dysfunction [43,44]. By controlling the timing and synchronization, the GABAergic interneurons play an essential part in shaping the dynamic cortical network activities underlying complex brain functions, such as learning, memory, and attention [45]. The reduction in these cells suggests that ApoE4 may disrupt inhibitory signaling, potentially contributing to network instability and cognitive decline, which are features of Alzheimer’s disease [46].
The analysis of the middle temporal gyrus (MTG) region revealed significant reductions in the proportions of Sncg and Vip cells in ApoE4+ individuals compared to ApoE4- individuals. Vip cells, though constituting only 1–2% of cortical neurons, play a crucial role in modulating local network activity. Research across multiple cortical regions indicates that VIP cells strongly inhibiting somatostatin networks [47,48]. Vip interaction with Somatostatin cells is particularly notable in layers 2/3, where they provide strong inhibition, and to a lesser extent in layer [5], forming disinhibitory circuits. These circuits become active during specific behavioral processes such as associative learning, reinforcement, locomotion, and attention [49]. Sncg is a transcriptomic signature in the Vip interneuron [50]. Both cell types are inhibitory interneurons, suggesting a broader impact of the ApoE4 genotype on maintaining excitatory-inhibitory balance in the brain [39]. Hyperphosphorylation of tau and related pathology (tauopathy) has been observed to be accelerated in the presence of the ApoE4 isoform [22]. These findings align with evidence that the ApoE4 allele predisposes neurons to injury and promotes the release of phosphorylated tau (p-tau), independently of glial APOE, accelerating neurodegeneration and tau pathology in Alzheimer’s disease patients [33]. Together with prior findings in the prefrontal cortex (PFC), this suggests that ApoE4-related alterations in inhibitory interneurons may contribute to the spread of tau pathology and the progression of Alzheimer’s disease across multiple brain regions [38]. The observed reduction in Vip cells is particularly notable as these cells are vasoactive intestinal polypeptide-expressing interneurons, which play a critical role in regulating inhibitory circuits by modulating interneuron activity through disinhibition [36]. Alterations in VIP-INs have been implicated in disrupted hippocampal circuits and impaired excitatory-inhibitory balance, which are early pathological features of Alzheimer’s disease [51]. These findings, in combination with reductions in other inhibitory neuron subtypes, such as Sst Chodl in the prefrontal cortex, suggest a widespread and potentially region-specific impact of the ApoE4 genotype on interneuron populations. Research shown that the modulation of microglial activation, phagocytosis, and secretion by VIP is a promising therapeutic option for the treatment of Alzheimer's disease [52]. Further studies are needed to explore how these changes contribute to network dysfunction and Alzheimer’s disease progression.
5. Conclusion
This study demonstrates that the ApoE4 genotype has a significant impact on accelerating several aspects of Alzheimer's disease. The ApoE4 carriers evidenced earlier cognitive impairment, greater tau and amyloid pathology, and notable cortical and subcortical atrophy compared with non-carriers. At the cellular level, reduction in inhibitory interneuron subtypes, including Sst Chodl, Sncg, and Vip, suggests that ApoE4 disrupts excitatory–inhibitory balance and promotes network instability. Together, these results demonstrate biphasic ApoE4 molecular and structural function and establish ApoE4 as a key genetic risk factor and probable therapeutic target. To verify these observations and to investigate interventions that restore the function of inhibitory networks in ApoE4-associated Alzheimer's disease, larger longitudinal cohorts will be required in subsequent studies.
References
[1]. Dementia. https: //www.who.int/news-room/fact-sheets/detail/dementia.
[2]. Lane, C. A., Hardy, J. & Schott, J. M. Alzheimer’s disease. Eur. J. Neurol. 25, 59–70 (2018).
[3]. Boucher, L. 1906: The dawn of Alzheimer’s disease. Nature (2024) doi: 10.1038/d41586-024-02881-w.
[4]. Knopman, D. S., Petersen, R. C. & Jack, C. R. A brief history of “Alzheimer disease”. Neurology 92, 1053–1059 (2019).
[5]. Hardy, J. A. & Higgins, G. A. Alzheimer’s Disease: The Amyloid Cascade Hypothesis. Science 256, 184–185 (1992).
[6]. Mahley, R. W., Weisgraber, K. H. & Huang, Y. Apolipoprotein E4: A causative factor and therapeutic target in neuropathology, including Alzheimer’s disease. Proc. Natl. Acad. Sci. 103, 5644–5651 (2006).
[7]. The history of Alzheimer’s disease. https: //www.nature.com/immersive/alzheimers-disease-history/index.html.
[8]. Näslund, J. et al. Correlation Between Elevated Levels of Amyloid β-Peptide in the Brain and Cognitive Decline. JAMA 283, 1571–1577 (2000).
[9]. Fratiglioni, L., Ahlbom, A., Viitanen, M. & Winblad, B. Risk factors for late-onset Alzheimer’s disease: a population-based, case-control study. Ann. Neurol. 33, 258–266 (1993).
[10]. Selkoe, D. J. Amyloid β-Protein and the Genetics of Alzheimer’s Disease *. J. Biol. Chem. 271, 18295–18298 (1996).
[11]. Huang, Y.-W. A. et al. Differential Signaling Mediated by ApoE2, ApoE3, and ApoE4 in Human Neurons Parallels Alzheimer’s Disease Risk. J. Neurosci. (2019) doi: 10.1523/jneurosci.2994-18.2019.
[12]. Smelt, A. H. M. & de Beer, F. Apolipoprotein E and familial dysbetalipoproteinemia: clinical, biochemical, and genetic aspects. Semin. Vasc. Med. 4, 249–257 (2004).
[13]. Ertl, H. 1993: A major genetic risk factor for late-onset Alzheimer’s disease. Nature (2024) doi: 10.1038/d41586-024-02885-6.
[14]. Alzheimer’s Disease Data Download (SEA-AD) - brain-map.org. https: //portal.brain-map.org/explore/seattle-alzheimers-disease/seattle-alzheimers-disease-brain-cell-atlas-download?edit& language=en#.
[15]. AWS S3 Explorer. https: //sea-ad-single-cell-profiling.s3.amazonaws.com/index.html#MTG/RNAseq/donor_objects/.
[16]. Slovin, S. et al. Single-Cell RNA Sequencing Analysis: A Step-by-Step Overview. in RNA Bioinformatics (ed. Picardi, E.) 343–365 (Springer US, New York, NY, 2021). doi: 10.1007/978-1-0716-1307-8_19.
[17]. Gayoso, A. et al. A Python library for probabilistic analysis of single-cell omics data. Nat. Biotechnol. 40, 163–166 (2022).
[18]. Danese, A. et al. EpiScanpy: integrated single-cell epigenomic analysis. Nat. Commun. 12, 5228 (2021).
[19]. Kukull, W. A. & Bowen, J. D. Dementia epidemiology. Med. Clin. 86, 573–590 (2002).
[20]. Lo, R. Y. et al. Longitudinal Change of Biomarkers in Cognitive Decline. Arch. Neurol. 68, 1257–1266 (2011).
[21]. DeKosky, S. T. & Marek, K. Looking Backward to Move Forward: Early Detection of Neurodegenerative Disorders. Science 302, 830–834 (2003).
[22]. Shi, Y. et al. ApoE4 markedly exacerbates tau-mediated neurodegeneration in a mouse model of tauopathy. Nature 549, 523–527 (2017).
[23]. Jack, C. R. et al. Rates of hippocampal atrophy correlate with change in clinical status in aging and AD. Neurology 55, 484–490 (2000).
[24]. Amieva, H. et al. Prodromal Alzheimer’s disease: Successive emergence of the clinical symptoms. Ann. Neurol. 64, 492–498 (2008).
[25]. Emrani, S., Arain, H. A., DeMarshall, C. & Nuriel, T. APOE4 is associated with cognitive and pathological heterogeneity in patients with Alzheimer’s disease: a systematic review. Alzheimers Res. Ther. 12, 141 (2020).
[26]. Dickerson, B. C. et al. Increased hippocampal activation in mild cognitive impairment compared to normal aging and AD. Neurology 65, 404–411 (2005).
[27]. Gharbi-Meliani, A. et al. The association of APOE ε4 with cognitive function over the adult life course and incidence of dementia: 20 years follow-up of the Whitehall II study. Alzheimers Res. Ther. 13, 5 (2021).
[28]. Dubois, B. et al. Research criteria for the diagnosis of Alzheimer’s disease: revising the NINCDS–ADRDA criteria. Lancet Neurol. 6, 734–746 (2007).
[29]. Hua, X. et al. Tensor-based morphometry as a neuroimaging biomarker for Alzheimer’s disease: An MRI study of 676 AD, MCI, and normal subjects. NeuroImage 43, 458–469 (2008).
[30]. Huang, Y. & Mucke, L. Alzheimer Mechanisms and Therapeutic Strategies. Cell 148, 1204–1222 (2012).
[31]. Safieh, M., Korczyn, A. D. & Michaelson, D. M. ApoE4: an emerging therapeutic target for Alzheimer’s disease. BMC Med. 17, 64 (2019).
[32]. Bennett, D. A. et al. Apolipoprotein E ε4 allele, AD pathology, and the clinical expression of Alzheimer’s disease. Neurology 60, 246–252 (2003).
[33]. Wadhwani, A. R., Affaneh, A., Van Gulden, S. & Kessler, J. A. Neuronal apolipoprotein E4 increases cell death and phosphorylated tau release in alzheimer disease. Ann. Neurol. 85, 726–739 (2019).
[34]. Youmans, K. L. et al. APOE4-specific Changes in Aβ Accumulation in a New Transgenic Mouse Model of Alzheimer Disease *. J. Biol. Chem. 287, 41774–41786 (2012).
[35]. Ali, A. B., Islam, A. & Constanti, A. The fate of interneurons, GABA receptor sub-types and perineuronal nets in Alzheimer’s disease. Brain Pathol. 33, e13129 (2023).
[36]. Michaud, F. et al. Altered firing output of VIP interneurons and early dysfunctions in CA1 hippocampal circuits in the 3xTg mouse model of Alzheimer’s disease. eLife 13, RP95412 (2024).
[37]. Wang, C. et al. Selective removal of astrocytic APOE4 strongly protects against tau-mediated neurodegeneration and decreases synaptic phagocytosis by microglia. Neuron 109, 1657-1674.e7 (2021).
[38]. Neitzel, J. et al. ApoE4 associated with higher tau accumulation independent of amyloid burden. Alzheimers Dement. 16, e046206 (2020).
[39]. van der Kant, R., Goldstein, L. S. B. & Ossenkoppele, R. Amyloid-β-independent regulators of tau pathology in Alzheimer disease. Nat. Rev. Neurosci. 21, 21–35 (2020).
[40]. Lee, S.-H. et al. Activation of specific interneurons improves V1 feature selectivity and visual perception. Nature 488, 379–383 (2012).
[41]. Urban-Ciecko, J. & Barth, A. L. Somatostatin-expressing neurons in cortical networks. Nat. Rev. Neurosci. 17, 401–409 (2016).
[42]. Li, H. et al. Loss of SST and PV positive interneurons in the ventral hippocampus results in anxiety-like behavior in 5xFAD mice. Neurobiol. Aging 117, 165–178 (2022).
[43]. Riedel, B. C., Thompson, P. M. & Brinton, R. D. Age, APOE and sex: Triad of risk of Alzheimer’s disease. J. Steroid Biochem. Mol. Biol. 160, 134–147 (2016).
[44]. Schmid, L. C. et al. Dysfunction of Somatostatin-Positive Interneurons Associated with Memory Deficits in an Alzheimer’s Disease Model. Neuron 92, 114–125 (2016).
[45]. Sst Chodl Gabaergic Cortical Interneuron Cell Types - CZ CELLxGENE CellGuide. Cellxgene Data Portal https: //cellxgene.cziscience.com/.
[46]. Lv, S. et al. ApoE4 exacerbates the senescence of hippocampal neurons and spatial cognitive impairment by downregulating acetyl-CoA level. Aging Cell 22, e13932 (2023).
[47]. O’Dwyer, L. et al. Reduced Hippocampal Volume in Healthy Young ApoE4 Carriers: An MRI Study. PLOS ONE 7, e48895 (2012).
[48]. Pfeffer, C. K., Xue, M., He, M., Huang, Z. J. & Scanziani, M. Inhibition of inhibition in visual cortex: the logic of connections between molecularly distinct interneurons. Nat. Neurosci. 16, 1068–1076 (2013).
[49]. Yavorska, I. & Wehr, M. Somatostatin-Expressing Inhibitory Interneurons in Cortical Circuits. Front. Neural Circuits 10, (2016).
[50]. Tasic, B. et al. Adult mouse cortical cell taxonomy revealed by single cell transcriptomics. Nat. Neurosci. 19, 335–346 (2016)..
[51]. Zhou, J.-N., Hofman, M. A. & Swaab, D. F. VIP neurons in the human SCN in relation to sex, age, and Alzheimer’s disease. Neurobiol. Aging 16, 571–576 (1995).
[52]. VIP Enhances Phagocytosis of Fibrillar Beta-Amyloid by Microglia and Attenuates Amyloid Deposition in the Brain of APP/PS1 Mice | PLOS One. https: //journals.plos.org/plosone/article?id=10.1371/journal.pone.0029790.
Cite this article
Li,Y. (2025). ApoE4-Driven Neurodegeneration in Alzheimer’s Disease: From Brain Atrophy to Inhibitory Neuron Loss. Theoretical and Natural Science,140,30-41.
Data availability
The datasets used and/or analyzed during the current study will be available from the authors upon reasonable request.
Disclaimer/Publisher's Note
The statements, opinions and data contained in all publications are solely those of the individual author(s) and contributor(s) and not of EWA Publishing and/or the editor(s). EWA Publishing and/or the editor(s) disclaim responsibility for any injury to people or property resulting from any ideas, methods, instructions or products referred to in the content.
About volume
Volume title: Proceedings of ICBioMed 2025 Symposium: Interdisciplinary Frontiers in Pharmaceutical Sciences
© 2024 by the author(s). Licensee EWA Publishing, Oxford, UK. This article is an open access article distributed under the terms and
conditions of the Creative Commons Attribution (CC BY) license. Authors who
publish this series agree to the following terms:
1. Authors retain copyright and grant the series right of first publication with the work simultaneously licensed under a Creative Commons
Attribution License that allows others to share the work with an acknowledgment of the work's authorship and initial publication in this
series.
2. Authors are able to enter into separate, additional contractual arrangements for the non-exclusive distribution of the series's published
version of the work (e.g., post it to an institutional repository or publish it in a book), with an acknowledgment of its initial
publication in this series.
3. Authors are permitted and encouraged to post their work online (e.g., in institutional repositories or on their website) prior to and
during the submission process, as it can lead to productive exchanges, as well as earlier and greater citation of published work (See
Open access policy for details).
References
[1]. Dementia. https: //www.who.int/news-room/fact-sheets/detail/dementia.
[2]. Lane, C. A., Hardy, J. & Schott, J. M. Alzheimer’s disease. Eur. J. Neurol. 25, 59–70 (2018).
[3]. Boucher, L. 1906: The dawn of Alzheimer’s disease. Nature (2024) doi: 10.1038/d41586-024-02881-w.
[4]. Knopman, D. S., Petersen, R. C. & Jack, C. R. A brief history of “Alzheimer disease”. Neurology 92, 1053–1059 (2019).
[5]. Hardy, J. A. & Higgins, G. A. Alzheimer’s Disease: The Amyloid Cascade Hypothesis. Science 256, 184–185 (1992).
[6]. Mahley, R. W., Weisgraber, K. H. & Huang, Y. Apolipoprotein E4: A causative factor and therapeutic target in neuropathology, including Alzheimer’s disease. Proc. Natl. Acad. Sci. 103, 5644–5651 (2006).
[7]. The history of Alzheimer’s disease. https: //www.nature.com/immersive/alzheimers-disease-history/index.html.
[8]. Näslund, J. et al. Correlation Between Elevated Levels of Amyloid β-Peptide in the Brain and Cognitive Decline. JAMA 283, 1571–1577 (2000).
[9]. Fratiglioni, L., Ahlbom, A., Viitanen, M. & Winblad, B. Risk factors for late-onset Alzheimer’s disease: a population-based, case-control study. Ann. Neurol. 33, 258–266 (1993).
[10]. Selkoe, D. J. Amyloid β-Protein and the Genetics of Alzheimer’s Disease *. J. Biol. Chem. 271, 18295–18298 (1996).
[11]. Huang, Y.-W. A. et al. Differential Signaling Mediated by ApoE2, ApoE3, and ApoE4 in Human Neurons Parallels Alzheimer’s Disease Risk. J. Neurosci. (2019) doi: 10.1523/jneurosci.2994-18.2019.
[12]. Smelt, A. H. M. & de Beer, F. Apolipoprotein E and familial dysbetalipoproteinemia: clinical, biochemical, and genetic aspects. Semin. Vasc. Med. 4, 249–257 (2004).
[13]. Ertl, H. 1993: A major genetic risk factor for late-onset Alzheimer’s disease. Nature (2024) doi: 10.1038/d41586-024-02885-6.
[14]. Alzheimer’s Disease Data Download (SEA-AD) - brain-map.org. https: //portal.brain-map.org/explore/seattle-alzheimers-disease/seattle-alzheimers-disease-brain-cell-atlas-download?edit& language=en#.
[15]. AWS S3 Explorer. https: //sea-ad-single-cell-profiling.s3.amazonaws.com/index.html#MTG/RNAseq/donor_objects/.
[16]. Slovin, S. et al. Single-Cell RNA Sequencing Analysis: A Step-by-Step Overview. in RNA Bioinformatics (ed. Picardi, E.) 343–365 (Springer US, New York, NY, 2021). doi: 10.1007/978-1-0716-1307-8_19.
[17]. Gayoso, A. et al. A Python library for probabilistic analysis of single-cell omics data. Nat. Biotechnol. 40, 163–166 (2022).
[18]. Danese, A. et al. EpiScanpy: integrated single-cell epigenomic analysis. Nat. Commun. 12, 5228 (2021).
[19]. Kukull, W. A. & Bowen, J. D. Dementia epidemiology. Med. Clin. 86, 573–590 (2002).
[20]. Lo, R. Y. et al. Longitudinal Change of Biomarkers in Cognitive Decline. Arch. Neurol. 68, 1257–1266 (2011).
[21]. DeKosky, S. T. & Marek, K. Looking Backward to Move Forward: Early Detection of Neurodegenerative Disorders. Science 302, 830–834 (2003).
[22]. Shi, Y. et al. ApoE4 markedly exacerbates tau-mediated neurodegeneration in a mouse model of tauopathy. Nature 549, 523–527 (2017).
[23]. Jack, C. R. et al. Rates of hippocampal atrophy correlate with change in clinical status in aging and AD. Neurology 55, 484–490 (2000).
[24]. Amieva, H. et al. Prodromal Alzheimer’s disease: Successive emergence of the clinical symptoms. Ann. Neurol. 64, 492–498 (2008).
[25]. Emrani, S., Arain, H. A., DeMarshall, C. & Nuriel, T. APOE4 is associated with cognitive and pathological heterogeneity in patients with Alzheimer’s disease: a systematic review. Alzheimers Res. Ther. 12, 141 (2020).
[26]. Dickerson, B. C. et al. Increased hippocampal activation in mild cognitive impairment compared to normal aging and AD. Neurology 65, 404–411 (2005).
[27]. Gharbi-Meliani, A. et al. The association of APOE ε4 with cognitive function over the adult life course and incidence of dementia: 20 years follow-up of the Whitehall II study. Alzheimers Res. Ther. 13, 5 (2021).
[28]. Dubois, B. et al. Research criteria for the diagnosis of Alzheimer’s disease: revising the NINCDS–ADRDA criteria. Lancet Neurol. 6, 734–746 (2007).
[29]. Hua, X. et al. Tensor-based morphometry as a neuroimaging biomarker for Alzheimer’s disease: An MRI study of 676 AD, MCI, and normal subjects. NeuroImage 43, 458–469 (2008).
[30]. Huang, Y. & Mucke, L. Alzheimer Mechanisms and Therapeutic Strategies. Cell 148, 1204–1222 (2012).
[31]. Safieh, M., Korczyn, A. D. & Michaelson, D. M. ApoE4: an emerging therapeutic target for Alzheimer’s disease. BMC Med. 17, 64 (2019).
[32]. Bennett, D. A. et al. Apolipoprotein E ε4 allele, AD pathology, and the clinical expression of Alzheimer’s disease. Neurology 60, 246–252 (2003).
[33]. Wadhwani, A. R., Affaneh, A., Van Gulden, S. & Kessler, J. A. Neuronal apolipoprotein E4 increases cell death and phosphorylated tau release in alzheimer disease. Ann. Neurol. 85, 726–739 (2019).
[34]. Youmans, K. L. et al. APOE4-specific Changes in Aβ Accumulation in a New Transgenic Mouse Model of Alzheimer Disease *. J. Biol. Chem. 287, 41774–41786 (2012).
[35]. Ali, A. B., Islam, A. & Constanti, A. The fate of interneurons, GABA receptor sub-types and perineuronal nets in Alzheimer’s disease. Brain Pathol. 33, e13129 (2023).
[36]. Michaud, F. et al. Altered firing output of VIP interneurons and early dysfunctions in CA1 hippocampal circuits in the 3xTg mouse model of Alzheimer’s disease. eLife 13, RP95412 (2024).
[37]. Wang, C. et al. Selective removal of astrocytic APOE4 strongly protects against tau-mediated neurodegeneration and decreases synaptic phagocytosis by microglia. Neuron 109, 1657-1674.e7 (2021).
[38]. Neitzel, J. et al. ApoE4 associated with higher tau accumulation independent of amyloid burden. Alzheimers Dement. 16, e046206 (2020).
[39]. van der Kant, R., Goldstein, L. S. B. & Ossenkoppele, R. Amyloid-β-independent regulators of tau pathology in Alzheimer disease. Nat. Rev. Neurosci. 21, 21–35 (2020).
[40]. Lee, S.-H. et al. Activation of specific interneurons improves V1 feature selectivity and visual perception. Nature 488, 379–383 (2012).
[41]. Urban-Ciecko, J. & Barth, A. L. Somatostatin-expressing neurons in cortical networks. Nat. Rev. Neurosci. 17, 401–409 (2016).
[42]. Li, H. et al. Loss of SST and PV positive interneurons in the ventral hippocampus results in anxiety-like behavior in 5xFAD mice. Neurobiol. Aging 117, 165–178 (2022).
[43]. Riedel, B. C., Thompson, P. M. & Brinton, R. D. Age, APOE and sex: Triad of risk of Alzheimer’s disease. J. Steroid Biochem. Mol. Biol. 160, 134–147 (2016).
[44]. Schmid, L. C. et al. Dysfunction of Somatostatin-Positive Interneurons Associated with Memory Deficits in an Alzheimer’s Disease Model. Neuron 92, 114–125 (2016).
[45]. Sst Chodl Gabaergic Cortical Interneuron Cell Types - CZ CELLxGENE CellGuide. Cellxgene Data Portal https: //cellxgene.cziscience.com/.
[46]. Lv, S. et al. ApoE4 exacerbates the senescence of hippocampal neurons and spatial cognitive impairment by downregulating acetyl-CoA level. Aging Cell 22, e13932 (2023).
[47]. O’Dwyer, L. et al. Reduced Hippocampal Volume in Healthy Young ApoE4 Carriers: An MRI Study. PLOS ONE 7, e48895 (2012).
[48]. Pfeffer, C. K., Xue, M., He, M., Huang, Z. J. & Scanziani, M. Inhibition of inhibition in visual cortex: the logic of connections between molecularly distinct interneurons. Nat. Neurosci. 16, 1068–1076 (2013).
[49]. Yavorska, I. & Wehr, M. Somatostatin-Expressing Inhibitory Interneurons in Cortical Circuits. Front. Neural Circuits 10, (2016).
[50]. Tasic, B. et al. Adult mouse cortical cell taxonomy revealed by single cell transcriptomics. Nat. Neurosci. 19, 335–346 (2016)..
[51]. Zhou, J.-N., Hofman, M. A. & Swaab, D. F. VIP neurons in the human SCN in relation to sex, age, and Alzheimer’s disease. Neurobiol. Aging 16, 571–576 (1995).
[52]. VIP Enhances Phagocytosis of Fibrillar Beta-Amyloid by Microglia and Attenuates Amyloid Deposition in the Brain of APP/PS1 Mice | PLOS One. https: //journals.plos.org/plosone/article?id=10.1371/journal.pone.0029790.