


1. Introduction
In today’s fast-paced society, many people face high levels of stress, and mental health problems have become more and more common [1]. Among all the age groups, adolescents are especially vulnerable [2]. Their psychological development is not yet complete, but at the same time, they carry heavy stress from school, family, and social life. In 2023, The Blue Book of Mental Health in China [3] reports that about 95 million people in China live with depression, and more than 28 million of them are adolescents, accounting for 30.28% of the total.
Adolescence is a vital stage of human growth [4]. Poor mental health during this period can lead to a series of problems, such as low academic performance [5], difficulties in socializing, and even long-term effects for personal development [6]. Many adolescents experience symptoms such as anxiety and depression. Even worse, some may engage in self-harm or suicidal behavior [7]. Thus, improving adolescent mental health has become an urgent priority, not only for the well-being of young people, but for the future of society as well.
While most research on adolescent mental health in China relies on survey data or clinical cases and tends to focus on the individual level, studies at the national or macro level remain limited [8]. Against this background, using data from the National Bureau of Statistics to track trends in mental health education resources and examine their connection to student mental health offers a fresh perspective. Hence, this study utilizes public data from the National Bureau of Statistics to examine the allocation of mental health teachers in Chinese secondary schools between 2020 and 2023, and to investigate how this allocation may be associated with students' mental health. To address these problems, this study applies descriptive statistics, correlation analysis, and multivariable regression models to analyze the data. This study gives some early evidence that adding more mental health teachers could help support better outcomes for students, which is an important issue in China today. It also shows one possible way to use national statistics to study the link between education policies and student well-being, which may be useful for later research.
2. Methods
2.1. Research methods
This study mainly relied on publicly available data from the China Statistical Yearbook and the annual reports of the Ministry of Education (2020–2023) [9-10]. The research design was observational, with the aim of examining trends in the allocation of mental health teachers in Chinese secondary schools during this period and exploring, in a basic way, how this allocation might be linked to adolescent mental health outcomes.
For the variables, the percentage of mental health teachers out of the total number of teachers was treated as the exposure variable, while the percentage of students reporting “good” mental health was defined as the outcome variable. To reduce the influence of other social and educational factors, several covariates were also included, such as education expenditure, Gross Domestic Product (GDP), the student–teacher ratio, and the urbanization rate.
The analysis was carried out in a few steps. First, a simple trend analysis of the yearly changes in the allocation of mental health teachers was conducted, followed by the use of a linear regression model to estimate both the direction and the size of the change over time. Second, since student mental health data were only available for 2020 and 2022, an exploratory regression was performed for these two years to assess, at least in a preliminary way, whether teacher allocation was related to the proportion of students reporting good mental health. Third, a logistic regression model was constructed, with “achievement of the policy target” (1 = achieved, 0 = not achieved) as the dependent variable, and education expenditure, GDP, student–teacher ratio, and urbanization rate as independent variables, in order to investigate the potential impact of multiple contextual factors. Finally, model discrimination was evaluated using Receiver Operating Characteristic (ROC) curve and Area Under the Curve (AUC), and sensitivity analyses were conducted to ensure the robustness of the findings.
2.2. Statistical methods
(1) Linear regression: Teacher allocation ratio was set as the dependent variable and the year as the independent variable. The general model was:
with β, R², and P-values estimated to evaluate the direction and strength of the trend.
(2) Exploratory regression: Because student mental health outcomes were only available in 2020 and 2022, an exploratory regression was performed using teacher allocation ratio as the independent variable and the proportion of students with good mental health as the dependent variable. Given the limited data points, the results were interpreted as preliminary.
(3) Logistic regression and model evaluation: A logistic regression model was constructed with “policy target achieved (1 = yes, 0 = no)” as the dependent variable, and education expenditure, GDP, student–teacher ratio, and urbanization rate as independent variables:
ROC curve and AUC were used to assess model discrimination. A simple sensitivity analysis was conducted to examine robustness. Because of data limitations, the logistic regression was based on simulated data (n = 20) and is presented only as a methodological demonstration.
3. Results
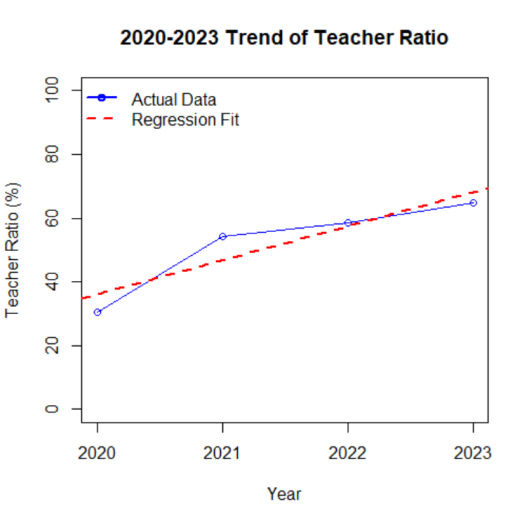
3.1. Time trend of teacher allocation
Between 2020 and 2023, the allocation of mental health teachers showed an overall upward trend. The fitted regression equation was
with slope β = 10.73, R² = 0.853, and P ≈ 0.076. Although the result did not reach conventional statistical significance (α = 0.05), the high R² suggests a strong increasing trend (Figure 1).
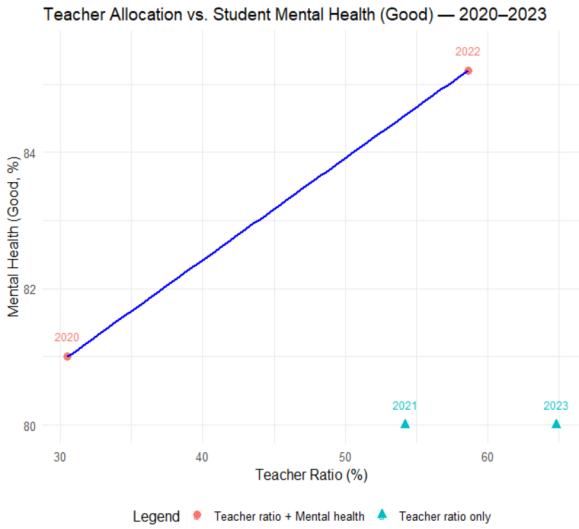
3.2. Exploratory analysis of teacher allocation and student mental health
Using the available data from 2020 and 2022, the allocation of mental health teachers increased from 30.5% to 58.6%, while the proportion of students reporting good mental health also went up from 81.0% to 85.2%. A simple linear fit between these two points suggested a positive relationship, which seems to indicate that better teacher allocation could be linked to improved student well-being (Figure 2). Still, because there were only two data points, it is not possible to make strong claims about effect size or statistical significance. For this reason, the results should be seen only as preliminary evidence.
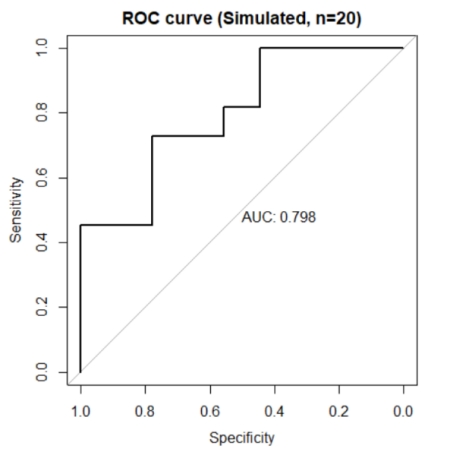
3.3. Logistic regression and discriminatory performance
To further examine the influence of multiple factors on policy target achievement, a logistic regression model was constructed. The dependent variable in this model was whether the policy target was achieved (Y, coded as 1 = achieved and 0 = not achieved). The independent variables were education expenditure (EduExp), gross domestic product (GDP), student–teacher ratio (StuTeach), and urbanization rate (UrbanRate). The model was written as shown below:
where β1, β2, β3, and β4 are the regression coefficients for each predictor.
The model was tested on a small, simulated dataset (n = 20) for demonstration purposes. Its performance was evaluated with the ROC curve, and the AUC was 0.798. This value falls in the range of 0.7 to 0.9, which is usually considered moderate discrimination (Figure 3). In other words, the model was reasonably able to separate cases where the policy target was achieved from those where it was not.
It should be noted that this analysis was done with simulated data and is only meant to show how the method can be applied. The results should not be taken as strong policy evidence. Robust evaluation would require larger, real-world datasets covering additional years and regions, as well as validation with more comprehensive samples. Table 1 shows the basic statistics of education expenditure, GDP, student–teacher ratio, and urbanization rate in 2020 and 2022, which were used as independent variables in the logistic regression model.
|
Year |
Education Expenditure (100 million yuan) |
GDP (trillion yuan) |
Student–Teacher Ratio |
Urbanization Rate (%) |
|
2020 |
53033.87 |
7.2447 |
16.1 |
63.9 |
|
2022 |
61329.14 |
8.5698 |
15.6 |
65.22 |
4. Conclusion
This study makes use of macro-level statistical data from China between 2020 and 2023 to examine the relationship between the allocation of mental health teachers and adolescent mental health. The findings indicate that the proportion of mental health teachers increased gradually during this period, which seems to reflect some progress in government policy. At the same time, although the available data on student mental health is limited, there appears to be a pattern: as the allocation of teachers went up, the proportion of students reporting good mental health also rose. Even though the number of data points is quite small, the overall trend suggests that there may be a positive link between these two factors.
The linear regression analysis showed that the allocation rate of teachers increased by about 10 percentage points per year. The R² value was quite high, which indicates that the model fit was reasonable. However, because the P-value was greater than 0.05, the result cannot be considered statistically significant. This suggests that with such a small sample size, the findings might not be very reliable, and collecting more data would be important in order to make stronger conclusions. In fact, the exploratory regression was based on only two data points, from 2020 and 2022, and it suggested that higher teacher allocation was linked to a greater proportion of students reporting good mental health. This is consistent with many earlier studies suggesting that school-based mental health education and resources may help improve student well-being. Still, because the analysis was based on only two years of data, this conclusion should be seen as suggestive rather than definitive.
In the logistic regression demonstration, this study included education expenditure, GDP, student–teacher ratio, and urbanization rate as predictors. The model produced an AUC value of 0.798, which indicates a moderate level of discrimination. This means that with larger and real-world datasets, such a multi-factor model could be useful for evaluating policy outcomes. However, in this study, the logistic regression was run on simulated data, so the results are mainly meant to demonstrate the method rather than provide real evidence of policy effects.
Of course, this study has several limitations. First, the data were macro-level statistics rather than individual-level survey or clinical data, which raises the risk of ecological fallacy. Second, the data on student mental health were only available for two years, which is really limited and makes it hard to do more advanced time-series or causal analysis. Third, the macro-level data could also be influenced by regional differences and other factors, like differences in education quality across provinces or variations in social support systems, and these were not fully taken into account in this study. For future research, it would be better to collect data from more years and more regions, and if possible, to include school-level or even individual-level data. It is also worth paying attention not just to the number of teachers but also to their professional training and the approaches they use in practice, since these factors could directly affect how effective the policy is.
References
[1]. Prakash, J., Ali, T., Chaudhury, S., & Srivastava, K. (2023). Declining mental health: An aftermath of fast-paced urbanization. Industrial Psychiatry Journal, 32(2), 199–201. doi: 10.4103/ipj.ipj_299_23
[2]. Sisk, L. M., & Gee, D. G. (2022). Stress and adolescence: Vulnerability and opportunity during a sensitive window of development. Current Opinion in Psychology, 44, 286–292. doi: 10.1016/j.copsyc.2021.10.005
[3]. Institute of Psychology, Chinese Academy of Sciences. (2023). The Blue Book of Mental Health in China. Social Sciences Academic Press. Chinese Academy of Sciences. http: //www.psych.ac.cn/
[4]. Viner, R. M., Ross, D., Hardy, R., Kuh, D., Power, C., Johnson, A., et al. (2015). Life course epidemiology: Recognising the importance of adolescence. Journal of Epidemiology and Community Health, 69(8), 719–720. doi: 10.1136/jech-2014-205300
[5]. Pagerols, M., Prat, R., Rivas, C., Español-Martín, G., Puigbó, J., Pagespetit, È., et al. (2022). The impact of psychopathology on academic performance in school-Age children and adolescents. Scientific Reports, 12(1). doi: 10.1038/s41598-022-08242-9
[6]. Büschges, J. C., Beyer, A.-K., Schmidt-Trucksäss, A., Berger, K., & Neuhauser, H. (2025). Association of Mental Health in childhood, adolescence and young adulthood with cardiovascular risk factors and carotid remodeling below age 30 - results from the Kiggs Cohort Study. European Journal of Epidemiology, 40(1), 17–26. doi: 10.1007/s10654-024-01189-3
[7]. Tørmoen, A. J., Myhre, M. Ø., Kildahl, A. T., Walby, F. A., & Rossow, I. (2023). A nationwide study on time spent on social media and self-harm among adolescents. Scientific Reports, 13(1). doi: 10.1038/s41598-023-46370-y
[8]. Du, X., Wu, H., Yalikun, S., Li, J., Jia, J., Duan, T., et al. (2025). Trajectories of Chinese adolescent depression before and after COVID-19: A cross-temporal meta-analysis with segmented regression. Journal of Affective Disorders, 373, 333–344. doi: 10.1016/j.jad.2024.12.094
[9]. National Bureau of Statistics of China. (2023). China Statistical Yearbook 2023. Beijing: China Statistics Press. https: //www.stats.gov.cn/
[10]. Ministry of Education of the People’s Republic of China. (2020–2023). Annual report on education statistics. Beijing: Ministry of Education. http: //en.moe.gov.cn/
Cite this article
Miao,Y. (2025). Association Between Mental Health Teacher Allocation and Adolescent Mental Health Outcomes in China (2020–2023). Theoretical and Natural Science,144,56-61.
Data availability
The datasets used and/or analyzed during the current study will be available from the authors upon reasonable request.
Disclaimer/Publisher's Note
The statements, opinions and data contained in all publications are solely those of the individual author(s) and contributor(s) and not of EWA Publishing and/or the editor(s). EWA Publishing and/or the editor(s) disclaim responsibility for any injury to people or property resulting from any ideas, methods, instructions or products referred to in the content.
About volume
Volume title: Proceedings of ICBioMed 2025 Symposium: AI for Healthcare: Advanced Medical Data Analytics and Smart Rehabilitation
© 2024 by the author(s). Licensee EWA Publishing, Oxford, UK. This article is an open access article distributed under the terms and
conditions of the Creative Commons Attribution (CC BY) license. Authors who
publish this series agree to the following terms:
1. Authors retain copyright and grant the series right of first publication with the work simultaneously licensed under a Creative Commons
Attribution License that allows others to share the work with an acknowledgment of the work's authorship and initial publication in this
series.
2. Authors are able to enter into separate, additional contractual arrangements for the non-exclusive distribution of the series's published
version of the work (e.g., post it to an institutional repository or publish it in a book), with an acknowledgment of its initial
publication in this series.
3. Authors are permitted and encouraged to post their work online (e.g., in institutional repositories or on their website) prior to and
during the submission process, as it can lead to productive exchanges, as well as earlier and greater citation of published work (See
Open access policy for details).
References
[1]. Prakash, J., Ali, T., Chaudhury, S., & Srivastava, K. (2023). Declining mental health: An aftermath of fast-paced urbanization. Industrial Psychiatry Journal, 32(2), 199–201. doi: 10.4103/ipj.ipj_299_23
[2]. Sisk, L. M., & Gee, D. G. (2022). Stress and adolescence: Vulnerability and opportunity during a sensitive window of development. Current Opinion in Psychology, 44, 286–292. doi: 10.1016/j.copsyc.2021.10.005
[3]. Institute of Psychology, Chinese Academy of Sciences. (2023). The Blue Book of Mental Health in China. Social Sciences Academic Press. Chinese Academy of Sciences. http: //www.psych.ac.cn/
[4]. Viner, R. M., Ross, D., Hardy, R., Kuh, D., Power, C., Johnson, A., et al. (2015). Life course epidemiology: Recognising the importance of adolescence. Journal of Epidemiology and Community Health, 69(8), 719–720. doi: 10.1136/jech-2014-205300
[5]. Pagerols, M., Prat, R., Rivas, C., Español-Martín, G., Puigbó, J., Pagespetit, È., et al. (2022). The impact of psychopathology on academic performance in school-Age children and adolescents. Scientific Reports, 12(1). doi: 10.1038/s41598-022-08242-9
[6]. Büschges, J. C., Beyer, A.-K., Schmidt-Trucksäss, A., Berger, K., & Neuhauser, H. (2025). Association of Mental Health in childhood, adolescence and young adulthood with cardiovascular risk factors and carotid remodeling below age 30 - results from the Kiggs Cohort Study. European Journal of Epidemiology, 40(1), 17–26. doi: 10.1007/s10654-024-01189-3
[7]. Tørmoen, A. J., Myhre, M. Ø., Kildahl, A. T., Walby, F. A., & Rossow, I. (2023). A nationwide study on time spent on social media and self-harm among adolescents. Scientific Reports, 13(1). doi: 10.1038/s41598-023-46370-y
[8]. Du, X., Wu, H., Yalikun, S., Li, J., Jia, J., Duan, T., et al. (2025). Trajectories of Chinese adolescent depression before and after COVID-19: A cross-temporal meta-analysis with segmented regression. Journal of Affective Disorders, 373, 333–344. doi: 10.1016/j.jad.2024.12.094
[9]. National Bureau of Statistics of China. (2023). China Statistical Yearbook 2023. Beijing: China Statistics Press. https: //www.stats.gov.cn/
[10]. Ministry of Education of the People’s Republic of China. (2020–2023). Annual report on education statistics. Beijing: Ministry of Education. http: //en.moe.gov.cn/