


1. Introduction
1.1. Background
Hotel reservation is a necessity for the traveller to have a comfortable trip. With the development of online reservation, it is convenient for customers to book the hotel in various ways and check the specific room booking status. There are many factors that contribute to the booking status, including the environment surrounding the hotel, the hotel’s location, hotel evaluation and so on. Among those factors, which factor influences the most has been aroused by most hotels in order to attract more guests and which factor causing the cancel of reservation is also much concerned to the hotel manager.
1.2. Related research
Many articles focus on the comments and reviews which influence the reservation. According to the paper, “eWOM effects on hotel booking intentions, attitudes, trust, and website perceptions [1]”, by Ladhari, R and Michaud, M, Internet users who were exposed to positive reviews of a particular hotel reported significantly higher intentions to book than those who viewed negative reviews about the hotel. Therefore, hotel evaluation contributes a lot to the reservation. According to another paper, “Determinants of online hotel booking intentions: website quality, social presence, affective commitment, and e-trust [2]”, improving the quality of hotel websites encourages travelers to make online hotel reservations by increasing their trust and commitment to booking a hotel room.
The application of the research method refers to some academic papers. According to the paper, “Correlation Coefficients: Appropriate Use and Interpretation [3]”, it is important to note that an observed correlation (that is, an association) does not guarantee that the relationship between two variables is causal. According to another paper, “Novel online discriminant analysis based schemes to deal with observations from known and new classes: Application to industrial systems [4]”, it lists five discriminant analysis and present the new decision schemes.
1.3. Objection
Many surveys having a well-behaving model and satisfying results mostly focus on customer subjective feeling and hotel service quality. However, there are few surveys based on objective conditions, including numbers of adult, previous reservation records and so on. In other words, if the hotel manager only has the customers’ basic information and the hotel room information, how can he/she predict or judge whether the reservation will be canceled. It is convenient and important to research this topic, because objective conditions are easy to collect and also contribute to the reservation. As a result, this article focuses on the objective factors influencing the booking status.
The study is based on the hotel reservation data set from Kaggle. It tries to put the social hot issues concerned by hotel managers under the test of objective data.
In this article, the dependent variable is the hotel reservation and independent variables are the rest. Firstly, study the pairwise relationships of correlation coefficients and draw a heat map. Secondly, found out that no_of_children have a low relationship with booking status, the article uses Test of Goodness of Fit to test whether the variable has an influence on the booking status. Finally, distance discriminant analysis is formed to predict the reservation.
2. Methodology
2.1. Source of data
A data set, from Kaggle, is used to analyse whether it is possible for customers to cancel the hotel reservations based on features e.g. numbers of children and average prices. The data has 36,276 items and 19 variables which are either numerical or categorical. Each row represents each customer’s related reservation information. The current study is to find highly correlated variables and predict whether a customer will cancel or not. The dependent variable is the booking status and the independent variable is the rest variables, like number of adults, number of children and so on.
2.2. Data processing
Since the dataset contains no missing value, its categorical values just need to be adjusted to 0 or 1. For example, booking_status, it has two statuses, Not_Canceled and Canceled. Not_Canceled status should be changed into 0, while the other should be 1, in order to calculate easily. It is the same situation for other categorical variables. For market_segment_type, online should be converted into 1, Offline into 0, Corporate into 2, Complementary into 3, Aviation into 4. For room_type_reserved, Room_Type 1-6 should be changed into 1 to 6. For type_of_meal_plan, Not Selected corresponds to 0 and Meal Plan 1 to 3 should be changed into 1 to 3.
2.3. Models
This paper involves three research and analysis methods, which are respectively correlation analysis, test of goodness of fit, discriminant analysis model and specific descriptions are as follows.
2.3.1. Correlation analysis.The theory of correlation analysis is the correlation between two variables [5]. All the absolute value should be less than or equal to one and if the value equals one, it indicates that all data points fall on the same line. After calculating the correlation values, a heat map can be drawn and the pairwise relationship is shown intuitively.
Let X and Y denote the two variables. Pearson correlation coefficient can be defined as followed [6]:
\( {ρ_{XY}}=\frac{cov(X,Y)}{{σ_{x}}{σ_{y}}}=\frac{E(X−{μ_{x}})(Y−{μ_{y}})}{{σ_{x}}{σ_{y}}} \) (1)
Where and are the mean of X and Y. and are the variance of X and Y.
When the number of variables is larger than two, coefficient information will be stored in a matrix C as followed:
\( C={({c_{ij}})_{n×n}}=(\begin{matrix}{c_{11}} & ⋯ & {c_{1n}} \\ ⋮ & ⋱ & ⋮ \\ {c_{n1}} & ⋯ & {c_{nn}} \\ \end{matrix}) \) (2)
Where is covariance of i and j and n is the number of samples.
2.3.2. Test of Goodness of Fit:(= 0.1 significance level). The theory of test of goodness of fit is independence test [7]. The independence of events is judged by the consistency between the observed number and the theoretical number, that is, whether the two events are independent or whether the difference between processing is significant.
\( {H_{0}} \) : Observed frequency( \( {f_{0}} \) ) is consistent with expected frequency \( {(f_{e}} \) )
\( {H_{1}} \) : Observed frequency( \( {f_{0}} \) ) is inconsistent with expected frequency \( {(f_{e}} \) )
\( \begin{cases} \begin{array}{c} {H_{1}},\sum \frac{{(f_{0}}−{f_{e}}{)^{2}}}{{f_{e}}} \gt χ_{α}^{2}(R−1) \\ {H_{0}}, otℎerwise \end{array} \end{cases} \) (3)
Where R denotes numbers of categorical variables.
2.3.3. Discriminant analysis model (The square variance of the distance between the sample x and the two populations). The theory of discriminant analysis model is the classification [8]. The center of gravity coordinates of each category are obtained from the training samples, and then the distance between the new samples and the center of gravity of each category is calculated, so as to be assigned to the nearest class. In the passage, the two class is canceling the reservation and not canceling the reservation, and given a specific data, the model will classify it to the class it belongs.
\( \widetilde{J(x)}={d^{2}}(x,\hat{{u_{1}}})−{d^{2}}(x,\hat{{u_{2}}}) \) (4)
\( {d^{2}}(x,\hat{{u_{1}}})=(x−\bar{{x_{1}}}{)^{ \prime }}{\hat{{Σ_{1}}}^{−1}}(x−\bar{{x_{1}}}) \) (5)
\( {d^{2}}(x,\hat{{u_{2}}})=(x−\bar{{x_{2}}}{)^{ \prime }}{\hat{{Σ_{2}}}^{−1}}(x−\bar{{x_{2}}}) \) (6)
\( x=\begin{cases} \begin{array}{c} {x_{1}}, \widetilde{J(x)} \lt 0 \\ {x_{2}}, \widetilde{J(x)}≥0 \end{array} \end{cases} \) (7)
Where and represent the mean vector of two population, and represent the variance matrix of two population and x represent the sample vector.
2.4. Evaluation index
2.4.1. Pearson coefficient index. The Pearson correlation coefficient varies from -1 to +1, when r > 0 indicates that the two variables are positively correlated, that is, the larger the value of one variable, the larger the value of the other variable; r < 0 indicates that the two variables are negatively correlated, that is, the larger the value of one variable, the smaller the value of the other variable [9].
The greater the absolute value of r, the stronger the correlation between the two variables. If r=0, the correlation between the two variables is not linear, but there may be other ways of correlation (such as curve).
2.4.2. Accuracy of distance discriminant analysis. After the distance discriminant model is built, the test data are used to verify the model. About 200 data are randomly selected from the whole data set. If one customer is supposed to cancel the reservation but the model wrongly classifies him/her as not canceling, the error number will add one. The calculation formula is below:
\( P=\frac{N−e}{N} \) (8)
Where P denotes the accuracy rate, N denotes the total number of test data and e denotes the error number.
3. Results and discussion
3.1. Data visualization
The data in Table.1 already undergoes the data processing. There are some positions named inf in the description of the dataset, which means, on the average of all times of reservations those values are too small to show. Compared with the mean of number of weekend nights, the mean of number of weekday nights is smaller and it can draw a rough estimate that customers are likely to stay in the hotel at weekends.
Table 1. Hotel reservation data. | ||||||||
count | mean | std | min | 0.25 | 0.5 | 0.75 | max | |
no_of_adults | 36275 | inf | 0.52 | 0 | 2 | 2 | 2 | 4 |
no_of_children | 36275 | 0.11 | 0.4 | 0 | 0 | 0 | 0 | 10 |
no_of_weekend_nights | 36275 | 0.81 | 0.87 | 0 | 0 | 1 | 2 | 7 |
no_of_week_nights | 36275 | inf | 1.41 | 0 | 1 | 2 | 3 | 17 |
type_of_meal_plan | 36275 | 0.95 | 0.48 | 0 | 1 | 1 | 1 | 3 |
required_car_parking_space | 36275 | 0.03 | 0.17 | 0 | 0 | 0 | 0 | 1 |
room_type_reserved | 36275 | 1.71 | 1.4 | 1 | 1 | 1 | 1 | 7 |
lead_time | 36275 | inf | inf | 0 | 17 | 57 | 126 | 443 |
arrival_year | 36275 | inf | 0.91 | 2017 | 2018 | 2018 | 2018 | 2018 |
arrival_month | 36275 | inf | 3.07 | 1 | 5 | 8 | 10 | 12 |
arrival_date | 36275 | inf | 8.74 | 1 | 8 | 16 | 23 | 31 |
market_segment_type | 36275 | 0.8 | 0.62 | 0 | 0 | 1 | 1 | 4 |
repeated_guest | 36275 | 0.03 | 0.16 | 0 | 0 | 0 | 0 | 1 |
no_of_previous_cancellations | 36275 | 0.02 | 0.37 | 0 | 0 | 0 | 0 | 13 |
no_of_previous_bookings_not_canceled | 36275 | 0.15 | 1.75 | 0 | 0 | 0 | 0 | 58 |
avg_price_per_room | 36275 | inf | inf | 0 | 80.3 | 99.4 | 120 | 540 |
no_of_special_requests | 36275 | 0.62 | 0.79 | 0 | 0 | 0 | 1 | 5 |
booking_status | 36275 | 0.33 | 0.47 | 0 | 0 | 0 | 1 | 1 |
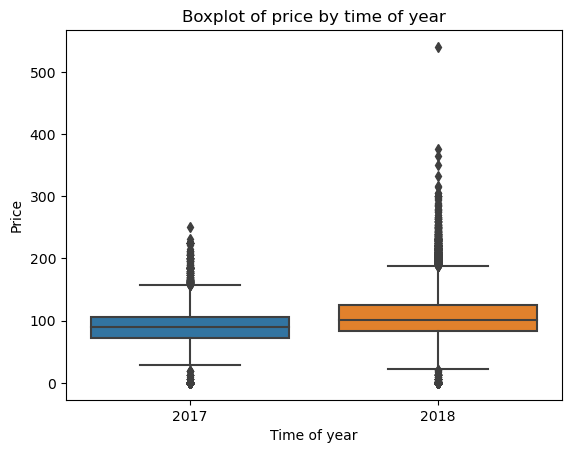
Figure 1. Boxplot of price and time of year.
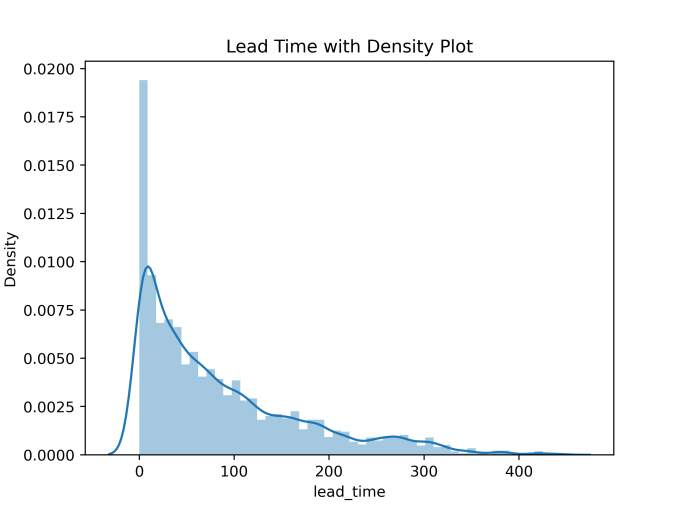
Figure 2. Density plot of lead_time.
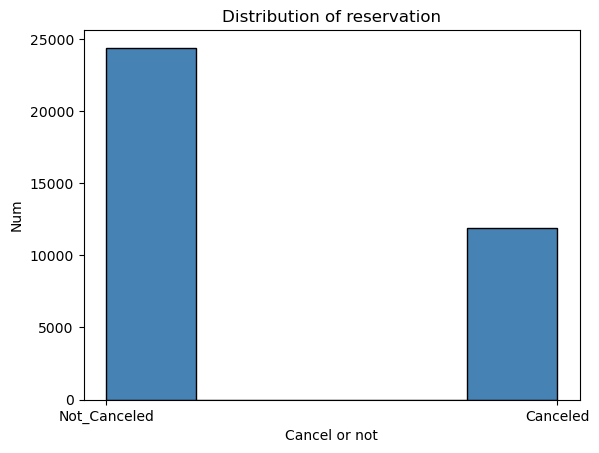
Figure 3. Distribution of reservation.
The boxplot in the Figure.1 shows a little increase of prices per room from 2017 to 2018. At another point, due to the big data, some outliers are found. It is possible to learn from this that the room price can sometimes reach a pretty high status considering the unknown situation at that time. The plot in Figure.2 has an intuitive view of lead_time density. About 50 percent people choose to book the hotel 57 days ahead of time according to the description in Table, which is consistent with the distribution in the Figure. What’s more, about one third of total customers cancel the reservation in Figure.3.
3.2. Statistic analysis
In this part, the main content is to calculate the correlation of the data, determine whether two variables are independent or not and build a discriminant analysis model. The correlation is necessary for determine whether relationship is positive, or negative, or irrelevant. Since irrelevant is not necessarily independent, Test of Goodness of Fit is suitable to analyze the dependence of two variables. Finally, building a model can give a direct result of the booking status without a large degree of deviation.
3.2.1. Correlation analysis.
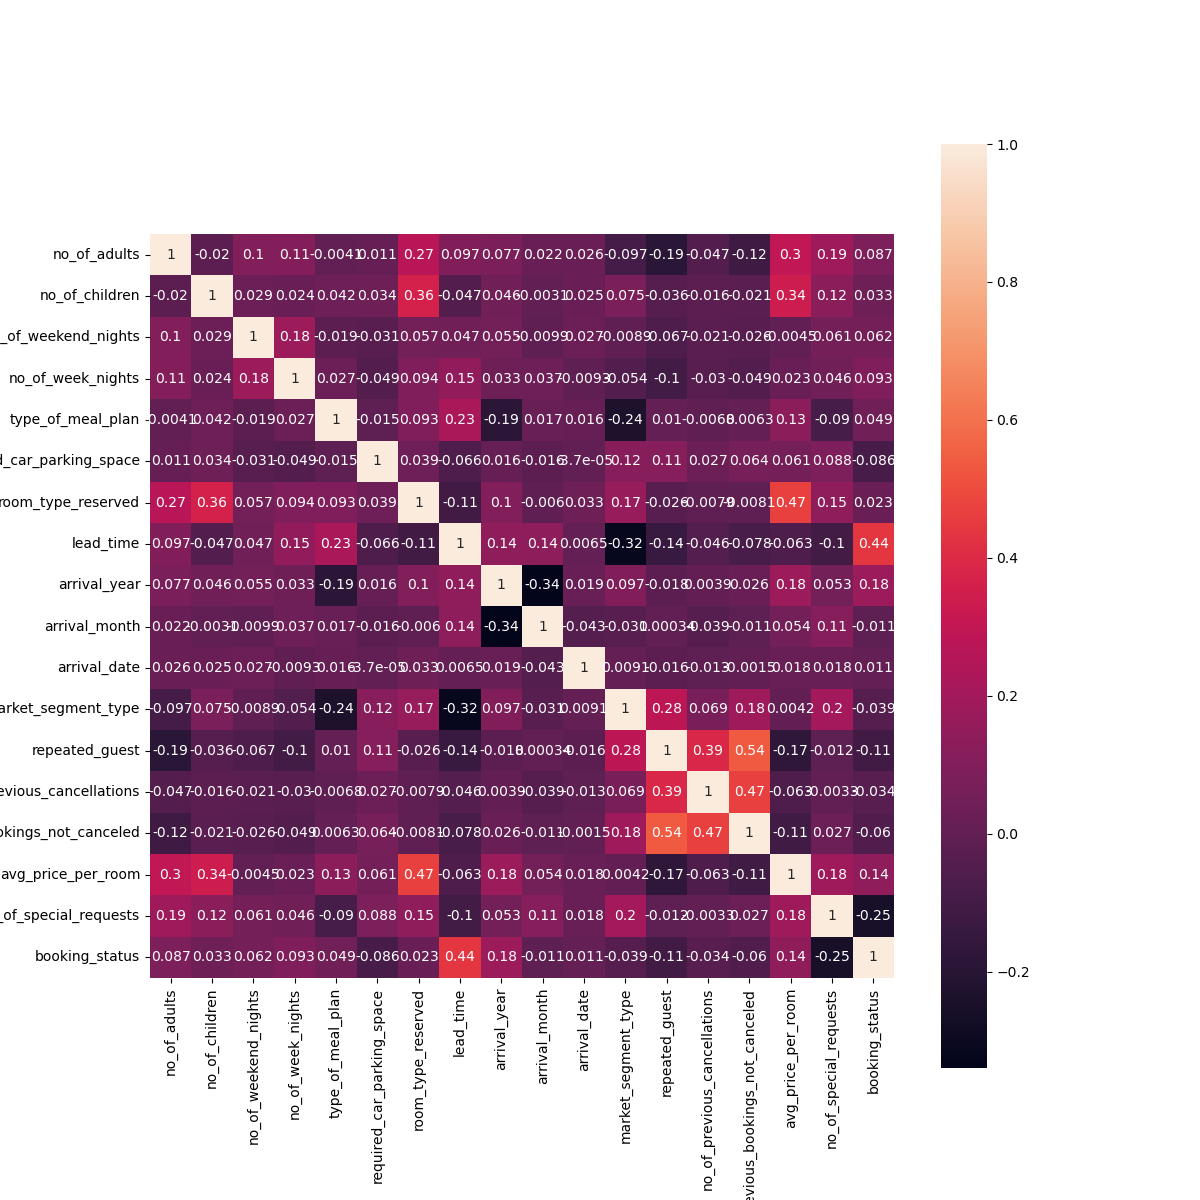
Figure 4. Correlation of variables.
The correlation coefficients in Figure.4 shows that some variables contribute a lot to the booking status, while others have little relationships. Among the factors, lead time has a score of 0.44 in the relationship with booking status, which means that the earlier customers book the hotel, the more possible he/she will cancel the reservation. This is the same as the gut intuition. What is interesting is the number of special requests has a negative impact on canceling the reservation. It seems that the more requests customers put forward, the more details hotels cannot satisfy and it will lead to the canceling of the hotel. However, there is one possible explanation. When the customer raises a lot requests, he/she pays more attention and wishes to have a better experience. So if there's no big problem, the customer is likely to settle in this hotel.
There are also some pairs showing high correlation, such as not_canceled and repeated guests, price and type of room, arrival month and arrival date in Figure.5. The honeycomb diagram shows the relationship between arrival month and date. The darker the color, the more people book. It can be seen that people arrive at the hotel mostly in the mid-month of August, September, and October.
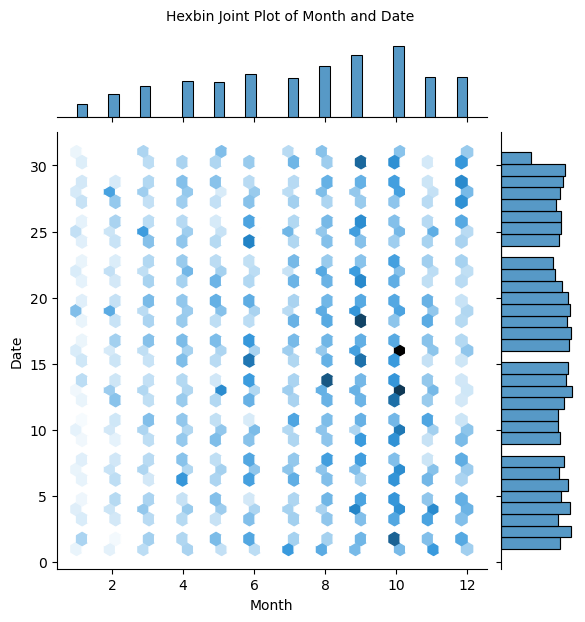
Figure 5. Hexbin joint plot of month and date.
After the analysis of all customers’ data, the analysis of canceled reservation shows a characteristic of those customers in Figure.6. Since repeated_guest and previous_cancellations have a high score of 0.63, it seems that customers who stay there once choose to book it as a guarantee but seek to book for a better hotel.
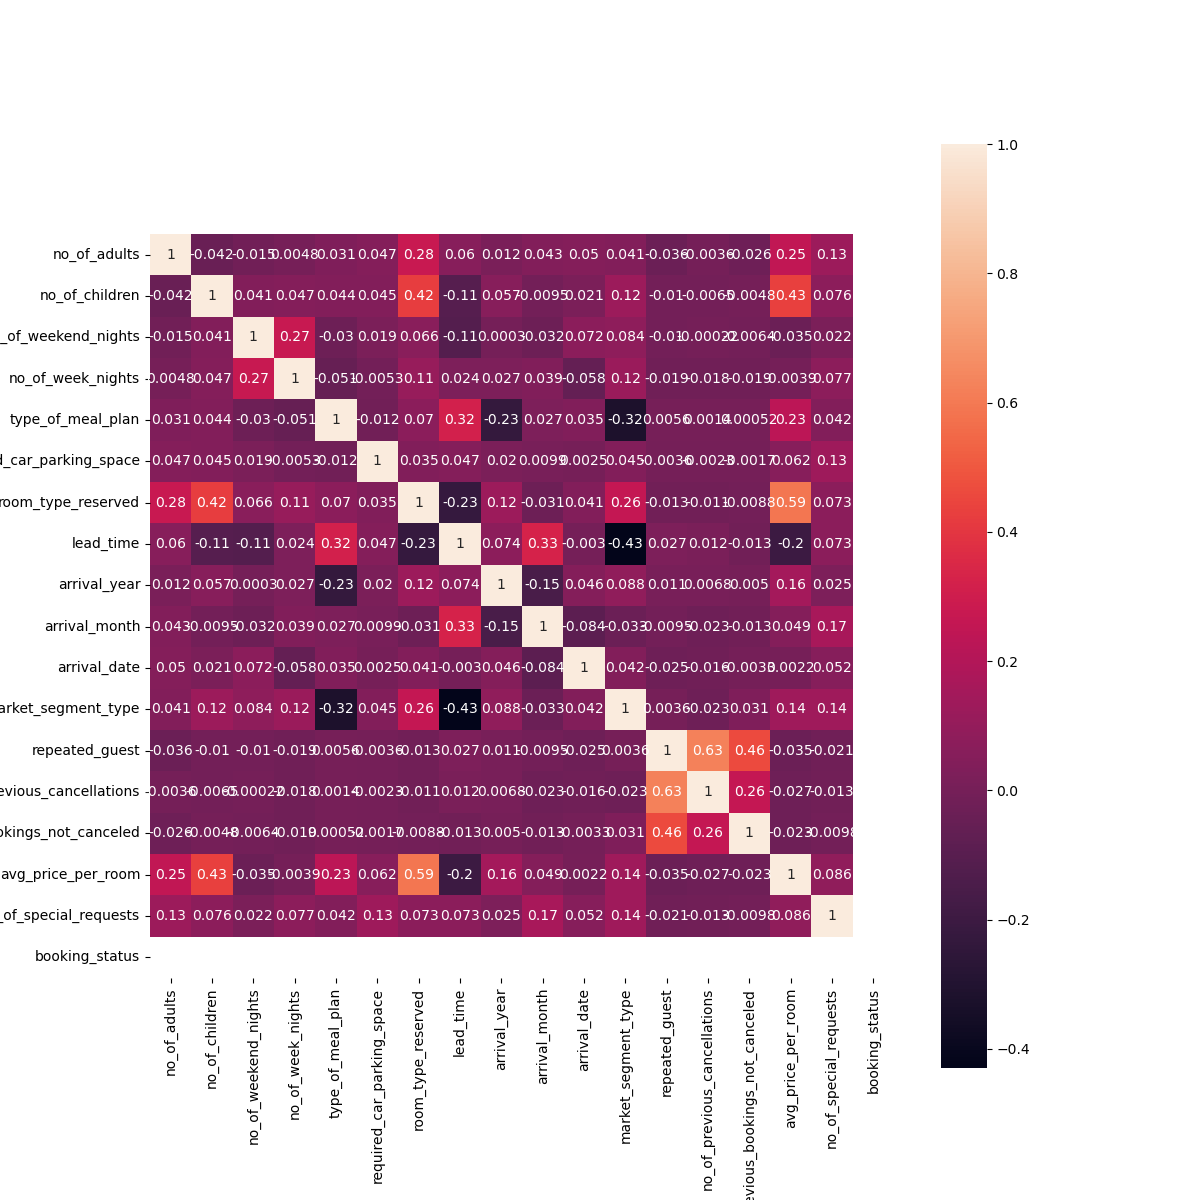
Figure 6. Correlation under canceled reservation
3.2.2. Test of goodness of fit. Since there are many categorical variables in the data, it is difficult to employ the methods of Principle Component Analysis to reduce the dimension of data. Another reason is that every variable has a roughly equivalent eigenvalue, the result of PCA is not distinctive. So, Test of Goodness of Fit can be used to analyze whether a factor has an influence on the booking status. In this article, whether having a child in the trip contributes to the booking status is studied. This paper supposes that the observed frequency is consistent with the expected frequency.
Table 2. Test of goodness of fit. | ||||||
no_of_children | total times | Not canceling times(Observed frequency \( { f_{0}} \) ) | Expected frequency( \( {f_{e}} \) ) | \( {f_{0}}−{f_{e}} \) | \( {(f_{0}}−{f_{e}}{)^{2}} \) | \( \frac{{(f_{0}}−{f_{e}}{)^{2}}}{{f_{e}}} \) |
0 | 33577 | 22695 | 22576 | 119 | 14161 | 0.63 |
>0 | 2698 | 1695 | 1814 | -119 | 14161 | 8.35 |
total | 36275 | |||||
It can be obtained from the square distribution table that \( χ_{0.1}^{2}(1)=2.706 \) .
\( \sum \frac{{(f_{0}}−{f_{e}}{)^{2}}}{{f_{e}}}=8.98 \gt χ_{0.1}^{2}(1)=2.706 \) (9)
Because of Formula (9), the null hypothesis is rejected and the result in Table 2 suggests that the number of children has a significant effect on the booking status.
3.2.3. Discriminant analysis. There are three main methods, Fisher discriminant analysis [10], Bayes discriminant analysis and Distance discriminant analysis, to deal with discriminant analysis and distance discriminant analysis is the most applicable in this paper. The main idea of Fisher discriminant analysis is the projection, projecting a point in a higher dimensional space onto a lower dimensional space. However, the higher the dimension, the more difficult the subsequent calculation. It will increase time complexity, so it is not adopted. The main idea of Bayes discriminant analysis is to calculate the probability that the sample belongs to a class, and then select the class with the greatest posterior probability as the class to which the sample belongs. Because it assumes that the characteristic attributes are independent, while most data are highly related, this method is not adopted.
According to the distance between the samples to be judged and the samples of known categories, distance discrimination analysis is made. It mainly depends on the information of the limited neighboring samples, rather than the method of discriminating the class domain to determine the category, which is a huge advantage fitted in the paper.
Given that more variables will cause the matrix degradation because most variables are categorical, only eight factors are selected to do the discriminant analysis. They are no_of_adults, no_of_children, no_of_weekend_nights, no_of_week_nights, room_type_reserved, arrival_month, arrival_date and avg_price_per_room. Due to the big dataset, about 0.1 percent of data is used to form the function model in Figure.7 and about 200 pieces of data randomly selected to verify the accuracy of the model. According to the result, the accuracy can reach about 99 percent. However, this accuracy is based on the selected variables. If more categorical variables are selected, the inverse of matrix will not exist and the accuracy will have a large fluctuation.
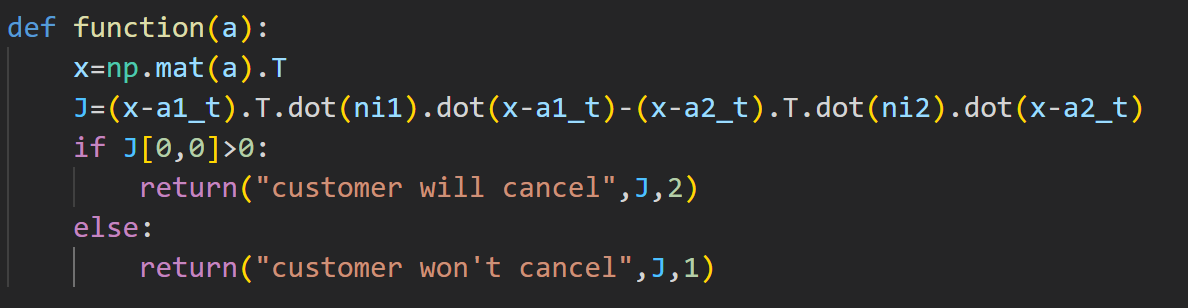
Figure 7. Distance discriminant analysis model.
3.3. Limitation
In short, the correlation analysis shows a moderate strength relationship and the result of discriminant analysis shows a floating accuracy due to the random sampling condition. However, there are some limitations in the analysis.
Firstly, the prediction of whether the customer will cancel or not may have a deviation from the fact. This is because the dataset has too many categorical values and this may cause the matrix degradation. What’s more, the training set is a little bit small. However, if the set become larger, the value of the estimate sigema of the population will become infinite.
Secondly, only the influencing factors contained in the dataset are analyzed, while there are more factors not in the data having a strong impact on the hotel reservation, such as the local policy and weather conditions.
Thirdly, the method in this paper has limitations on analytical correlation. This article uses Pearson correlation to form the matrix C and analyze the relationship between two variables. Pearson correlation has two disadvantages. One is the outliers performance. When an outlier is far away from other data, Pearson correlation coefficient will become much larger and the correlation of other points can not be expressed more objectively. The other is the type of the correlation. Pearson correlation can only deal with and reflect simple linear correlation. When two variables have a more complicated relationship, even if highly related, Pearson correlation coefficient can be zero.
4. Conclusion
The study found that even though each variable does not have a strong relationship with the booking status, the reservation does have a dependence on some variables, like number of children. According to data analysis, the header time customer books, the more possible he/she will cancel the reservation. The month customer decide to arrive at the hotel concentrates on August,September and October and the dates are among fifteenth and twentieth. What’s more, when considering the dependence of no_of_children and booking status, the outcome denies the null hypothesis that number of children is independent on the booking status. Finally, after deleting some variables, the booking status is dividing into two class and the discriminant analysis model shows a high accuracy. Given a data that contains the value of those variables, the model can classify the sample into the correct class with a accuracy of 99%.
The study’s main purpose is to find out if the objective conditions like number of adults and price instead of subjective factors like customers feeling will contribute to reservation canceling. It will benefit the hotel manager to have a intuitive estimation of whether the customer will cancel or not according to their own information.
In the end, this study failed to use PCA to reduce the dimension of data. As it is mentioned in the article above, the deal with PCA is difficult, since all the variables’ eigenvalues have little differences. In the future, the operation of compressing variables can be further refined to facilitate the in-depth study of this topic.
References
[1]. Ladhari R, Michaud M. EWOM effects on hotel booking intentions, attitudes, trust, and website perceptions. Int. J. Hosp. Manag, (2015), 46, pp. 36-45.
[2]. Muslim A, Kisang R, Cihan C, Nizam A. Determinants of online hotel booking intentions: website quality, social presence, affective commitment, and e-trust. J. Hospit. Market. Manag, (2021), 30(7), pp. 845-870.
[3]. Schober P, Boer C, Schwarte L A. Correlation coefficients: appropriate use and interpretation.Anesth. Analg, (2018), 126(5), pp. 1763-1768.
[4]. Lou C, Atoui M A, Li X. Novel online discriminant analysis based schemes to deal with observations from known and new classes: Application to industrial systems. Eng. Appl. Artif. Intell., 111 (2022), Article 104811.
[5]. Edelmann D, Móri T F, Székely G J. On relationships between the pearson and the distance correlation coefficients. Statist. Probab. Lett., 169 (2021), Article 108960, 10.1016/j.spl.2020.108960.
[6]. Rovetta A. Raiders of the Lost Correlation: A Guide on Using Pearson and Spearman Coefficients to Detect Hidden Correlations in Medical Sciences. Cureus, (2020), 12, e11794.
[7]. Arnastauskaitė J, Ruzgas T, Bražėnas M. An Exhaustive Power Comparison of Normality Tests. Mathematics, (2021), 9, 788.
[8]. Shariatnia S, Ziaratban M, Rajabi A, Salehi A, Abdi Zarrini K, Vakili M. Modeling the diagnosis of coronary artery disease by discriminant analysis and logistic regression: a cross-sectional study. BMC Med Inform Decis Mak, (2022), 22(1), 1.
[9]. Avdeef A. Do you know your r2? ADMET DMPK , (2021), 9, 69–74.
[10]. Chen B W. Incomplete data classification—Fisher discriminant ratios versus welch discriminant ratios. Future Gener. Comput. Syst., (2020), 108, 894-908.
Cite this article
He,J. (2023). Influencing factors of hotel reservation and prediction. Theoretical and Natural Science,19,281-290.
Data availability
The datasets used and/or analyzed during the current study will be available from the authors upon reasonable request.
Disclaimer/Publisher's Note
The statements, opinions and data contained in all publications are solely those of the individual author(s) and contributor(s) and not of EWA Publishing and/or the editor(s). EWA Publishing and/or the editor(s) disclaim responsibility for any injury to people or property resulting from any ideas, methods, instructions or products referred to in the content.
About volume
Volume title: Proceedings of the 2nd International Conference on Computing Innovation and Applied Physics
© 2024 by the author(s). Licensee EWA Publishing, Oxford, UK. This article is an open access article distributed under the terms and
conditions of the Creative Commons Attribution (CC BY) license. Authors who
publish this series agree to the following terms:
1. Authors retain copyright and grant the series right of first publication with the work simultaneously licensed under a Creative Commons
Attribution License that allows others to share the work with an acknowledgment of the work's authorship and initial publication in this
series.
2. Authors are able to enter into separate, additional contractual arrangements for the non-exclusive distribution of the series's published
version of the work (e.g., post it to an institutional repository or publish it in a book), with an acknowledgment of its initial
publication in this series.
3. Authors are permitted and encouraged to post their work online (e.g., in institutional repositories or on their website) prior to and
during the submission process, as it can lead to productive exchanges, as well as earlier and greater citation of published work (See
Open access policy for details).
References
[1]. Ladhari R, Michaud M. EWOM effects on hotel booking intentions, attitudes, trust, and website perceptions. Int. J. Hosp. Manag, (2015), 46, pp. 36-45.
[2]. Muslim A, Kisang R, Cihan C, Nizam A. Determinants of online hotel booking intentions: website quality, social presence, affective commitment, and e-trust. J. Hospit. Market. Manag, (2021), 30(7), pp. 845-870.
[3]. Schober P, Boer C, Schwarte L A. Correlation coefficients: appropriate use and interpretation.Anesth. Analg, (2018), 126(5), pp. 1763-1768.
[4]. Lou C, Atoui M A, Li X. Novel online discriminant analysis based schemes to deal with observations from known and new classes: Application to industrial systems. Eng. Appl. Artif. Intell., 111 (2022), Article 104811.
[5]. Edelmann D, Móri T F, Székely G J. On relationships between the pearson and the distance correlation coefficients. Statist. Probab. Lett., 169 (2021), Article 108960, 10.1016/j.spl.2020.108960.
[6]. Rovetta A. Raiders of the Lost Correlation: A Guide on Using Pearson and Spearman Coefficients to Detect Hidden Correlations in Medical Sciences. Cureus, (2020), 12, e11794.
[7]. Arnastauskaitė J, Ruzgas T, Bražėnas M. An Exhaustive Power Comparison of Normality Tests. Mathematics, (2021), 9, 788.
[8]. Shariatnia S, Ziaratban M, Rajabi A, Salehi A, Abdi Zarrini K, Vakili M. Modeling the diagnosis of coronary artery disease by discriminant analysis and logistic regression: a cross-sectional study. BMC Med Inform Decis Mak, (2022), 22(1), 1.
[9]. Avdeef A. Do you know your r2? ADMET DMPK , (2021), 9, 69–74.
[10]. Chen B W. Incomplete data classification—Fisher discriminant ratios versus welch discriminant ratios. Future Gener. Comput. Syst., (2020), 108, 894-908.