


1. Introduction
With economic globalisation and intensified market competition, enterprises need to continuously improve efficiency and reduce costs, and employee turnover can cause huge human resource costs and productivity losses for enterprises [1]. At the same time, in the context of aging population and social transformation, employees have higher requirements for corporate culture and values, which also increase the risk of employee turnover. Therefore, it is important to study employee turnover analysis for enterprises to achieve sustainable development [2].
Data analysis plays an important role in employee turnover analysis. By collecting, organising and analysing a large amount of data, it can reveal the real reasons behind employee turnover and provide data support for the development of effective turnover prediction models [3]. At the same time, data analysis can also help companies to predict the trend and assess the risk of employee turnover, so as to take appropriate measures to reduce the employee turnover rate.
Machine learning also plays an important role in employee turnover analysis. By building machine learning models, it can more accurately predict whether employees will leave and provide decision support for enterprises to develop more scientific and effective human resource management strategies [4,5]. For example, by training on historical data, an exit prediction model can be built, which can predict whether employees will leave their jobs based on their personal information, performance evaluations, salary levels, and other factors, and provide corresponding interventions for enterprises [6].
Data analytics and machine learning play an important role in this field, which can help companies better understand the causes and trends of employee turnover and develop corresponding measures to reduce the employee turnover rate.
2. Data sources and data visualisation
The dataset used in this paper is a non-open-source private dataset, which includes information on indicators such as employee satisfaction with the company, evaluation, number of projects, average monthly working hours, time spent in the company, workplace accidents, departures, promotions in the last 5 years, sales and salary.
Statistical analysis of each data indicator is carried out to visualise the number of projects completed by employees, time spent in the company, work accidents and departures, and to observe the distribution of each employee on these indicators, and the results are shown in Figure 1.
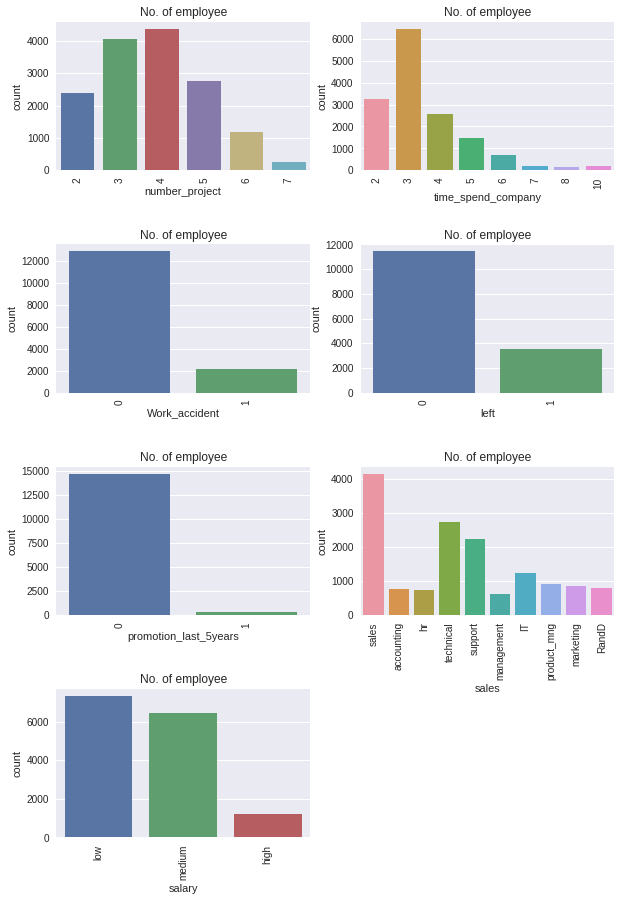
Figure 1. Visualisation and analysis.
(Photo credit: Original)
As can be seen in Figure 1, in terms of the number of projects completed, more than 4,500 employees completed 4 projects, ranking in the second category were those who completed 3 projects, most of the employees completed a total of 3-5 projects in a year, and only a very small number of employees were able to complete 6 and more projects. In terms of time spent by employees in the company, most of the employees were 3 hours, few were 2 and 4 hours and very few were more than 5 hours. In terms of accidents at work, more than 80 per cent of employees had no accidents at work and 2,000 employees had 1 accident at work. Similarly, in terms of turnover rate, more than 80% of the employees have not left the company, while around 3,000 employees have left the company during the year.
A visual analysis of promotions, sales and salaries for the last 5 years was carried out to observe the distribution of individual employees on these indicators and the results are shown in Figure 2.

Figure 2. Visualisation and analysis.
(Photo credit: Original)
As can be seen in Figure 2, in terms of employee promotions in the last five years, it can be observed that only a very small number of people have completed career advancement. In terms of sales, it is more balanced across projects. In terms of employee salary, there is a stepwise decline from low to high.
3. Statistical Analysis of Separation Data
In order to analyse the correlation between employee separation and the existence of various indicators, this paper takes whether to leave as a classification criterion, counts the distribution of separated and unseparated personnel in each indicator, and observes the correlation between each indicator and the existence of separation, and the results are shown in Figure 3.


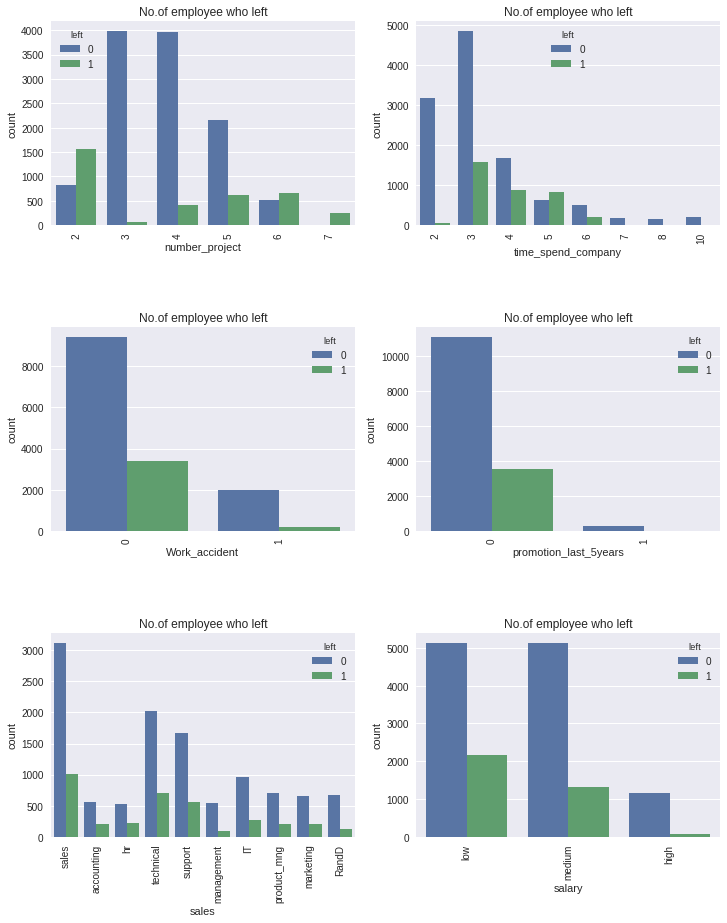
Figure 3. Visualisation and analysis.
(Photo credit: Original)
As can be seen in Figure 3, employees who were promoted in the last 5 years did not leave the company, i.e. all employees who left the company were not promoted in the last 5 years. Also, the percentage of employees who left the company is higher for those who have worked for 5 years, which may be due to the fact that they have not been promoted in the last 5 years. On the other hand, those who have been with the company for more than 6 years did not leave, probably because they were emotionally attached to the company. A more interesting point is that those who did 7 projects left the company, while none of those who worked for more than 6 years left the company, which means that those who did more projects in a shorter year left the company.
4. Relevance analysis
Pearson's correlation analysis is a commonly used statistical method to measure the strength and direction of a linear relationship between two variables. It can be used to derive the correlation coefficient by calculating the covariance and standard deviation of the two variables, which can take values ranging from -1 to 1. When the correlation coefficient is positive, it means that the two variables are positively correlated; when the correlation coefficient is negative, it means that the two variables are negatively correlated; when the correlation coefficient is close to 0, it means that there is no linear relationship between the two variables. In order to quantitatively explore the correlation of the indicators, Pearson correlation analysis was carried out to calculate the correlation coefficients between the indicators and to draw the correlation heat map, and the results are shown in Figure 4.
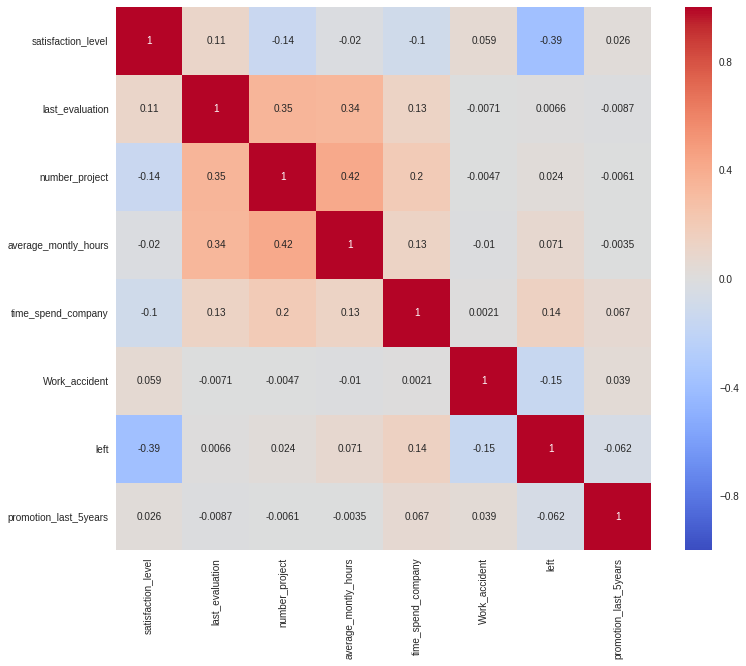
Figure 4. Relevance analysis.
(Photo credit: Original)
From the correlation heat map we can see that no variable is correlated with each other and hence we can say that all the variables are uncorrelated. Hence without removing any feature we can use Random Forest Classifier to get the important features.
5. Method
In order to predict the employee turnover rate, this paper uses various machine learning methods to train and predict the data for predictive analysis of employee turnover. A total of five machine learning algorithms are introduced in this paper, which are Random Forest Model, Support Vector Machine Model, KNN Model, Plain Bayesian Model and Logistic Regression Model.
Random forest model is an integrated learning algorithm based on decision tree, which is able to handle high-dimensional data and a large number of training samples, and is suitable for classification and regression problems [7].
Support vector machine model is a binary classification model, which achieves classification by finding the optimal hyperplane, has strong generalisation ability and robustness, and is widely used in text classification, image recognition and other fields [8].
KNN model is a classification algorithm based on proximity points, which determines the category to which the data to be classified belongs by calculating the distance between the data to be classified and the known data, and it needs to consider issues such as the choice of K value and distance metric method in practical applications [9].
Simple Bayesian model is a classification algorithm based on Bayes' theorem, which determines the category of the data to be classified by calculating the prior probability and conditional probability, and it is widely used in the fields of text classification, spam filtering and so on [10].
Logistic regression model is a generalised linear model for binary classification problems, which maps the input variables to the output variables by constructing a logistic function, and uses maximum likelihood estimation method for parameter estimation. It is widely used in the fields of advertisement click rate prediction and credit scoring.
6. Experiments and Results
Dividing the training set and test set according to the ratio of 6:4, 60% of the data were used for training and 40% for testing, the variables of employees' satisfaction with the company, evaluation, number of projects, average monthly working hours, time spent in the company, and workplace accidents were used as input variables, and leaving (0 means not leaving, 1 means leaving) was the variable to be predicted, and the training and testing were carried out by using the Random Forest Model, the Support Vector Machine Model, the KNN Model, the Plain Bayesian Model, and the Logistic Regression Model, respectively, and the results are shown in Table 1.
Table 1. Modelling evaluation.
Classification Model | Accuracy |
Random forest | 0.988 |
Support vector | 0.951 |
KNN | 0.948 |
Naive bays | 0.804 |
Logistic regression | 0.772 |
From the results, it can be seen that the best prediction result in terms of employee turnover rate is the Random Forest model with a prediction accuracy of 98.8%, followed by the Support Vector Machine model with an accuracy of 95.1%. Also, the KNN model achieved 94.8% accuracy. The plain Bayesian and logistic regression models had poorer accuracy rates of only 80.4% and 77.2%.
7. Conclusion
This paper focuses on issues related to the analysis of employee turnover, aiming to help enterprises better understand the risk of employee turnover and improve their productivity and human resource management capabilities. Through the statistical analysis and visual analysis of various data indicators, we observe the distribution of each employee on these indicators, and take whether to leave as a classification criterion, count the distribution of separated and unseparated personnel in each indicator, and explore the correlation between each indicator and separation.
This paper adopts the Pearson correlation analysis method to quantitatively explore the correlation between the indicators. At the same time, Random Forest Model, Support Vector Machine Model, KNN Model, Plain Bayesian Model and Logistic Regression Model were used for training and testing to predict whether the employees will leave the company or not. Through the results, it was found that the best prediction result in terms of employee turnover was the Random Forest model with 98.8% prediction accuracy, followed by the Support Vector Machine model with 95.1% accuracy. Also, the KNN model achieved 94.8% accuracy. However, the accuracy of the plain Bayesian model and logistic regression model is poorer, only 80.4% and 77.2%.
Overall, the findings of this paper show that there is a certain correlation between the indicators and that they can be used to effectively predict whether employees will leave their jobs through machine learning models. Enterprises can take appropriate measures to reduce employee turnover and improve productivity and human resource management capabilities based on these findings.
References
[1]. Ma, Danqing et al. “Implementation of computer vision technology based on artificial intelligence for medical image analysis.” International Journal of Computer Science and Information Technology (2023): n. pag.
[2]. Zang, Hengyi, et al. "Evaluating the social impact of ai in manufacturing: A methodological framework for ethical production." Academic Journal of Sociology and Management 2.1 (2024): 21-25.
[3]. Relebohile L .Investigating Employee Perceptions of a Communication Strategy for Higher Education Institutions in Lesotho[J].Communicatio,2023,49(2):113-136.
[4]. Agnieszka P ,Lukas S ,W. G M .Corporate social responsibility and employee innovative behaviors: A meta-analysis[J].Journal of Cleaner Production,2023,393
[5]. W R M H ,I D P .Automation, organizational ambidexterity and the stability of employee relations: new tensions arising between corporate entrepreneurship, innovation management and stakeholder management.[J].The Journal of technology transfer,2023,48(6):21-29.
[6]. Gibbson A ,Nyarko A A ,Emmanuel N , et al.Reducing waste management challenges: Empirical assessment of waste sorting intention among corporate employees in Ghana[J].Journal of Retailing and Consumer Services,2023,72
[7]. Garfatta R .Employee stock ownership and earnings management: evidence from France[J].International Journal of Management Practice,2023,16(2):249-265.
[8]. Kartick G ,Chandra K .Does employees' interest matter more than shareholders’ interest in determining cash management policy?[J].International Review of Economics and Finance,2023,84568-589.
[9]. Wei L ,Weining L ,Veikko S , et al.How and when does perceived greenwashing affect employees' job performance? Evidence from China[J].Corporate Social Responsibility and Environmental Management,2022,29(5):1722-1735.
[10]. Yuanyuan L ,Israr A ,Hassan R , et al.The Impact of Social Entrepreneurship, Corporate Social Responsibilities, and Working Capital Management Practices on the Performance of Tourism Small–Medium Enterprises (SMEs) During COVID-19: Moderating Role of Employee Behavior#13;[J].Frontiers in Psychology,2022,13869856-869856.
Cite this article
Zhang,J.;Cao,Z.;Qu,H.;Wang,M. (2024). Management and prediction of employee turnover in enterprises based on big data analytics and machine learning. Applied and Computational Engineering,76,103-108.
Data availability
The datasets used and/or analyzed during the current study will be available from the authors upon reasonable request.
Disclaimer/Publisher's Note
The statements, opinions and data contained in all publications are solely those of the individual author(s) and contributor(s) and not of EWA Publishing and/or the editor(s). EWA Publishing and/or the editor(s) disclaim responsibility for any injury to people or property resulting from any ideas, methods, instructions or products referred to in the content.
About volume
Volume title: Proceedings of the 2nd International Conference on Software Engineering and Machine Learning
© 2024 by the author(s). Licensee EWA Publishing, Oxford, UK. This article is an open access article distributed under the terms and
conditions of the Creative Commons Attribution (CC BY) license. Authors who
publish this series agree to the following terms:
1. Authors retain copyright and grant the series right of first publication with the work simultaneously licensed under a Creative Commons
Attribution License that allows others to share the work with an acknowledgment of the work's authorship and initial publication in this
series.
2. Authors are able to enter into separate, additional contractual arrangements for the non-exclusive distribution of the series's published
version of the work (e.g., post it to an institutional repository or publish it in a book), with an acknowledgment of its initial
publication in this series.
3. Authors are permitted and encouraged to post their work online (e.g., in institutional repositories or on their website) prior to and
during the submission process, as it can lead to productive exchanges, as well as earlier and greater citation of published work (See
Open access policy for details).
References
[1]. Ma, Danqing et al. “Implementation of computer vision technology based on artificial intelligence for medical image analysis.” International Journal of Computer Science and Information Technology (2023): n. pag.
[2]. Zang, Hengyi, et al. "Evaluating the social impact of ai in manufacturing: A methodological framework for ethical production." Academic Journal of Sociology and Management 2.1 (2024): 21-25.
[3]. Relebohile L .Investigating Employee Perceptions of a Communication Strategy for Higher Education Institutions in Lesotho[J].Communicatio,2023,49(2):113-136.
[4]. Agnieszka P ,Lukas S ,W. G M .Corporate social responsibility and employee innovative behaviors: A meta-analysis[J].Journal of Cleaner Production,2023,393
[5]. W R M H ,I D P .Automation, organizational ambidexterity and the stability of employee relations: new tensions arising between corporate entrepreneurship, innovation management and stakeholder management.[J].The Journal of technology transfer,2023,48(6):21-29.
[6]. Gibbson A ,Nyarko A A ,Emmanuel N , et al.Reducing waste management challenges: Empirical assessment of waste sorting intention among corporate employees in Ghana[J].Journal of Retailing and Consumer Services,2023,72
[7]. Garfatta R .Employee stock ownership and earnings management: evidence from France[J].International Journal of Management Practice,2023,16(2):249-265.
[8]. Kartick G ,Chandra K .Does employees' interest matter more than shareholders’ interest in determining cash management policy?[J].International Review of Economics and Finance,2023,84568-589.
[9]. Wei L ,Weining L ,Veikko S , et al.How and when does perceived greenwashing affect employees' job performance? Evidence from China[J].Corporate Social Responsibility and Environmental Management,2022,29(5):1722-1735.
[10]. Yuanyuan L ,Israr A ,Hassan R , et al.The Impact of Social Entrepreneurship, Corporate Social Responsibilities, and Working Capital Management Practices on the Performance of Tourism Small–Medium Enterprises (SMEs) During COVID-19: Moderating Role of Employee Behavior#13;[J].Frontiers in Psychology,2022,13869856-869856.