


1. Introduction
Alzheimer's Disease (AD), which is the predominant cause of dementia, is a progressive disease characterized by memory decline beyond normal aging. Despite substantial efforts to develop therapies or drugs, the cessation of neurodegeneration remains an elusive goal. However, slowing its progression and alleviating symptoms is attainable [1], especially in early stages like mild cognitive impairment (MCI) [2] and subjective cognitive decline (SCD) [3]. Traditional biomarkers for AD are invasive (cerebral spinal fluid amyloid), expensive (neuroimaging), or professional knowledge-intensive (neuropsychological tests such as Mini-Mental State Examination (MMSE) and logistic memory test), despite their well-documented accuracy or sensitivity. This makes novel measures which are cost- effective and convenient crucial. Language from speech has emerged as a new digital biomarker thanks to its shared neuro substrates with memory [4-5], continuous development with disease progression [6], and sensitivity to disease onset even in very early stages [7]. Language also offers practical benefits including low-cost data collection and the potential for automated analyses using natural language processing tools.
The mathematical properties of speech signals, such as the speech spectrum, have demonstrated considerable promise in the detection of AD. Temporal and acoustic parameters were also found to change in very early stages, such as prolonged syllables [8], less fluctuation in frequency (jitter) but more fluctuations in amplitude (shimmer) [9-10], vocal dysperiodicity [11], and prosodic formant envelopes [12]. Notably, speech breaks, i.e., pauses, emerge as promising features. Increased pauses in speech have been observed in MCI patients with AD pathology, correlating with episodic memory performance [13]. Similar patterns were also reported in many other studies [14-18].
Prior research has shown the efficacy of machine learning algorithms utilizing acoustic features for AD prediction [19]. [20], using an English dataset, achieved accuracy scores of 72% in classifying AD from controls using acoustic features with a support vector machine model. [21], using the same English dataset, applied a random forest algorithm with acoustic features to classify AD from controls and got an accuracy of 72.6% before data augmentation and 82.2% after data augmentation in an English dataset. Despite the satisfactory performance observed, it is imperative to acknowledge that the prevailing studies predominantly use the dataset from the InterSpeech challenge and its source corpus (Pitt Corpus) [22-23] which contains speech (elicited from picture description) in American English. Notably, datasets in other languages were either insufficient in size to facilitate the training of reliable machine learning models or exhibited significant heterogeneity compared to the English dataset, for example, encompassing divergent tasks and settings.
Dementia is on the rise worldwide, especially in low and middle income countries, which currently accounted for 60% of Dementia cases in 2020 with this number rising to 71% by 2050. China, India, and their south Asian and western Pacific neighbors will exhibit the fastest growth of Dementia cases in their elderly populations [24]. This study aims to construct a speech based classifier which can be generalized across languages so that patients who speak different languages are given equal access to this non-invasive and low cost method of detection. A classification model will be trained on the public English dataset and tested on Greek and Spanish datasets, and both the generalizability and interpretability of the model will be examined. My research questions are as follows:
(1) Can a speech-based algorithm effectively facilitate AD detection?
(2) Is the model capable of generalizing its performance across different languages?
(3) Can the model perform equivalently on unseen data, reflecting its generalizability to new datasets and real-world scenarios?
(4) What are the key features that the model predominantly learns from in the process of AD detection?
I hypothesize that building such a model will be possible. The speech features reflecting the quality of the voice, such as loudness and noise ratio, could be among the most significant features across the languages from which the model learns, based on previous findings on Spanish and Catalan data [25].
2. Methods
2.1. Dataset
Three datasets in different languages were utilized, i.e. English, Greek, and Spanish, sourced from Dementiabank [26]. The English and Greek datasets were derived from the ADDReSS-M challenge [27]. The English and Greek datasets encompass speech recordings of picture descriptions obtained from 237 and 54 older adults, respectively, categorized as either healthy controls (HC) or probable Alzheimer's disease (pAD). To ensure a balanced representation, both datasets underwent propensity score matching (PSM) for age and gender, to address potential confounding and bias in demographic factors [27]. The Spanish Ivanova Corpus [28] was used for the Spanish Data, and gathered speech data through a reading task where participants were instructed to read the first two sentences of Don Quixote by Cervantes. Similar to the English and Greek datasets, participants from the Ivanova Corpus were also selected using the PSM approach to alleviate potential bias. Comprehensive demographic details for the three datasets can be found below in Table 1.
Table 1. Demographic data for the English, Greek, and Spanish datasets
Language | Variables | HC | pAD | Test | p value |
English | Number | 115 | 122 | / | / |
Age | 66.06 | 69.38 | T Test | < .001*** | |
Gender | 65.22% | 64.75% | χ2 Test | < .940 | |
Education | 13.98 | 11.97 | T Test | < .001*** | |
MMSE | 28.97 | 17.84 | T Test | <.001*** | |
Greek | Number | 28 | 26 | / | / |
Age | 66.57 | 72.73 | T Test | .002** | |
Gender | 71.43% | 73.07% | χ2 test | .893 | |
Education | 12.00 | 9.50 | T Test | .025* | |
MMSE | 28.82 | 20.96 | T Test | < .001* | |
Spanish | Number | 45 | 74 | / | / |
Age | 77.80 | 79.49 | T Test | .257 | |
Gender | 60.00% | 59.46% | χ2 test | .954 | |
Education | 8.93 | 8.81 | T Test | .881 | |
MMSE | 28.39 | 19.97 | T Test | < .001*** |
Note: *Sex is represented as percentage of females. Education is measured in years. Age, Education, and MMSE are all represented by the mean values in each of their groups. * p < .05, ** p < .01, *** p < .001.
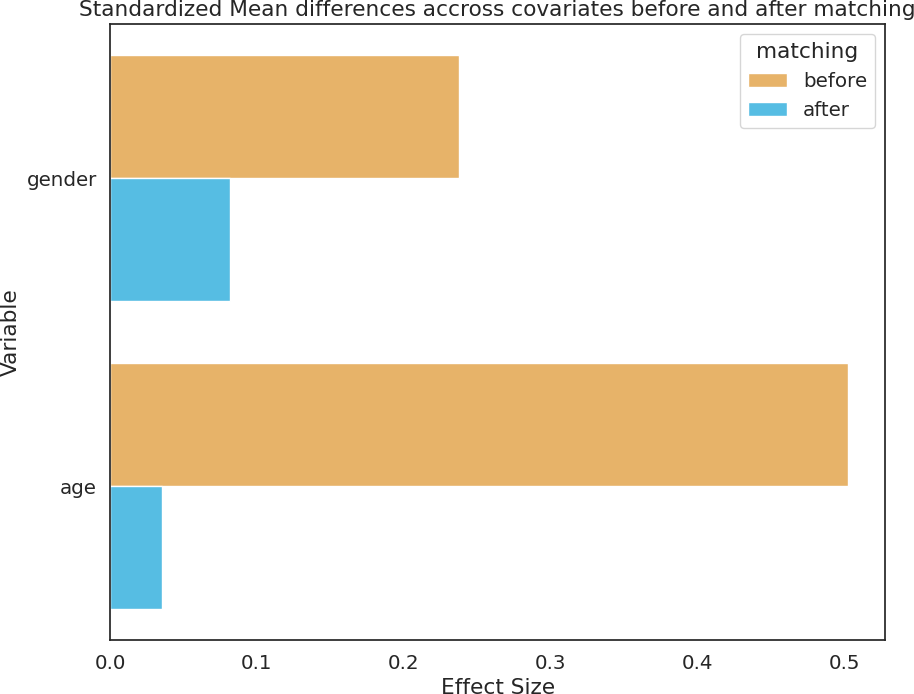
Figure 1. Standardized mean differences across age and gender before (in yellow) and after (in blue) propensity score matching.
2.2. Acoustic-prosodic Feature Extraction
Speech features were extracted using the eGeMAPsv02 feature set from Opensmile 3.0 [34] at the level of functionals. The eGeMAPsv02 feature set includes 88 acoustic-prosodic features, encompassing frequency, amplitude, spectral and cepstral, and temporal parameters of the speech. Frequency measures the span of vibrations throughout the transmission of speech, such as pitch, jitter (frequency variation), and formant envelopes. Amplitude indicates sound wave strength or loudness, and is gauged through features like shimmer (amplitude variation), loudness, and harmonic to noise ratio (HNR). Spectral and cepstral features are derived from the speech spectrum and its Fourier transformation (icepstrum), such as spectral flux (related to timber), spectral slop (linked to glottalized sounds), and mel-frequency cepstral coefficients (MFCC, representative of the vocal tract shape). Temporal features describe the duration or length of speech, offering information about the temporal aspects of the spoken content. This feature set, which combines spectral, cepstral, and temporal features together, helps maintain a comprehensive analysis of speech. Selection of this feature set was decided based on comparisons with the CompareE feature set and wav2vec2 embedding, with details available in the appendix.
2.3. Extra Trees Classifier with feature selection
The Extra Trees (Extremely Randomized Trees) algorithm was used as the classifier. Extra Trees is an ensemble learning model that leverages a "forest" of individual decision trees. Each decision tree operates as a predictive model, learning simple decision rules in a tree-like hierarchical structure from the input data. The "extra" in Extra Trees signifies the introduction of randomness in selecting split points for features, which mitigates the risk of overfitting and thus enhances the model’s robustness. The Extra Trees classifier comprised 10 decision trees, each with a maximum depth of three and random state of forty-two. Entropy-based Shannon information gain was used to measure the quality of a split. The precision, recall, F1, and accuracy scores, were used as evaluation metrics, with pAD as the positive label. This assessment was conducted using stratified 10-fold cross-validation to ensure a comprehensive evaluation of the classifier's effectiveness. To mitigate the risk of incorporating noisy and non-useful data in the classification process, a subset of features using the ANOVA F value (the SelectKBest algorithm) was selected from the eGeMAPSv02 feature set. The selection process involved recursively running the classification, starting from a single most important feature, and gradually incorporating additional features, up to all 88 features in the set, with the optimal F1 score as the criterion. Such a model developed on the English data would then be tested on Greek and Spanish data to evaluate its crosslingual performance with the identical performance metrics. F1 score was used as the main matrix due to imbalance number of subjects between groups. The selection of Extra Trees classifier was decided based on comparisons with other algorithms, with details available in the appendix.
2.4. Model fitting and agreement
A learning curve was used to observe the risk of overfitting. The learning curve visualizes how the performance of the model evolves as the amount of data increases, by contrasting the F1 score of the model on the training set to that on the cross-validation set. If the two curves converge or become closer to each other with the number of samples increase, it indicates that the model is less likely to suffer from overfitting. Overfitting occurs when a model tailors itself to a specific dataset, limiting its applicability to other datasets due to selection bias. While it is impossible to completely avoid selection bias, learning curve offers the opportunity to observe the risk of overfitting and assess the model's ability to generalize. To further examine the model's generalizability, the agreement of classification results among the ten decision trees were examined. Significant disparities in output predictions among these decision trees may indicate potential issues such as overfitting or instability in the model. Cohen's kappa together with prediction variance was introduced as a metrics for the agreement among ten decision trees.
2.5. Model interpretation
SHapley Additive exPlanations (SHAP values) were leveraged to explore the impact of each feature in the automated analysis. SHAP values assign each feature an importance score based on the difference between a model that lacks that specific feature and one that incorporates that feature. After identifying the top 10 most impactful features for the Extra Trees model, a generalized linear model (GLMs) with Gaussian distribution and identity link function was applied to investigate the difference between controls and AD on these features in the English dataset, with the demographic effects (age, sex, and education) regressed out. This offered an insight into the most crucial features for detecting AD and how they undergo changes in the pathology. Crosslingual performance was interpreted with the difference in magnitude of acoustic changes in AD pathology across different languages. Identical GLMs were used for all features selected for classification in the three datasets. For each feature, three absolute Z values were computed, serving as indicators of the absolute differences between control subjects and those with Alzheimer's Disease (AD) in the respective datasets. These Z values quantified the magnitude of acoustic changes associated with AD for each feature. To assess the differences in acoustic changes related to AD across languages, a repeated-measure ANOVA test was conducted utilizing features as subjects, Z scores as the dependent variable, and language as the within-factor, and with a post hoc paired sample T tests. Statistical significance is recognized when the p value (or corrected p value) is less than 0.05. Finally, error analysis was conducted by looking at cognitive test scores to see why the model made mistakes on specific cases and to suggest potential improvements for future work. For this aim, ANOVA tests were conducted to investigate the effect of group (control or probable AD), prediction correctness (True or False), and the interaction between the two factors.
3. Results
3.1. Model performance
Figure 2 summarizes the model’s performance on the English dataset and on the crosslingual tasks.
Utilizing 69 features out of the total 88 features from the eGeMAPS v02 feature set, the model achieved its optimal F1 score on the English dataset (Figure 2A). Specifically, the Extra Trees model, leveraging these 69 features as input, demonstrated an accuracy of 0.638, precision of 0.608, recall of 0.836, and an F1 score of 0.702 via cross-validation on the English dataset. After training on all the English data, the model demonstrated an accuracy of 0.667, precision of 0.605, recall of 0.885, and an F1 score of 0.719 on the Greek data, but an accuracy of 0.513, precision of 0.786, recall of 0.297, and an F1 score of 0.431. The F1 score on the Greek data was higher than the baseline model [27] and the demographic model (0.686) but not for the Spanish data.
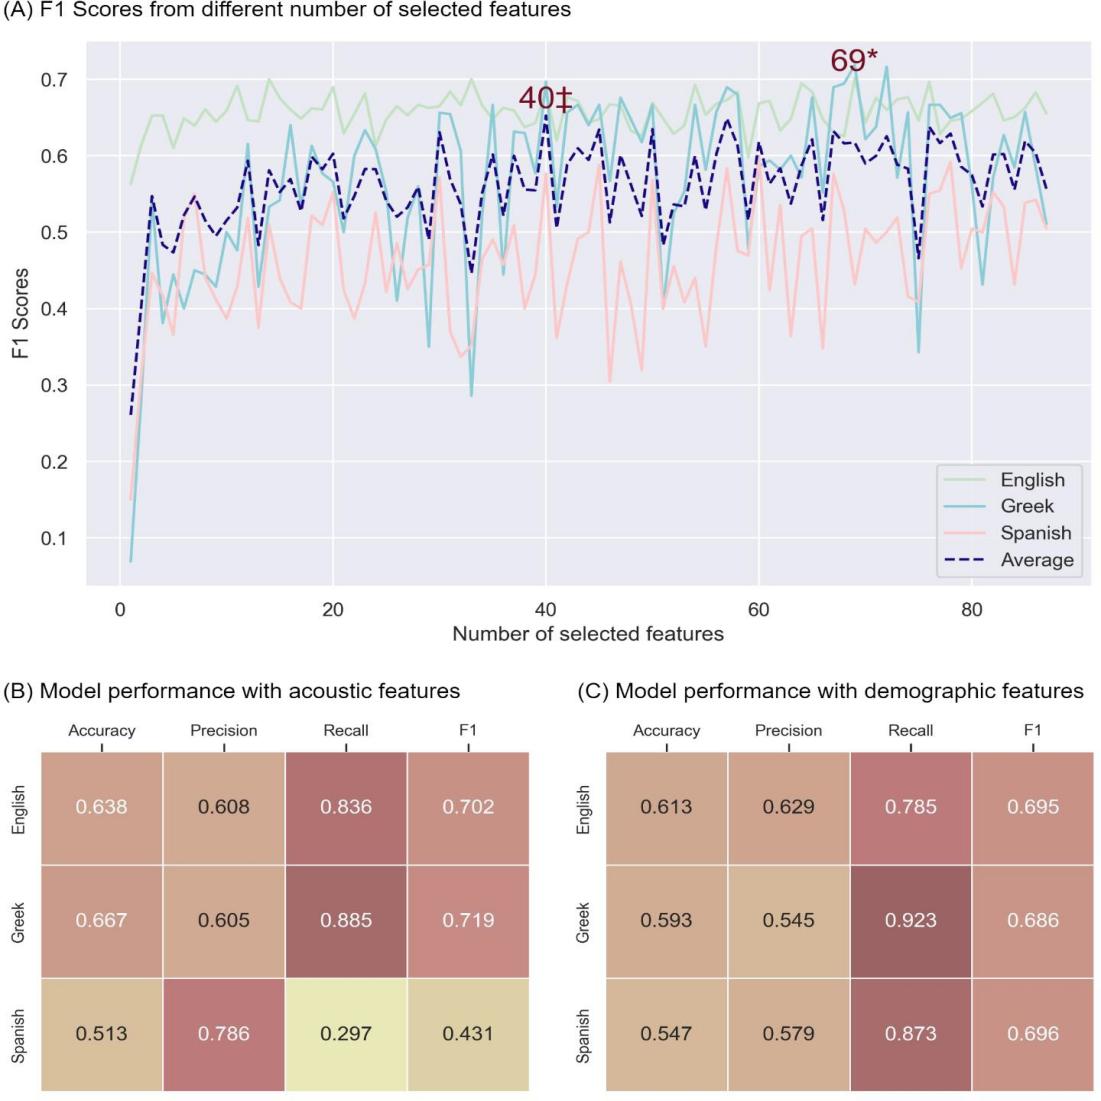
Figure 2. Model performance. (A) F1 scores from Extra Tree model using different numbers of selected features on the English (green), Greek (blue), and Spanish (pink) datasets, with an average F1 score across all three languages (dashed purple). Y-axis contains F1 scores, x-axis contains the number of selected features. * represents the number of features when the model got best F1 scores on the English data. ‡ represents the number of features when the model got best F1 scores on average. (B) Performance of the Extra Tree model using acoustic speech features on the English, Greek and Spanish datasets. (C) Performance of the Extra Tree model using demographic features (age, sex, and education) on the English, Greek and Spanish datasets.
3.2. Model generalizability
The learning curve, as shown in Figure 3A showed a trend toward convergence between the training and cross-validation scores indicating a low risk of overfitting. The variances of predictions among the constituent decision trees remained low in both the Greek dataset (Figure 3B) and the Spanish datasets (Figure 3C). The agreement scores of 0.703 for the Greek dataset and 0.736 for the Spanish dataset, together with the low prediction variances, suggest a consistent and reliable model performance across different decision trees, further reinforcing the model's stability and generalizability.
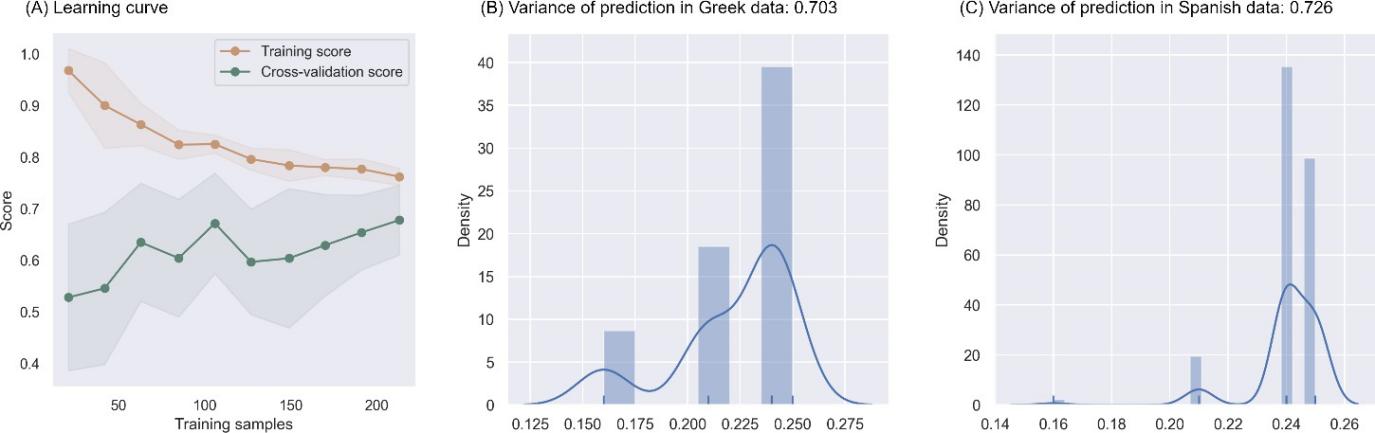
Figure 3. Generalizability of the model. (A) Learning curve displaying the model's training scores (orange) and cross-validation scores (green) as the number of training samples increase (x axis). (B) Prediction variance among comprising decision trees across subjects in the Greek dataset, with the Cohen’s kappa in the subtitle. (C) Prediction variance among comprising decision trees across subjects in the Greek dataset, with the Cohen’s kappa in the subtitle.
3.3. Model interpretation
The top ten features with the largest SHAP values, shown in Figure 4A, from the largest to the tenth largest, were: (1) loudness_sma3_stddevFallingSlope: standard deviation of the slope or rising signal parts of loudness, related to sound intensity; (2) loudness_sma3_percentile80.0: 80th percentile of estimate of perceived signal intensity, related to sound intensity; (3) F1amplitudeLogRelF0_sma3nz_stddevNorm: mean of the ratio of the energy of the spectral harmonic peak at the first formant´s center frequency to the energy of the spectral peak at F0 in voiced regions, related to nasal or honky sounds; (4) F3amplitudeLogRelF0_sma3nz_stddevNorm: mean of the ratio of the energy of the spectral harmonic peak at the third formant´s center frequency to the energy of the spectral peak at F0 in voiced region, related to nasal or honky sounds; (5) loudnessPeaksPerSec: the number of loudness peaks per second, related to sound intensity; (6) loudness_sma3_amean: mean of estimate of perceived signal intensity, related to sound intensity; (7) logRelF0-H1-H2_sma3nz_stddevNorm: Coefficient of variation of the ratio of energy of the first F0 harmonic (H1) to the energy of the second F0 harmonic (H2) in voiced regions, related to creaky sound production; (8) F0semitoneFrom27.5Hz_sma3nz_pctlrange0-2: range of 20-th to 80-th of logarithmic F0 on a semitone frequency scale, starting at 27.5 Hz, related to turbulence noise during phonation; (9) loudness_sma3_percentile50.0: 50th percentile of estimate of perceived signal intensity, related to sound intensity; (10) spectralFluxV_sma3nz_amean: mean of the difference of the spectra of two consecutive frames in voiced regions, related to timbre in speech.
GLM models, as shown in Figure 4B, indicated that the probable AD population speak quieter, with significantly lower mean (Z = -2.301, p = 0.021 < 0.05) and 80-th percentile (Z = -1.986, p = 0.047 < 0.05) of loudness, and produced more nasal sounds, as reflected by a significantly higher F1 amplitude (Z = 2.151, p = 0.031 < 0.05) and a trend towards higher F3 amplitude (Z = 1.752, p = 0.080 < 0.1). Furthermore, as seen in Figure 4C, the GLM models suggested that changes in AD pathology were significantly different among the Spanish datasets and the other two datasets. However, there was no significant difference between the English and Greek datasets. This observation helps explain why the model, trained on English data, exhibited better generalization to the Greek data but struggled to generalize well to the Spanish data.
Error analysis, in both Greek (Figure 4D) and Spanish (Figure 4E) datasets, indicated that the model tended to classify controls with lower MMSE scores as probable AD and probable AD with higher MMSE scores as control.
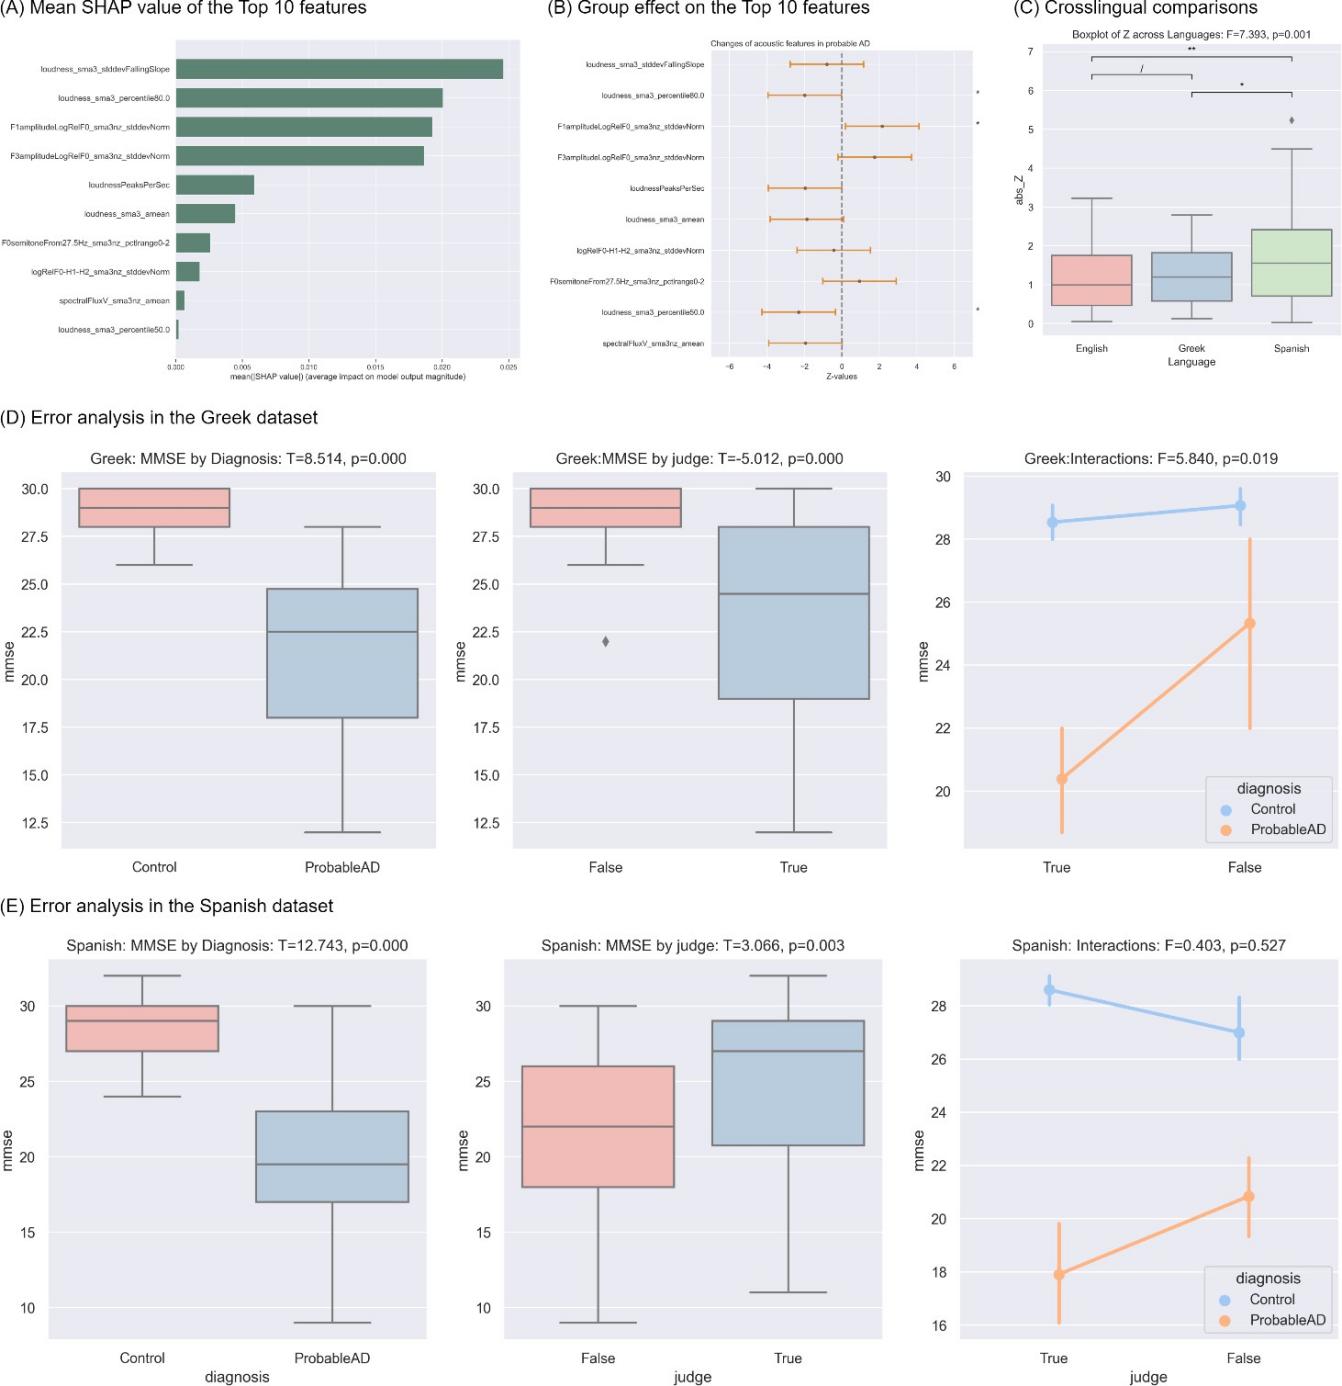
Figure 4. Model interpretation. * p < 0.05, ** p < 0.01, *** p < 0.001. (A) Ten features (y-axis) with the ten largest SHAP values. (B) Error bars showing Group effects (Z values, x-axis) on these top 10 ten features (y-axis), with the asterisks on the right indicating statistical significance. The center point indicates Z values and the orange bars display the confidence interval of 95%. (C) Boxplot comparing the differences between two groups across English (pink), Greek (blue), and Spanish (Green). Asterisks above the overarching lines indicate significance of the post-hoc paired sample T tests, corrected by False Discovery Rate (FDR). (D) Error analysis on Greek data with ANOVA test showing the effect of diagnosis, prediction correctness (True or False), and the interaction between these two factors. (E) Error analysis on Spanish data with ANOVA test showing the effect of diagnosis, prediction correctness (True or False), and the interaction between these two factors.
4. Discussion
In this study, the primary objectives were to build a speech-based model for AD detection that could be applied across different languages, was generalizable to future data, and interpretable. To accomplish this, the eGeMAPS v02 feature set was used and 69 features were selected from it as acoustic representations of the data to forward to an Extra Trees classifier.
Results demonstrated that VoiceAD outperformed both the baseline model [27] and the model incorporating demographic data in the crosslingual task from English to Greek. This not only affirmed the utility of VoiceAD but also underscored the indispensable role of including speech data for effective AD detection. The findings suggest the feasibility of transferring an English- data-trained AD detection model to data in other languages, presenting a promising solution for underexploited languages with limited data availability. While the model demonstrated commendable F1 scores on English and Greek data, the lower scores observed on the Spanish dataset indicate the need for further investigation. Language difference alone may not be the predominant explanation, given the consistent performance on Greek data. Instead, task effect could be a potential factor – the Spanish dataset utilized a reading task (prepared speech based on speech comprehension), engaging distinct neurocognitive mechanisms compared to spontaneous speech production [29-30]. In contrast, both the English and Greek datasets employed picture description tasks to elicit language, albeit not with identical stimuli pictures. Future efforts should prioritize task uniformity to ensure the robustness and reliability of crosslingual models for AD detection.
The combination of a low risk of overfitting, as observed from the learning curve, and high agreement among the constituent decision trees, as indicated by prediction variances and Cohen’s kappa, collectively suggests that VoiceAD is likely to maintain its performance when classifying future unseen data. This robustness is a crucial characteristic for the practical deployment of the model in real-world scenarios, where its effectiveness in handling new and unseen cases is essential for reliable and accurate predictions. In addition to its generalizability, the VoiceAD also exhibits high interpretability, which is another crucial aspect for clinical application. SHAP values revealed that the model primarily learned from features related to loudness, nasal sounds, creaky sounds, breathy sounds, and timber, which demonstrated significant alterations in the probable AD population in the employed datasets. Specifically, individuals with Alzheimer's Disease (AD) tended to speak more quietly and produce more nasal sound. This aligns with the neurobiological changes observed in AD pathology, such as disassociation between the auditory cortex and other cortical regions, especially meaning-making regions like the angular gyrus [25]. The changes in these acoustic aspects of speech could be task-dependent rather than language-dependent, as argued above. Error analyses further indicated the cognitive basis of the model. Individuals with similar Mini-Mental State Examination (MMSE) scores across different groups, for example, controls with low MMSE scores, were more prone to misclassifications by the model. This observation implies that the model is effectively capturing cognitive aspects.
High generalizability, interpretability, and cognitive basis together reinforced VoiceAD as a tool for detecting AD. Speech has been validated as a reliable indicator and potential mechanism for a diverse range of mental disorders including Parkinson’s disease [20], Huntington’s disease [31], schizophrenia-spectrum disorders [32], and depression symptoms [33]. The potential application of acoustic analysis in detecting a range of mental disorders emphasizes the versatility and broader impact of automated speech analysis in healthcare. Such a model could potentially be implemented into software or a mobile application that accepts speech recordings obtained from specific tasks, such as picture description, as input. It would then provide an output indicating the risk of AD, computed from the probability of the subject being classified as probable AD. This innovative approach could offer caregivers and physicians an accessible tool for identifying potential cases of cognitive impairment and facilitate monitoring of cognitive decline in certain individuals.
5. Limitations and future directions
Despite the promising future implications, it is essential to acknowledge several limitations inherent in the study and model. Firstly, the datasets utilized in this study exclusively comprised probable AD cases. The definitive confirmation of AD typically requires autopsy or biomarker testing with cerebrospinal fluid markers such as Abeta 42 and P-tau proteins. Currently, there is no publicly available dataset with speech samples from confirmed AD cases. Future endeavors may explore access to private datasets to enhance the precision of AD detection. Secondly, the total number of participants in the English dataset amounts to 237. While this figure may not be considered small within the context of clinical speech corpora, it is still beneficial to explore ways of expanding the dataset size. Additionally, the model itself has room for improvement. Continuous refinement and enhancement of the model architecture and features could contribute to its overall accuracy. Future studies might explore advanced techniques and incorporate larger and more diverse datasets to further enhance the model's performance.
6. Conclusions
This study followed the construction of a crosslingually generalizable and interpretable classifier capable of detecting Alzheimer's Disease (AD) from spontaneous speech. The classifier, initially trained on English data, demonstrated sustained performance when evaluated on Greek data. However, variations were observed when applied to Spanish data, which can be attributed to a task difference in data elicitation. VoiceAD, distinguished by its crosslingual applications, generalizability, and interpretability, has the potential to be implemented as an accessible screening tool to enable worldwide accessibility, especially for non-English speakers and those in low to middle-income populations.
Appendix
I tested the performance of twelve models using four feature sets. The twelve models are: linear support vector machine (L_SVM), support vector machine with radial basis function (R_SVM), decision tree (DT), random forest (RF), extra trees (ET), gradient boosting decision tree (GBDT), AdaBoost (Ada), K-nearest neighbors (KNN), naïve bayes (NB), linear regression (LR), linear discriminative analysis, and quadratic discriminative analysis. Supplementary Figure 1 displayed the comparisons on the performance across different classification algorithms. Feature sets include the compareE feature set with the spectral, cepstral, frequency, and voice quality subsets, the prosogram features revealing the prosodic profile of speech, the eGeMAPS v02 feature set, and the wav2vec2 embedding (w2v2). Supplementary Figure 2displayed the comparisons on the performance across different classification algorithms.
References
[1]. Sherman, J. C., Henderson, C. R., Flynn, S., Gair, J. W., & Lust, B. (2021). Language Decline Characterizes Amnestic Mild Cognitive Impairment Independent of Cognitive Decline. Journal of Speech, Language, and Hearing Research: JSLHR, 64(11), 4287–4307. https://doi.org/10.1044/2021_JSLHR-20-00503
[2]. Jongsiriyanyong, S., & Limpawattana, P. (2018). Mild Cognitive Impairment in Clinical Practice: A Review Article. American Journal of Alzheimer’s Disease and Other Dementias, 33(8), 500–507. https://doi.org/10.1177/1533317518791401
[3]. Verfaillie, S. C. J., Witteman, J., Slot, R. E. R., Pruis, I. J., Vermaat, L. E. W., Prins, N. D., Schiller, N. O., van de Wiel, M., Scheltens, P., van Berckel, B. N. M., van der Flier, W. M., & Sikkes,
[4]. Hagoort, P. (2019). The neurobiology of language beyond single-word processing. Science, 366(6461), 55–58. https://doi.org/10.1126/science.aax0289
[5]. Roger, E., Banjac, S., Thiebaut de Schotten, M., & Baciu, M. (2022). Missing links: The functional unification of language and memory (L∪M). Neuroscience & Biobehavioral Reviews, 133, 104489. https://doi.org/10.1016/j.neubiorev.2021.12.012
[6]. Uretsky, M., Gibbons, L. E., Mukherjee, S., Trittschuh, E. H., Fardo, D. W., Boyle, P. A., Keene, C. D., Saykin, A. J., Crane, P. K., Schneider, J. A., & Mez, J. (2021). Longitudinal cognitive performance of Alzheimer’s disease neuropathological subtypes. Alzheimer’s & Dementia (New York, N. Y.), 7(1), e12201. https://doi.org/10.1002/trc2.12201
[7]. He, R., Chapin, K., Al-Tamimi, J., Bel, N., Marquié, M., Rosende-Roca, M., Pytel, V., Tartari, J. P., Alegret, M., Sanabria, A., Ruiz, A., Boada, M., Valero, S., & Hinzen, W. (2023). Automated Classification of Cognitive Decline and Probable Alzheimer’s Dementia Across Multiple Speech and Language Domains. American Journal of Speech-Language Pathology, 1–12. https://doi.org/10.1044/2023_AJSLP-22-00403
[8]. Themistocleous, C., Eckerström, M., & Kokkinakis, D. (2020). Voice quality and speech fluency distinguish individuals with Mild Cognitive Impairment from Healthy Controls. PLoS ONE, 15(7), e0236009. https://doi.org/10.1371/journal.pone.0236009
[9]. Meilán, J. J. G., Martínez-Sánchez, F., Carro, J., Sánchez, J. A., & Pérez, E. (2012). Acoustic Markers Associated with Impairment in Language Processing in Alzheimer’s Disease. The Spanish Journal of Psychology, 15(2), 487–494. https://doi.org/10.5209/rev_SJOP.2012.v15.n2.38859 NIA AG03705 and AG05133
[10]. Meilán, J. J. G., Martínez-Sánchez, F., Carro, J., López, D. E., Millian-Morell, L., & Arana, J. M. (2014). Speech in Alzheimer’s Disease: Can Temporal and Acoustic Parameters Discriminate Dementia? Dementia and Geriatric Cognitive Disorders, 37(5–6), 327–334. https://doi.org/10.1159/000356726
[11]. Chen, L., Dodge, H. H., & Asgari, M. (2022). Measures of Voice Quality as Indicators of Mild Cognitive Impairment. Alzheimer’s & Dementia, 18(S7), e067393. https://doi.org/10.1002/alz.067393
[12]. Xiu, N., Vaxelaire, B., Li, L., Ling, Z., Xu, X., Huang, L., Sun, B., Huang, L., & Sock, R. (2022). A Study on Voice Measures in Patients With Alzheimer’s Disease. Journal of Voice, 0(0). https://doi.org/10.1016/j.jvoice.2022.08.010
[13]. Pistono, A., Jucla, M., Barbeau, E. J., Saint-Aubert, L., Lemesle, B., Calvet, B., Köpke, B., Puel, M., & Pariente, J. (2016). Pauses During Autobiographical Discourse Reflect Episodic Memory Processes in Early Alzheimer’s Disease. Journal of Alzheimer’s Disease, 50(3), 687. https://doi.org/10.3233/JAD-150408
[14]. Ahmed, S., Haigh, A.-M. F., de Jager, C. A., & Garrard, P. (2013). Connected speech as a marker of disease progression in autopsy-proven Alzheimer’s disease. Brain: A Journal of Neurology, 136(Pt 12), 3727–3737. https://doi.org/10.1093/brain/awt269
[15]. De Looze, C., Dehsarvi, A., Crosby, L., Vourdanou, A., Coen, R. F., Lawlor, B. A., & Reilly, R. B. (2021). Cognitive and Structural Correlates of Conversational Speech Timing in Mild Cognitive Impairment and Mild-to-Moderate Alzheimer’s Disease: Relevance for Early Detection Approaches. Frontiers in Aging Neuroscience, 13. https://www.frontiersin.org/articles/10.3389/fnagi.2021.637404
[16]. Lofgren, M., & Hinzen, W. (2022). Breaking the flow of thought: Increase of empty pauses in the connected speech of people with mild and moderate Alzheimer’s disease. Journal of Communication Disorders, 97, 106214. https://doi.org/10.1016/j.jcomdis.2022.106214
[17]. Pastoriza-Domínguez, P., Torre, I. G., Diéguez-Vide, F., Gómez-Ruiz, I., Geladó, S., Bello-López, J., Ávila-Rivera, A., Matías-Guiu, J. A., Pytel, V., & Hernández-Fernández, A. (2022). Speech pause distribution as an early marker for Alzheimer’s disease. Speech Communication, 136, 107–117. https://doi.org/10.1016/j.specom.2021.11.009
[18]. Vincze, V., Szatlóczki, G., Tóth, L., Gosztolya, G., Pákáski, M., Hoffmann, I., & Kálmán, J. (2021). Telltale silence: Temporal speech parameters discriminate between prodromal dementia and mild Alzheimer’s disease. Clinical Linguistics & Phonetics, 35(8), 727–742. https://doi.org/10.1080/02699206.2020.1827043
[19]. Vigo, I., Coelho, L., & Reis, S. (2022). Speech- and Language-Based Classification of Alzheimer’s Disease: A Systematic Review. Bioengineering, 9(1), 27. https://doi.org/10.3390/bioengineering9010027
[20]. Scimeca, S., Amato, F., Olmo, G., Asci, F., Suppa, A., Costantini, G., & Saggio, G. (2023). Robust and language-independent acoustic features in Parkinson’s disease. Frontiers in Neurology, 14. https://www.frontiersin.org/journals/neurology/articles/10.3389/fneur. 2023.1198058 Shah, Z., Sawalha, J., Tasnim, M., Qi, S., Stroulia, E., & Greiner, R. (2021). Learning Language and Acoustic Models for Identifying Alzheimer’s Dementia From Speech. Frontiers in Computer Science, 3. https://www.frontiersin.org/articles/10.3389/fcomp.2021.624659
[21]. Hason, L., & Krishnan, S. (2022). Spontaneous speech feature analysis for alzheimer’s disease screening using a random forest classifier. Frontiers in Digital Health, 4, 901419. https://doi.org/10.3389/fdgth.2022.901419
[22]. Luz, S., Haider, F., Fuente, S. de la, Fromm, D., & MacWhinney, B. (2020). Alzheimer’s Dementia Recognition Through Spontaneous Speech: The ADReSS Challenge. Interspeech 2020, 2172–2176. https://doi.org/10.21437/Interspeech.2020-2571
[23]. Luz, S., Haider, F., de la Fuente, S., Fromm, D., & MacWhinney, B. (2021). Detecting cognitive decline using speech only: The ADReSSo Challenge (arXiv:2104.09356). arXiv. https://doi.org/10.48550/arXiv.2104.09356
[24]. Alzheimer’s Disease International ADI - Dementia statistics. (n.d.). Retrieved March 14, 2024, from https://www.alzint.org/about/dementia-facts-figures/dementia-statistics/
[25]. He, R., Al-Tamimi, J., Sánchez-Benavides, G., Montaña-Valverde, G., Domingo Gispert, J., Grau- Rivera, O., Suárez-Calvet, M., Minguillon, C., Fauria, K., Navarro, A., & Hinzen, W. (2024). Atypical cortical hierarchy in Aβ-positive older adults and its reflection in spontaneous speech. Brain Research, 1830, 148806. https://doi.org/10.1016/j.brainres.2024.148806
[26]. Becker, J. T., Boller, F., Lopez, O. L., Saxton, J., & McGonigle, K. L. (1994). The natural history of Alzheimer's disease: description of study cohort and accuracy of diagnosis. Archives of Neurology, 51(6), 585-594.
[27]. Luz, S., Haider, F., Fromm, D., Lazarou, I., Kompatsiaris, I., & MacWhinney, B. (2023). Multilingual Alzheimer’s Dementia Recognition through Spontaneous Speech: A Signal Processing Grand Challenge (arXiv:2301.05562). arXiv. https://doi.org/10.48550/arXiv.2301.05562
[28]. Ivanova, O., Meilán, J. J. G., Martínez-Sánchez, F., Martínez-Nicolás, I., Llorente, T. E., & González, N. C. (2022). Discriminating speech traits of Alzheimer’s disease assessed through a corpus of reading task for Spanish language. Computer Speech & Language, 73, 101341. https://doi.org/10.1016/j.csl.2021.101341
[29]. Giglio, L., Ostarek, M., Weber, K., & Hagoort, P. (2022). Commonalities and Asymmetries in the Neurobiological Infrastructure for Language Production and Comprehension. Cerebral Cortex, 32(7), 1405–1418. https://doi.org/10.1093/cercor/bhab287
[30]. Matchin, W., & Hickok, G. (2020). The Cortical Organization of Syntax. Cerebral Cortex (New York, NY), 30(3), 1481–1498. https://doi.org/10.1093/cercor/bhz180
[31]. Perez, M., Jin, W., Le, D., Carlozzi, N., Dayalu, P., Roberts, A., & Provost, E. M. (2018). Classification of Huntington Disease using Acoustic and Lexical Features. Interspeech, 2018, 1898–1902. https://doi.org/10.21437/interspeech.2018-2029
[32]. Boer, J. N. de, Voppel, A. E., Brederoo, S. G., Schnack, H. G., Truong, K. P., Wijnen, F. N. K., & Sommer, I. E. C. (2023). Acoustic speech markers for schizophrenia-spectrum disorders: A diagnostic and symptom-recognition tool. Psychological Medicine, 53(4), 1302–1312. https://doi.org/10.1017/S0033291721002804
[33]. König, A., Tröger, J., Mallick, E., Mina, M., Linz, N., Wagnon, C., Karbach, J., Kuhn, C., & Peter, J. (2022). Detecting subtle signs of depression with automated speech analysis in a non- clinical sample. BMC Psychiatry, 22(1), 830. https://doi.org/10.1186/s12888-022-04475-0
[34]. Eyben, F., Scherer, K. R., Schuller, B. W., Sundberg, J., André, E., Busso, C., ... & Truong, K. P. (2015). The Geneva minimalistic acoustic parameter set (GeMAPS) for voice research and affective computing. IEEE transactions on affective computing, 7(2), 190-202.
Cite this article
Wu,A. (2024). VoiceAD: A multilingual speech based classifier for early detection of Alzheimer’s disease. Applied and Computational Engineering,86,71-82.
Data availability
The datasets used and/or analyzed during the current study will be available from the authors upon reasonable request.
Disclaimer/Publisher's Note
The statements, opinions and data contained in all publications are solely those of the individual author(s) and contributor(s) and not of EWA Publishing and/or the editor(s). EWA Publishing and/or the editor(s) disclaim responsibility for any injury to people or property resulting from any ideas, methods, instructions or products referred to in the content.
About volume
Volume title: Proceedings of the 6th International Conference on Computing and Data Science
© 2024 by the author(s). Licensee EWA Publishing, Oxford, UK. This article is an open access article distributed under the terms and
conditions of the Creative Commons Attribution (CC BY) license. Authors who
publish this series agree to the following terms:
1. Authors retain copyright and grant the series right of first publication with the work simultaneously licensed under a Creative Commons
Attribution License that allows others to share the work with an acknowledgment of the work's authorship and initial publication in this
series.
2. Authors are able to enter into separate, additional contractual arrangements for the non-exclusive distribution of the series's published
version of the work (e.g., post it to an institutional repository or publish it in a book), with an acknowledgment of its initial
publication in this series.
3. Authors are permitted and encouraged to post their work online (e.g., in institutional repositories or on their website) prior to and
during the submission process, as it can lead to productive exchanges, as well as earlier and greater citation of published work (See
Open access policy for details).
References
[1]. Sherman, J. C., Henderson, C. R., Flynn, S., Gair, J. W., & Lust, B. (2021). Language Decline Characterizes Amnestic Mild Cognitive Impairment Independent of Cognitive Decline. Journal of Speech, Language, and Hearing Research: JSLHR, 64(11), 4287–4307. https://doi.org/10.1044/2021_JSLHR-20-00503
[2]. Jongsiriyanyong, S., & Limpawattana, P. (2018). Mild Cognitive Impairment in Clinical Practice: A Review Article. American Journal of Alzheimer’s Disease and Other Dementias, 33(8), 500–507. https://doi.org/10.1177/1533317518791401
[3]. Verfaillie, S. C. J., Witteman, J., Slot, R. E. R., Pruis, I. J., Vermaat, L. E. W., Prins, N. D., Schiller, N. O., van de Wiel, M., Scheltens, P., van Berckel, B. N. M., van der Flier, W. M., & Sikkes,
[4]. Hagoort, P. (2019). The neurobiology of language beyond single-word processing. Science, 366(6461), 55–58. https://doi.org/10.1126/science.aax0289
[5]. Roger, E., Banjac, S., Thiebaut de Schotten, M., & Baciu, M. (2022). Missing links: The functional unification of language and memory (L∪M). Neuroscience & Biobehavioral Reviews, 133, 104489. https://doi.org/10.1016/j.neubiorev.2021.12.012
[6]. Uretsky, M., Gibbons, L. E., Mukherjee, S., Trittschuh, E. H., Fardo, D. W., Boyle, P. A., Keene, C. D., Saykin, A. J., Crane, P. K., Schneider, J. A., & Mez, J. (2021). Longitudinal cognitive performance of Alzheimer’s disease neuropathological subtypes. Alzheimer’s & Dementia (New York, N. Y.), 7(1), e12201. https://doi.org/10.1002/trc2.12201
[7]. He, R., Chapin, K., Al-Tamimi, J., Bel, N., Marquié, M., Rosende-Roca, M., Pytel, V., Tartari, J. P., Alegret, M., Sanabria, A., Ruiz, A., Boada, M., Valero, S., & Hinzen, W. (2023). Automated Classification of Cognitive Decline and Probable Alzheimer’s Dementia Across Multiple Speech and Language Domains. American Journal of Speech-Language Pathology, 1–12. https://doi.org/10.1044/2023_AJSLP-22-00403
[8]. Themistocleous, C., Eckerström, M., & Kokkinakis, D. (2020). Voice quality and speech fluency distinguish individuals with Mild Cognitive Impairment from Healthy Controls. PLoS ONE, 15(7), e0236009. https://doi.org/10.1371/journal.pone.0236009
[9]. Meilán, J. J. G., Martínez-Sánchez, F., Carro, J., Sánchez, J. A., & Pérez, E. (2012). Acoustic Markers Associated with Impairment in Language Processing in Alzheimer’s Disease. The Spanish Journal of Psychology, 15(2), 487–494. https://doi.org/10.5209/rev_SJOP.2012.v15.n2.38859 NIA AG03705 and AG05133
[10]. Meilán, J. J. G., Martínez-Sánchez, F., Carro, J., López, D. E., Millian-Morell, L., & Arana, J. M. (2014). Speech in Alzheimer’s Disease: Can Temporal and Acoustic Parameters Discriminate Dementia? Dementia and Geriatric Cognitive Disorders, 37(5–6), 327–334. https://doi.org/10.1159/000356726
[11]. Chen, L., Dodge, H. H., & Asgari, M. (2022). Measures of Voice Quality as Indicators of Mild Cognitive Impairment. Alzheimer’s & Dementia, 18(S7), e067393. https://doi.org/10.1002/alz.067393
[12]. Xiu, N., Vaxelaire, B., Li, L., Ling, Z., Xu, X., Huang, L., Sun, B., Huang, L., & Sock, R. (2022). A Study on Voice Measures in Patients With Alzheimer’s Disease. Journal of Voice, 0(0). https://doi.org/10.1016/j.jvoice.2022.08.010
[13]. Pistono, A., Jucla, M., Barbeau, E. J., Saint-Aubert, L., Lemesle, B., Calvet, B., Köpke, B., Puel, M., & Pariente, J. (2016). Pauses During Autobiographical Discourse Reflect Episodic Memory Processes in Early Alzheimer’s Disease. Journal of Alzheimer’s Disease, 50(3), 687. https://doi.org/10.3233/JAD-150408
[14]. Ahmed, S., Haigh, A.-M. F., de Jager, C. A., & Garrard, P. (2013). Connected speech as a marker of disease progression in autopsy-proven Alzheimer’s disease. Brain: A Journal of Neurology, 136(Pt 12), 3727–3737. https://doi.org/10.1093/brain/awt269
[15]. De Looze, C., Dehsarvi, A., Crosby, L., Vourdanou, A., Coen, R. F., Lawlor, B. A., & Reilly, R. B. (2021). Cognitive and Structural Correlates of Conversational Speech Timing in Mild Cognitive Impairment and Mild-to-Moderate Alzheimer’s Disease: Relevance for Early Detection Approaches. Frontiers in Aging Neuroscience, 13. https://www.frontiersin.org/articles/10.3389/fnagi.2021.637404
[16]. Lofgren, M., & Hinzen, W. (2022). Breaking the flow of thought: Increase of empty pauses in the connected speech of people with mild and moderate Alzheimer’s disease. Journal of Communication Disorders, 97, 106214. https://doi.org/10.1016/j.jcomdis.2022.106214
[17]. Pastoriza-Domínguez, P., Torre, I. G., Diéguez-Vide, F., Gómez-Ruiz, I., Geladó, S., Bello-López, J., Ávila-Rivera, A., Matías-Guiu, J. A., Pytel, V., & Hernández-Fernández, A. (2022). Speech pause distribution as an early marker for Alzheimer’s disease. Speech Communication, 136, 107–117. https://doi.org/10.1016/j.specom.2021.11.009
[18]. Vincze, V., Szatlóczki, G., Tóth, L., Gosztolya, G., Pákáski, M., Hoffmann, I., & Kálmán, J. (2021). Telltale silence: Temporal speech parameters discriminate between prodromal dementia and mild Alzheimer’s disease. Clinical Linguistics & Phonetics, 35(8), 727–742. https://doi.org/10.1080/02699206.2020.1827043
[19]. Vigo, I., Coelho, L., & Reis, S. (2022). Speech- and Language-Based Classification of Alzheimer’s Disease: A Systematic Review. Bioengineering, 9(1), 27. https://doi.org/10.3390/bioengineering9010027
[20]. Scimeca, S., Amato, F., Olmo, G., Asci, F., Suppa, A., Costantini, G., & Saggio, G. (2023). Robust and language-independent acoustic features in Parkinson’s disease. Frontiers in Neurology, 14. https://www.frontiersin.org/journals/neurology/articles/10.3389/fneur. 2023.1198058 Shah, Z., Sawalha, J., Tasnim, M., Qi, S., Stroulia, E., & Greiner, R. (2021). Learning Language and Acoustic Models for Identifying Alzheimer’s Dementia From Speech. Frontiers in Computer Science, 3. https://www.frontiersin.org/articles/10.3389/fcomp.2021.624659
[21]. Hason, L., & Krishnan, S. (2022). Spontaneous speech feature analysis for alzheimer’s disease screening using a random forest classifier. Frontiers in Digital Health, 4, 901419. https://doi.org/10.3389/fdgth.2022.901419
[22]. Luz, S., Haider, F., Fuente, S. de la, Fromm, D., & MacWhinney, B. (2020). Alzheimer’s Dementia Recognition Through Spontaneous Speech: The ADReSS Challenge. Interspeech 2020, 2172–2176. https://doi.org/10.21437/Interspeech.2020-2571
[23]. Luz, S., Haider, F., de la Fuente, S., Fromm, D., & MacWhinney, B. (2021). Detecting cognitive decline using speech only: The ADReSSo Challenge (arXiv:2104.09356). arXiv. https://doi.org/10.48550/arXiv.2104.09356
[24]. Alzheimer’s Disease International ADI - Dementia statistics. (n.d.). Retrieved March 14, 2024, from https://www.alzint.org/about/dementia-facts-figures/dementia-statistics/
[25]. He, R., Al-Tamimi, J., Sánchez-Benavides, G., Montaña-Valverde, G., Domingo Gispert, J., Grau- Rivera, O., Suárez-Calvet, M., Minguillon, C., Fauria, K., Navarro, A., & Hinzen, W. (2024). Atypical cortical hierarchy in Aβ-positive older adults and its reflection in spontaneous speech. Brain Research, 1830, 148806. https://doi.org/10.1016/j.brainres.2024.148806
[26]. Becker, J. T., Boller, F., Lopez, O. L., Saxton, J., & McGonigle, K. L. (1994). The natural history of Alzheimer's disease: description of study cohort and accuracy of diagnosis. Archives of Neurology, 51(6), 585-594.
[27]. Luz, S., Haider, F., Fromm, D., Lazarou, I., Kompatsiaris, I., & MacWhinney, B. (2023). Multilingual Alzheimer’s Dementia Recognition through Spontaneous Speech: A Signal Processing Grand Challenge (arXiv:2301.05562). arXiv. https://doi.org/10.48550/arXiv.2301.05562
[28]. Ivanova, O., Meilán, J. J. G., Martínez-Sánchez, F., Martínez-Nicolás, I., Llorente, T. E., & González, N. C. (2022). Discriminating speech traits of Alzheimer’s disease assessed through a corpus of reading task for Spanish language. Computer Speech & Language, 73, 101341. https://doi.org/10.1016/j.csl.2021.101341
[29]. Giglio, L., Ostarek, M., Weber, K., & Hagoort, P. (2022). Commonalities and Asymmetries in the Neurobiological Infrastructure for Language Production and Comprehension. Cerebral Cortex, 32(7), 1405–1418. https://doi.org/10.1093/cercor/bhab287
[30]. Matchin, W., & Hickok, G. (2020). The Cortical Organization of Syntax. Cerebral Cortex (New York, NY), 30(3), 1481–1498. https://doi.org/10.1093/cercor/bhz180
[31]. Perez, M., Jin, W., Le, D., Carlozzi, N., Dayalu, P., Roberts, A., & Provost, E. M. (2018). Classification of Huntington Disease using Acoustic and Lexical Features. Interspeech, 2018, 1898–1902. https://doi.org/10.21437/interspeech.2018-2029
[32]. Boer, J. N. de, Voppel, A. E., Brederoo, S. G., Schnack, H. G., Truong, K. P., Wijnen, F. N. K., & Sommer, I. E. C. (2023). Acoustic speech markers for schizophrenia-spectrum disorders: A diagnostic and symptom-recognition tool. Psychological Medicine, 53(4), 1302–1312. https://doi.org/10.1017/S0033291721002804
[33]. König, A., Tröger, J., Mallick, E., Mina, M., Linz, N., Wagnon, C., Karbach, J., Kuhn, C., & Peter, J. (2022). Detecting subtle signs of depression with automated speech analysis in a non- clinical sample. BMC Psychiatry, 22(1), 830. https://doi.org/10.1186/s12888-022-04475-0
[34]. Eyben, F., Scherer, K. R., Schuller, B. W., Sundberg, J., André, E., Busso, C., ... & Truong, K. P. (2015). The Geneva minimalistic acoustic parameter set (GeMAPS) for voice research and affective computing. IEEE transactions on affective computing, 7(2), 190-202.