


1. Introduction
Due to the rapid development of the global economy, loans have become essential for both individuals and enterprises to obtain funds. However, loan defaults have become one of the major challenges facing the financial industry. Loan defaults not only directly affect the profitability of financial institutions, but may also trigger systemic risks and hurt the entire economic system. The financial sector has become a crucial challenge in addressing loan default risks efficiently [1,2].
The prediction of loan defaults is critical for financial institutions. Traditional default risk assessment methods usually rely on historical data and rules of thumb, which are inadequate when faced with complex data patterns and non-linear relationships. Financial institutions often need to face a large amount of customer data during loan approval and post-loan management [3,4]. This data contains rich information, but traditional methods are difficult to fully mine and utilize this information [5]. By leveraging advanced machine learning technologies, particularly algorithms with robust feature learning capabilities, the accuracy of default prediction can be markedly enhanced, leading to a reduction in bad debt risk.
Significant progress has been made in recent years in the application of machine learning techniques for default prediction. Machine learning models have the ability to handle complex data structures and uncover potential non-linear relationships, unlike traditional statistical models. For instance, the support vector machine (SVM) is frequently employed in default prediction studies, with evidence indicating that the SVM model can significantly enhance prediction accuracy and robustness. In addition, due to its advantages of ensemble learning, the random forest algorithm performs well in processing high-dimensional data and feature selection, and studies have proven its effectiveness in loan default prediction [6,7]. Another related research uses the Gradient Boosting Trees algorithm, combined with big data and feature engineering, to propose an improved default prediction model. This model achieves high prediction accuracy and stability through refined feature selection and data preprocessing. These studies show that machine learning technology can not only improve the prediction performance of the model but also has good adaptability and scalability.
This study combines the TabNet model and the Logistic Regression model to build an efficient personal loan default prediction system. As an emerging deep learning model, TabNet has excellent feature learning capabilities and can automatically identify and extract key features in the data. Logistic Regression's interpretability enhances the transparency and understanding of the model's prediction results. We aim to enhance the accuracy of default prediction by combining these two models and give financial institutions more effective credit risk management tools.
2. Dataset
The dataset used in this study comes from the personal loan and online credit default prediction competition on the DataFountain platform and is derived from the desensitization simulation of personal loan data and online credit data. Two sets of data are created, one for training and another for testing. The dataset contains three parts: personal loan default records (10,000 records), online credit loan default records (750,000 records), and a test set (5,000 records). These data cover the borrower's personal information, financial status, loan details, and repayment behaviour.
2.1. Training Data Description
Table 1 and Table 2 are some key fields of personal loan and online loan data.
Table 1. Description of some data fields of personal loans
Field Name | Field Description |
loan_id | Unique ID of loan record |
user_id | Borrower unique identifier |
total_loan | Loan Amount |
interest | Loan interest rate |
monthly_payment | Installment amount |
employment_type | Company Type |
industry | Work Areas |
debt_loan_ratio | Debt-to-income ratio |
early_return | Number of early repayments |
Table 2. Description of some data fields of online loans
Field Name | Field Description |
loan_id | Unique ID of online loan record |
user_id | User unique identifier |
total_loan | Online loan amount |
interest | Online loan interest rates |
employment_type | Company Type |
debt_loan_ratio | Debt-to-income ratio |
early_return | Number of early repayments |
2.2. Preprocessing and feature engineering of data
The purpose of this research was to ensure data quality and model effectiveness by conducting thorough data preprocessing and feature engineering before training.
2.3. Data cleaning and missing value processing
In the data cleaning stage, we first processed the missing values to ensure the integrity of the data set [8,9]. For numerical features such as revolving credit balance, number of public record expungements, and debt-to-income ratio, we chose to use the median for filling, because the median is not sensitive to outliers and can better maintain the original distribution of the data. For categorical features such as zip code, we used the mode for filling, which can maintain the main trend of the feature category.
2.4. Feature Transformation
All data features were converted to a unified format, and illogical future dates were corrected to ensure the accuracy of the time data. Additionally, for categorical data, we implemented label encoding to transform text attributes such as employer type and industry into numerical formats suitable for processing by machine learning models [10].
2.5. Feature Engineering
During feature engineering, the study applied innovative techniques to enrich the dataset's information content. In particular, we used K-means clustering to generate new features based on zip code and industry data, such as calculating the average loan interest rate for each category. These new features help reveal deeper data patterns and trends.
2.6. Data Normalization
To mitigate the effects of differing feature scales and enhance the model's generalization, we standardized all numerical features. We normalized the feature values using standard deviation, ensuring they followed a distribution with a mean of zero and a standard deviation of one.
3. Modelling
3.1. TabNet
In the training of the TabNet model, the following metrics and formulas were used to assess performance and refine the training process:
A key metric for evaluating binary classification models is the Area Under the Curve (AUC). It assesses the model's effectiveness by calculating the area beneath the receiver operating characteristic (ROC) curve. The calculation formula for AUC is:
\( AUC=\int _{-∞}^{+∞}ROC(x)dx \) (1)
3.2. Extraction of Features
During the feature extraction phase, we derived the predicted probabilities for each sample using the TabNet model. The predicted probabilities are utilized to create new features, which are then employed to train the Logistic Regression model. The formula for calculating the predicted probability is:
\( {\hat{p}_{i}}=P({class_{i}}|features) \) (2)
Among them, \( {\hat{p}_{i}} \) represents the predicted probability that the sample belongs to the i-th class.
3.3. Standardization
To ensure that the features are trained at the same scale, we normalize the features. The normalization formula is as follows:
\( {X_{scaled}}=\frac{x-μ}{σ} \) (3)
In this context, xxx represents the original eigenvalue, μ denotes the feature's mean, and σ indicates the feature's standard deviation. Standardizing the features ensures that the mean of the standardized feature is 0 and the standard deviation is 1, thereby processing all features on a uniform scale.
3.4. Logistic Regression Model
To optimize its parameters, the Logistic Regression model employs the cross-entropy loss function, commonly referred to as logarithmic loss. The formula used to compute the cross-entropy loss function is:
\( L(y,\hat{y})=-[ylog(\hat{y})+(1-y)log(1-\hat{y})] \) (4)
Among them, y is the actual label and \( \hat{y} \) is the predicted probability. The final loss is averaged over all samples and used for model training and optimization.
3.5. Model training parameters
During model training, we set specific parameters to optimize model performance and ensure efficient training. We set a learning rate of 0.02, which helps control the updated amplitude of parameters during optimization, ensuring that the model converges quickly while avoiding excessive oscillations during learning. The batch size is set to 1024, while the virtual batch size is 128. This setting determines the number of data samples used each time the model parameters are updated, thereby balancing the efficiency of computing resources and the stability of model updates. We specified a maximum of 200 iterations to allow sufficient time for the model to learn the data patterns during training. This limit ensures that the model has adequate opportunities to optimize. In addition, the patience parameter of the early stopping mechanism is set to 20 iterations. If there is no improvement in the performance on the validation set after 20 consecutive iterations, the training will stop automatically. This mechanism helps prevent the model from overfitting during training [11,12].
4. Experimental methods and results
4.1. Experimental methods
The TabNet model first extracts features from the training data and generates probability outputs. The outputs are incorporated into the training set as additional features and then used to train the Logistic Regression model, with the goal of enhancing the model's overall performance. K-Fold CV is applied during training and evaluation to ensure the model's generalization capability.
4.2. TabNet
While deep neural networks perform exceptionally well with unstructured data, such as images, text, and speech, they are less frequently utilized for tasks involving structured data like tabular data. Relatively speaking, traditional machine learning methods are more widely used in such tasks because they are more effective in classification and interpretability, and require fewer training parameters.
Deep neural networks excel at automatically learning feature representations, reducing dependence on manual feature engineering, and supporting online learning for dynamic model updates. In 2019, Google introduced the TabNet model, which preserves the end-to-end training and feature representation benefits of deep neural networks, while also providing strong interpretability and efficient sparse feature selection [13].
TabNet's architecture uses a neural network framework that involves multiple steps to construct a neural network similar to an additive model, with the following characteristics.
4.2.1. Feature Selection
The attentive transformer layer utilizes the output from the previous layer to generate the mask matrix for the current layer, enabling automatic feature selection [14]. The structure of TabNet is illustrated in Figure 1.
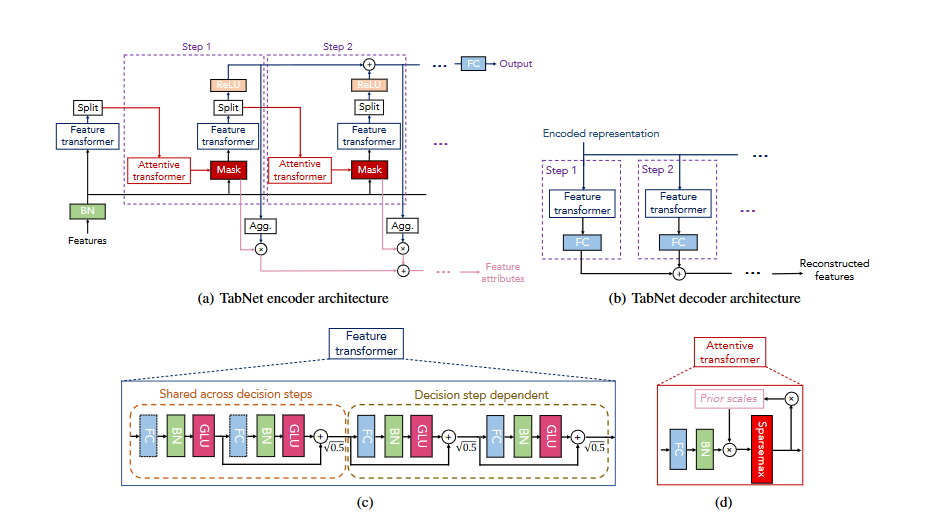
Figure 1. TabNet architecture
4.2.2. Feature calculation
The function of the feature transformer layer is to calculate and process the features selected in the current step. Another advantage of TabNet is its self-supervised learning capability. When processing structured data, feature representation can be achieved by artificially masking some features and then using an encoder-decoder model to predict these masked features, as shown in Figure 2.
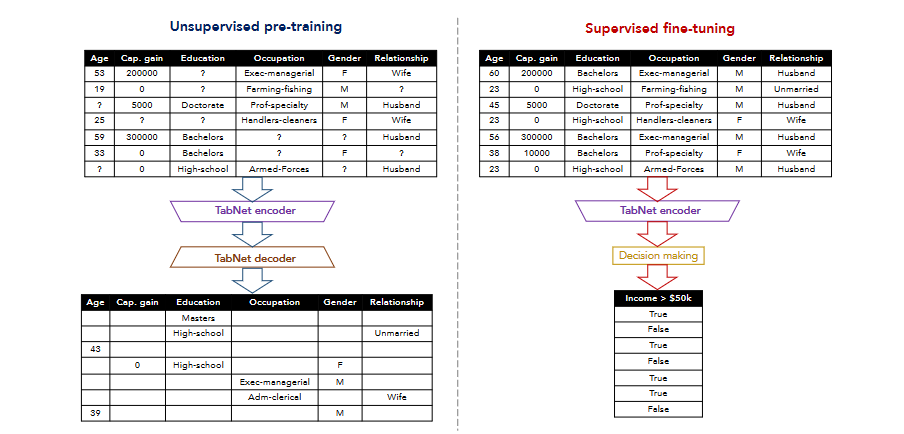
Figure 2. Flowchart
4.2.3. Five-fold CV
In Five-fold CV, the dataset is randomly divided into five equal sections, known as folds. In each round, four folds are used for training the model, while the fifth is set aside for validation. This process is repeated five times, with each fold being used as the validation set once. The model's final performance is then averaged across all five rounds of validation results.
The five-fold cross validation process can be expressed by the following formula:
\( {CV_{score}}=\frac{1}{K}\sum _{i=1}^{K}{score_{i}} \) (6)
This cross-validation method can effectively reduce the model's dependence on data partitioning and provide a more stable and reliable performance evaluation.
4.2.4. Model parameter settings
Table 3 below presents the parameter settings for the TabNet and Logistic Regression models:
Table 3. Model parameter settings
Model | Parameter Name | Parameter Value |
TabNet | n_d | 64 |
n_a | 64 | |
n_steps | 5 | |
gamma | 1.5 | |
lambda_sparse | 1.00E-03 | |
epsilon | 1.00E-15 | |
max_epochs | 200 | |
Logistic Regression | max_iter | 1000 |
In the model parameter settings of this article, we configured the decision block feature dimension (n_d) of the TabNet model to be 64, and the attention mechanism feature dimension (n_a) was also set to 64 to capture complex feature representations and attention allocation. The model contains 5 decision steps (n_steps), each of which makes decisions based on the current attention weight, and uses a scaling factor (gamma) of 1.5 to enhance the sparsity of the attention mechanism. We used the Adam optimizer for training, benefiting from its adaptive learning rate adjustment, with an initial learning rate set at 0.02 (2e-2). Training was planned for 200 epochs, with an early stopping mechanism included to mitigate overfitting. For the Logistic Regression model, the maximum number of iterations was set to 1000 to ensure adequate convergence attempts.
4.3. Experimental results
Each ensemble model's performance on the test set is summarized in Table 4, with different indicators such as accuracy, precision, recall, and F1 score being used to evaluate them. TabNet and Logistic Regression's combination is highly effective in multi-evaluation metrics, leading to their final selection for integration.
Table 4. Comparison of ensemble model performance
Model | Precision | Recall | F1-Score | Accuracy |
TabNet + LightGBM | 0.586 | 0.4294 | 0.4949 | 0.8528 |
TabNet + XGBoost | 0.5418 | 0.4234 | 0.4749 | 0.8425 |
TabNet + RandomForest | 0.5959 | 0.3761 | 0.4603 | 0.8519 |
TabNet + Logistic Regression | 0.6153 | 0.4149 | 0.4949 | 0.8578 |
As can be seen from the table, the integration of TabNet and Logistic Regression performs well in terms of accuracy and F1 score, especially the improvement of F1 score is the most significant. Compared with other model integration methods, the combination of TabNet and Logistic Regression can better balance the performance of the model, so it was selected as the final integrated model.
In this experiment, the TabNet model selects features through the sequential attention mechanism and generates probability outputs, which are input into the Logistic Regression model as additional features. The coefficients of the Logistic Regression model can directly explain the importance of each feature to the final classification result.
In the Logistic Regression model, feature importance is defined as the absolute value of the coefficient, with the importance of the j-th feature represented as \( {Importance_{j}} \) , where j indicates the feature index. The linear expression of the Logistic Regression model is as follows:
\( \hat{y}=σ(\sum _{j=1}^{n}{w_{j}} . {x_{j}}+b) \) (7)
\( {Importance_{j}}=|{w_{j}}| \) (8)
In order to analyze the impact of different features on the classification results, this paper draws a feature importance graph (as shown in Figure 3). In Figure 3, tabnet_output is the output feature of the TabNet model, which shows the highest importance in the integrated model.
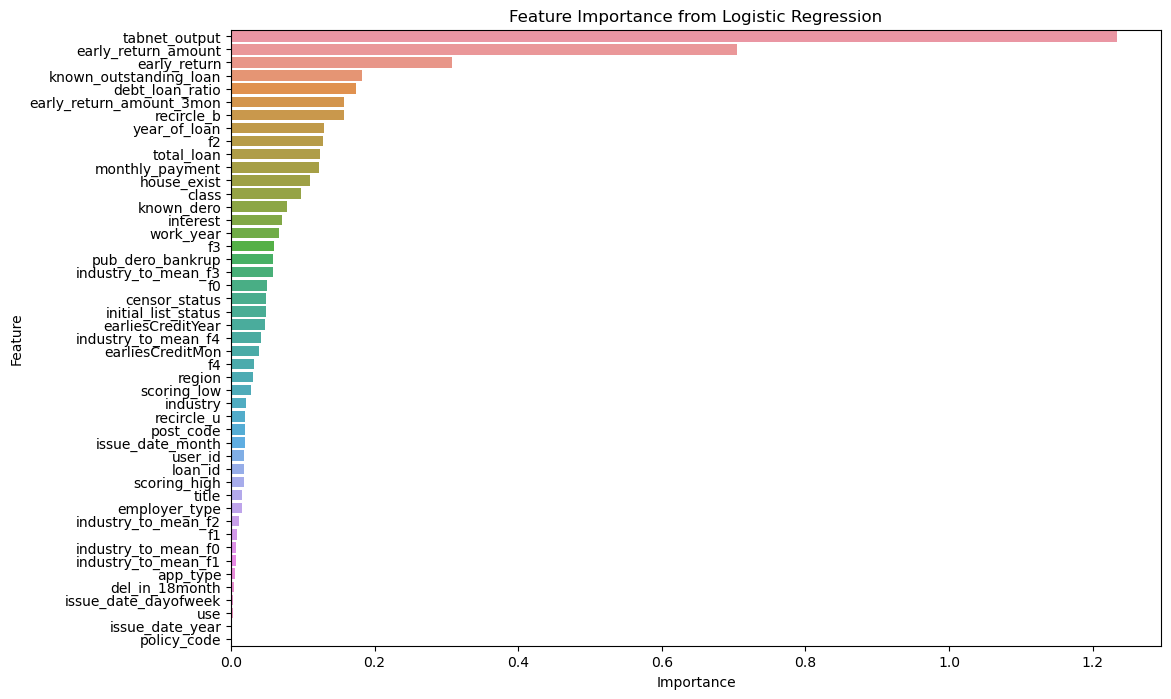
Figure 3. Feature importance graph
In the model, features related to early repayment and loan status show higher importance, indicating that they play a key role in credit risk assessment and have a significant impact on the final decision of the model. The high importance of these characteristics reflects their critical role in differentiating customer credit risk. In contrast, the relatively low importance of other features may mean that they contribute less to the classification results or that there is a certain degree of redundancy in information.
5. Conclusion
This study aims to improve the accuracy of predicting personal loan defaults by developing an effective credit risk assessment system, utilizing both TabNet and Logistic Regression models. Experimental results indicate that TabNet excels in feature extraction and initial classification, supplying high-quality input features for subsequent ensemble models. On this basis, through integration with Logistic Regression, the overall performance of the model is further enhanced, especially in key indicators such as accuracy and F1 score. Compared with traditional models, this integrated approach demonstrates stronger predictive capabilities and significantly improves the effectiveness of default risk assessment. Furthermore, this study presents a detailed examination of feature importance, highlighting the critical role of certain features in predicting defaults. The findings substantially enhance the precision of credit risk assessment and management. By integrating the deep feature learning strengths of TabNet with the interpretability of Logistic Regression, the research successfully developed a default prediction system that is both accurate and practical. The model exhibited excellent performance on several indicators during the experiment, notably achieving an AUC value of 0.89. This result both validated the model's predictive effectiveness and provided crucial decision-making support for financial institutions in the credit approval process. The findings of this study demonstrate that a machine learning-based default prediction system can effectively detect potential credit risks, significantly mitigate bad debt risks, and play a crucial role in enhancing business efficiency. This study offers new approaches and tools for credit risk management through effective data processing, feature engineering, and model selection. Additionally, it highlights future research directions, especially in enhancing model interpretability and managing larger datasets, where there remains potential for further development.
Future research could focus on integrating various machine learning algorithms and incorporating additional data sources and feature engineering methods to enhance the prediction model's performance. Moreover, the ongoing advancement in financial technology could introduce new data types and processing techniques, offering fresh insights and opportunities for improving default prediction. Therefore, continued attention and application of advanced technologies will help further improve the default prediction model and enhance the risk management level of financial institutions.
Authors Contribution
All the authors contributed equally and their names were listed in alphabetical order.
References
[1]. Chen Y, Wu H and Xu J 2020 A Study on Credit Scoring Model Based on Support Vector Machine. Journal of Financial Risk Management, 9(2), 134-146.
[2]. Zhao L, Wang J and Li Z 2019 Credit Risk Prediction Using Random Forest Algorithm: An Empirical Study. International Journal of Data Science and Analytics, 8(4), 263-275.
[3]. Wang H and Zhang Y 2021 Improved Credit Default Prediction Model Based on Gradient Boosting Trees. Journal of Finance and Data Science, 7(1), 50-64.
[4]. Breiman L 2001 Random Forests. Machine Learning, 45(1), 5-32.
[5]. Friedman J H 2001 Greedy Function Approximation: A Gradient Boosting Machine. Annals of Statistics, 29(5), 1189-1232.
[6]. Kingma D P and Ba J 2015 Adam: A Method for Stochastic Optimization. International Conference on Learning Representations (ICLR).
[7]. Ke G, Meng Q, Finley T, Wang T, Chen W, Ma W, Ye Q and Liu T-Y 2017 LightGBM: A Highly Efficient Gradient Boosting Decision Tree. Advances in Neural Information Processing Systems, 30(1), 3146-3154.
[8]. Goodfellow I, Bengio Y and Courville A 2016 Deep Learning. MIT Press.
[9]. Chen T and Guestrin C 2016 XGBoost: A Scalable Tree Boosting System. Proceedings of the 22nd ACM SIGKDD International Conference on Knowledge Discovery and Data Mining, 785-794.
[10]. Vaswani A, Shazeer N, Parmar N, Uszkoreit J, Jones L, Gomez A N, Kaiser Ł and Polosukhin I 2017 Attention is All You Need. Advances in Neural Information Processing Systems, 30(1), 5998-6008.
[11]. Witten I H, Frank E and Hall M A 2011 Data Mining: Practical Machine Learning Tools and Techniques (3rd ed.). Morgan Kaufmann.
[12]. Yoon J, Jordon J and Schaar M V D 2018 Gain: Missing Data Imputation Using Generative Adversarial Nets. Proceedings of the 35th International Conference on Machine Learning (ICML).
[13]. Arık S Ö and Pfister T 2020 TabNet: Attentive Interpretable Tabular Learning. arXiv:1908.07442v5 [cs.LG].
[14]. Dong G, Wang P and Xia L 2020 Forest Cover Type Prediction Method Based on TabNet. China University of Petroleum (East China).
Cite this article
Guan,Y.;Wang,Y.;Yang,Y. (2024). Personal Loan Default Prediction Analysis based on TabNet and Logistic Regression. Applied and Computational Engineering,103,169-177.
Data availability
The datasets used and/or analyzed during the current study will be available from the authors upon reasonable request.
Disclaimer/Publisher's Note
The statements, opinions and data contained in all publications are solely those of the individual author(s) and contributor(s) and not of EWA Publishing and/or the editor(s). EWA Publishing and/or the editor(s) disclaim responsibility for any injury to people or property resulting from any ideas, methods, instructions or products referred to in the content.
About volume
Volume title: Proceedings of the 2nd International Conference on Machine Learning and Automation
© 2024 by the author(s). Licensee EWA Publishing, Oxford, UK. This article is an open access article distributed under the terms and
conditions of the Creative Commons Attribution (CC BY) license. Authors who
publish this series agree to the following terms:
1. Authors retain copyright and grant the series right of first publication with the work simultaneously licensed under a Creative Commons
Attribution License that allows others to share the work with an acknowledgment of the work's authorship and initial publication in this
series.
2. Authors are able to enter into separate, additional contractual arrangements for the non-exclusive distribution of the series's published
version of the work (e.g., post it to an institutional repository or publish it in a book), with an acknowledgment of its initial
publication in this series.
3. Authors are permitted and encouraged to post their work online (e.g., in institutional repositories or on their website) prior to and
during the submission process, as it can lead to productive exchanges, as well as earlier and greater citation of published work (See
Open access policy for details).
References
[1]. Chen Y, Wu H and Xu J 2020 A Study on Credit Scoring Model Based on Support Vector Machine. Journal of Financial Risk Management, 9(2), 134-146.
[2]. Zhao L, Wang J and Li Z 2019 Credit Risk Prediction Using Random Forest Algorithm: An Empirical Study. International Journal of Data Science and Analytics, 8(4), 263-275.
[3]. Wang H and Zhang Y 2021 Improved Credit Default Prediction Model Based on Gradient Boosting Trees. Journal of Finance and Data Science, 7(1), 50-64.
[4]. Breiman L 2001 Random Forests. Machine Learning, 45(1), 5-32.
[5]. Friedman J H 2001 Greedy Function Approximation: A Gradient Boosting Machine. Annals of Statistics, 29(5), 1189-1232.
[6]. Kingma D P and Ba J 2015 Adam: A Method for Stochastic Optimization. International Conference on Learning Representations (ICLR).
[7]. Ke G, Meng Q, Finley T, Wang T, Chen W, Ma W, Ye Q and Liu T-Y 2017 LightGBM: A Highly Efficient Gradient Boosting Decision Tree. Advances in Neural Information Processing Systems, 30(1), 3146-3154.
[8]. Goodfellow I, Bengio Y and Courville A 2016 Deep Learning. MIT Press.
[9]. Chen T and Guestrin C 2016 XGBoost: A Scalable Tree Boosting System. Proceedings of the 22nd ACM SIGKDD International Conference on Knowledge Discovery and Data Mining, 785-794.
[10]. Vaswani A, Shazeer N, Parmar N, Uszkoreit J, Jones L, Gomez A N, Kaiser Ł and Polosukhin I 2017 Attention is All You Need. Advances in Neural Information Processing Systems, 30(1), 5998-6008.
[11]. Witten I H, Frank E and Hall M A 2011 Data Mining: Practical Machine Learning Tools and Techniques (3rd ed.). Morgan Kaufmann.
[12]. Yoon J, Jordon J and Schaar M V D 2018 Gain: Missing Data Imputation Using Generative Adversarial Nets. Proceedings of the 35th International Conference on Machine Learning (ICML).
[13]. Arık S Ö and Pfister T 2020 TabNet: Attentive Interpretable Tabular Learning. arXiv:1908.07442v5 [cs.LG].
[14]. Dong G, Wang P and Xia L 2020 Forest Cover Type Prediction Method Based on TabNet. China University of Petroleum (East China).