


1. Introduction
The traffic jam caused by massive traffic flow has become a critical challenge faced by cities worldwide, with significant implications for economic productivity and environmental protection works [1]. As cities expand and more people acquire vehicles, this problem has become a daily routine for millions of citizens. This not only results in extended travel times but also contributes to higher fuel consumption and increased greenhouse gas emissions, further exacerbating environmental concerns [2].
Traditional traffic management systems often rely on static models and historical data to make decisions [3]. These methods, while useful in certain scenarios, frequently fall short when it comes to adapting to real-time traffic conditions and predicting future traffic patterns [4]. The dynamic and nonlinear nature of urban traffic flow requires more advanced predictive models capable of handling the complexity and variability inherent in such systems.
In recent times, machine learning and deep learning strategies have surfaced as powerful tools for addressing the challenges of traffic prediction. These techniques autonomously extract knowledge from large datasets, recognizing patterns and generating predictions that are more precise than those derived from traditional models. Among these techniques, Long Short-Term Memory (LSTM) networks, a specific variant of recurrent neural networks (RNNs), shows particular promise for time-series forecasting tasks [5]. LSTM networks are developed to address the shortcomings of conventional RNNs, by addressing issues related to long-term dependencies and gradient vanishing, which makes them particularly effective for sequential data, such as traffic flow [6].
By capturing temporal dependencies in data, LSTM networks are particularly suited for traffic congestion prediction. With considering the sequence of past traffic conditions, LSTM models can forecast future traffic states with greater accuracy. This capability is particularly valuable in urban environments, where traffic patterns can change rapidly due to a variety of factors such as weather conditions, roadworks, accidents, and fluctuations in demand during peak hours [7].
This study aims to develop a predictive model based on LSTM networks to leverage Long Short-Term Memory (LSTM) models to predict traffic volume across Interstate-94 (I-94) in the US, using a dataset that includes hourly traffic and weather data from 2012 to 2018 [8]. The choice of this region is motivated by its complex and heavily congested traffic network, which presents a challenging yet representative case for evaluating the effectiveness of the LSTM model. The primary objective of this study is to equip city architects and traffic management authorities with a reliable tool. For short-term traffic forecasting, enabling more informed decisions that can alleviate congestion and improve the efficiency of the transportation system.
2. Methodology
2.1. Data sources and descriptions
The Interstate Traffic Volume Dataset comprises information about the hourly traffic volume on the West-bound lane of Interstate-94 (I-94) in the US. The dataset includes hourly weather and temperature reports from 2012 to 2018 (Table 1).
Table 1. Data Baseline
Timestamp | Temp | Rain | Snow | Clouds | Weather_m | Holidays | Volume |
2012-10-02 09:00:00 | 288.28 | 0.0 | 0.0 | 40 | Clouds | None | 5545 |
2015-07-24 03:00:00 | 294.2 | 5.25 | 0.0 | 90 | Heavy Rain | None | 401 |
2015-12-26 11:00:00 | 271.17 | 0.0 | 0.21 | 90 | Light Snow | None | 2013 |
The information in the dataset can be used to understand the flow of traffic on the interstate with respect to time and date and can be helpful in prediction of rush hours, weather forecasting as well as planning expansions of interstates and highways in the US.
Furthermore, weather data collected hourly and holiday information are incorporated to assess their influence on traffic volume. To normalize the data, the min-max scaling technique is applied preprocess the traffic data, preventing issues such as gradient explosion and accelerating the model’s convergence. The equation is given below:
\( y=\frac{x-{x_{min}}}{{x_{max}}-{x_{min}}} \) (1)
Where y refers to the normalized value, and x corresponds to the original value, and \( {x_{max}} \) refers to the highest value, and \( {x_{min}} \) to the lowest value in the original dataset.
2.2. Data preprocessing
The statistical analysis provides an initial exploration of the dataset, offering insights into its key characteristics. This involves calculating statistics that describe, such as mean, median, standard deviation, and range, and to summarize the distribution and central tendencies of the data. Additionally, this analysis helps identify any outliers or anomalies and examines correlations between variables. By understanding the basic statistical properties of the data, this step ensures that the subsequent data preprocessing and model development processes are informed and appropriately tailored to the dataset's characteristics (Table 2).
Table 2. Data Preprocessing
count | mean | std | min | 25% | 50% | 75% | max | |
temp | 48204 | 281.205 | 13.338 | 0 | 272.16 | 282.45 | 291.806 | 310.07 |
rain_1h | 48204 | 0.3342 | 44.789 | 0 | 0 | 0 | 0 | 9831.3 |
Snow_1h | 48204 | 0.0002 | 0.008 | 0 | 0 | 0 | 0 | 0.51 |
all | 48204 | 49.362 | 39.015 | 0 | 1 | 64 | 90 | 100 |
volume | 48204 | 3259.818 | 1986.86 | 0 | 1193 | 3380 | 4933 | 7280 |
2.3. Indicator selection
The Mean Absolute Error (MAE) is a measurement of the average magnitude of errors between predicted and actual traffic values. It is defined as:
\( MAE=\frac{1}{N}\sum _{i=1}^{N}|{y_{i}}-{\hat{y}_{i}}| \) (2)
Where \( {y_{i}} \) is the actual traffic value, \( {\hat{y}_{i}} \) is marked as the prediction result, and \( N \) is the count of the predictions. Lower values are indicative of better performance, and this is used to assess the model's accuracy.
Root Mean Square Error (RMSE) calculates the square root of the average squared difference between predicted and actual values:
\( RMSE=\sqrt[]{\frac{1}{N}\sum _{i=1}^{N}({y_{i}}-{\hat{y}_{i}}{)^{2}}} \) (3)
\( RMSE \) is sensitive to larger errors and is therefore useful for understanding the variance in prediction accuracy.
2.4. Methods introduction
The LSTM network is designed to capture temporal dependencies in sequential data, making it ideal for time-series forecasting such as traffic flow prediction. The input to the model includes a sequence of traffic flow data from various detectors, and the output is the predicted traffic flow for the subsequent time steps (Figure 1).
The LSTM architecture includes the following layers: Input Layer: Receives the sequence of normalized traffic data, typically over a fixed window size. LSTM Layers: One or more LSTM layers to learn the temporal dependencies in the traffic data, equipped with forget gates to manage long-term dependencies. Dense (Fully Connected) Layer: Maps the LSTM outputs to the desired prediction output. Output Layer: Produces the predicted traffic flow values for the upcoming time steps [9, 10].
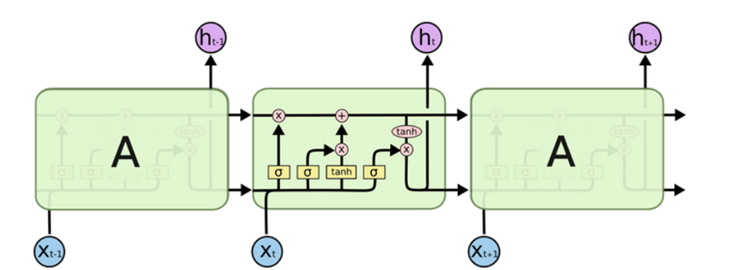
Figure 1. LSTM Network [4]
3. Results and discussion
3.1. Data overview
Creating a data overview is essential for gaining an initial understanding of the dataset. It helps to identify key patterns, trends, and anomalies in the data, such as seasonal variations or outliers, which could significantly impact the analysis. Additionally, visualizing the relationships between different variables, like weather conditions and traffic volume, provides insights into potential correlations and dependencies. This step is crucial for informing the subsequent data preprocessing and modeling strategies, ensuring that the analysis is based on a thorough understanding of the dataset's characteristics.
To generate the overview plot of the dataset, first, select the columns of interest, which include temperature (temp), rainfall (rain_1h), snowfall (snow_1h), cloud coverage (clouds_all), and traffic volume (traffic_volume). These columns are then extracted from the main DataFrame df_raw into a new DataFrame plot_features. Next, use the plot() function with subplots=True to create individual subplots for each feature, and set the figure size to (12,8) for clarity. This results in a series of time series plots that visually represent the data across different weather and traffic metrics (Figure 2).
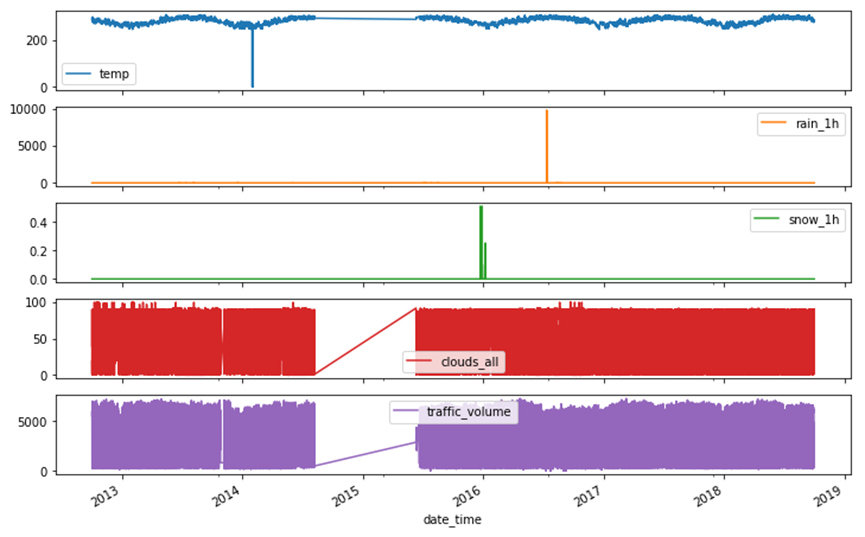
Figure 2. Data Overview
Figure 2 provides an overview of the dataset describing the traffic volume of the Metro Interstate, which captures traffic volumes and varying weather conditions over time. The subplots display different variables: temperature (temp), rainfall (rain_1h), snowfall (snow_1h), cloud coverage (clouds_all), and traffic volume (traffic_volume). The time series spans from 2012 to 2018. Notable features include a relatively stable temperature trend, sporadic rain and snow events, varying cloud coverage, and fluctuating traffic volumes, which are influenced by these weather conditions and seasonal patterns. This visualization highlights the interactions between weather factors and traffic flow.
3.2. LSTM model results
In the LSTM operation, the dataset was segmented into sequences, and then split into training sets (80%) and the left are used as testing sets. The certain LSTM model was programmed by PyTorch. It features an LSTM layer. Subsequently, a linear output layer is utilized to capture temporal dependencies in the traffic data. Using the Adam optimizer and the Mean Squared Error (MSE) loss function, the model underwent training for 100 epochs, adjusting its settings to minimize the loss. Metrics such as MAE, RMSE, and \( {R^{2}} \) are used to evaluate the model's performance on the test set and visualizations were created to compare actual versus predicted traffic volumes, gives a clear view of the model's accuracy and convergence during training (Figure 3).
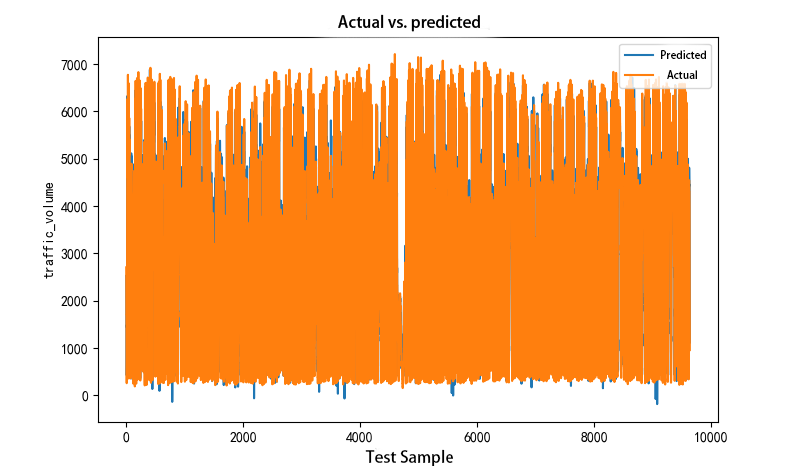
Figure 3. Actual vs. Predicted Values
The LSTM model's performance is visually performed by the plot above between the actual and predicted values. In this plot, the actual traffic volumes are plotted alongside the predicted values generated by the model. The traffic data's underlying patterns are accurately captured by the model by a close alignment. Any significant deviations between the curves highlight areas where the model's predictions may need improvement, providing valuable insights for further model refinement and optimization. This comparison is essential for validating the model's applicability in real-life situations (Figure 4).
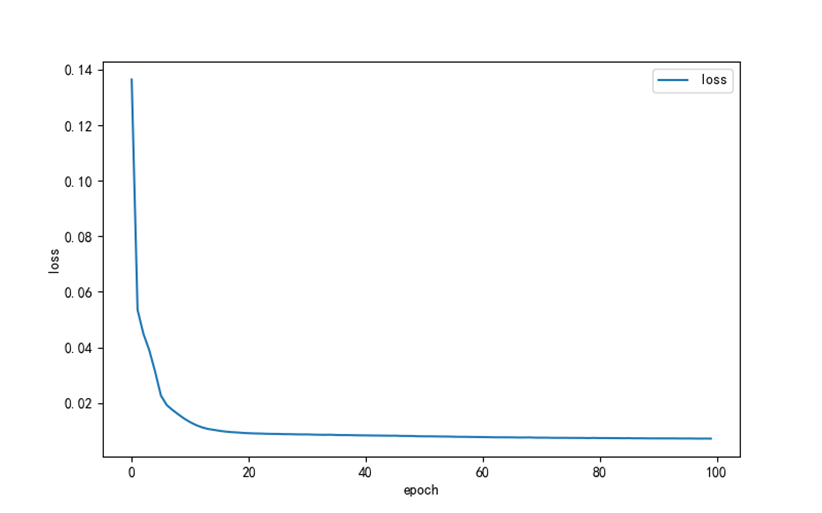
Figure 4. Loss Curve
The loss curve illustrates how the model's training is progressing by plotting the loss value against the number of epochs. As the training progresses, the curve typically shows a decreasing trend, demonstrating that the model is in the process of acquiring knowledge and minimizing the prediction error. A smooth, downward-sloping loss curve suggests that the model is converging well, while any plateaus or fluctuations may indicate issues such as overfitting or the need for further tuning. This curve is crucial for assessing the effectiveness of the training process and determining when the model has reached optimal performance.
3.3. Simulation results
Several key metrics were used to evaluate the performance of the LSTM model. The Mean Absolute Error (MAE) was 353.79, which is the average absolute difference between predicted and actual traffic volumes. The Mean Squared Error (MSE) was 227,755.51, reflecting the model's overall prediction error. The Root Mean Squared Error (RMSE), which means the magnitude of prediction errors, was 477.24. Lastly, the \( {R^{2}} \) was 0.9412, explains 94.12% of the changes in the traffic volume data, demonstrating a strong fit.
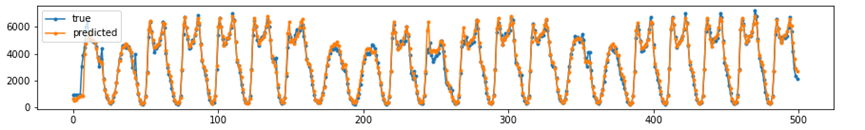
Figure 5. Prediction Evaluation
This graph compares the true traffic volume (in blue) with the predicted traffic volume (in orange) generated by the LSTM model over a series of time steps (Figure 5). According to close alignment between two curves, the model has effectively captured the underlying patterns in the data. Although there are minor deviations, the predicted values generally follow the trend of the actual traffic volumes, which proves the model's ability to forecast traffic flow accurately. This visual comparison is a vital validation of the algorithms’ performance.
Table 3. Simulation Results
Metric | Value |
MAE | 353.79 |
MSE | 227,755.51 |
RMSE | 477.24 |
\( {R^{2}} \) | 0.9412 |
Model Accuracy: The LSTM model exhibits strong accuracy, reflected by the low Mean Absolute Error (MAE) of 353.79. It can be found that the model's predictions are in close agreement with realistic traffic volumes on average (Table 3).
Prediction Precision: The Root Mean Square Error (RMSE) of 477.24 suggests that most prediction errors are within a relatively small range, further affirming the model's precision.
Variance Explanation: The high value \( {R^{2}} \) of 0.9412 demonstrates that the model effectively captures and explains over 94% of the fluctuation in traffic volume data, which indicates the model and the observed data have a strong compatibility.
Overall Model Performance: The combination of these metrics-two very low values along with a high \( {R^{2}} \) score-provides strong evidence that the LSTM model is well-suited for traffic flow prediction tasks. The results imply that the model can be relied upon to make accurate traffic volume forecasts. Effective traffic management and planning requires this crucial factor.
The effectiveness of using LSTM networks is underlined by these findings for time-series forecasting, particularly in scenarios where accurate predictions of dynamic, real-world data are necessary.
4. Conclusion
This study highlighted the potential of Long Short-Term Memory (LSTM) networks in accurately making the prediction of the traffic flow on Interstate-94. Furthermore, The LSTM model successfully identifies and utilizes the time-based patterns present in traffic data, provided precise forecasts, which is proved by the low Mean Absolute Error and Root Mean Square Error values. The analysis reveals that LSTM models are well-suited for handling the complexities of urban traffic patterns, which offers a reliable tool for improving traffic management systems.
Moreover, the study emphasizes the significance of the advanced deep learning algorithms particularly LSTM in modern urban planning. The implementation of LSTM models in traffic forecasting plays an important role to increase the ability of better predicting and managing traffic congestion. Combined up-to-the-minute data, including weather conditions with roadworks, future research might improve the model's forecasting capability even more. Additionally, deploying the model in a current traffic management system could provide officers with the meaningful guidance needed to optimize traffic flow. It can help to reduce the overloaded traffic condition, and improve the satisfaction of all citizens.
References
[1]. Barros J, Araujo M and Rossetti R J F 2015 Short-term real-time traffic prediction methods: A survey. 2015 international conference on models and technologies for intelligent transportation systems (MT-ITS). IEEE, 132-139.
[2]. Tedjopurnomo D A, Bao Z, Zheng B, et al. 2020 A survey on modern deep neural network for traffic prediction: Trends, methods and challenges. IEEE Transactions on Knowledge and Data Engineering, 34(4), 1544-1561.
[3]. Yau K L A, Qadir J, Khoo H L, et al. 2017 A survey on reinforcement learning models and algorithms for traffic signal control. ACM Computing Surveys (CSUR), 50(3), 1-38.
[4]. Bouzidi E L H, Outtagarts A, Langar R, et al. 2021 Deep Q-Network and traffic prediction based routing optimization in software defined networks. Journal of Network and Computer Applications, 192, 103181.
[5]. Mi X, Yu C, Liu X, et al. 2022 A dynamic ensemble deep deterministic policy gradient recursive network for spatiotemporal traffic speed forecasting in an urban road network. Digital Signal Processing, 129, 103643.
[6]. Wei H, Zheng G, Gayah V, et al. 2021 Recent advances in reinforcement learning for traffic signal control: A survey of models and evaluation. ACM SIGKDD Explorations Newsletter, 22(2), 12-18.
[7]. Lee K, Eo M, Jung E, et al. 2021 Short-term traffic prediction with deep neural networks: A survey[J]. IEEE Access, 9, 54739-54756.
[8]. Jiang R, Yin D, Wang Z, et al. 2021 Dl-traff: Survey and benchmark of deep learning models for urban traffic prediction. Proceedings of the 30th ACM international conference on information & knowledge management, 4515-4525.
[9]. Jiang W and Luo J 2022 Graph neural network for traffic forecasting: A survey. Expert systems with applications, 207, 117921.
[10]. Wei H, Zheng G, Gayah V, et al. 2021 Recent advances in reinforcement learning for traffic signal control: A survey of models and evaluation. ACM SIGKDD Explorations Newsletter, 22(2), 12-18.
Cite this article
Dai,X. (2024). Research on Urban Traffic Flows Prediction Model Based on Deep Learning. Applied and Computational Engineering,94,161-167.
Data availability
The datasets used and/or analyzed during the current study will be available from the authors upon reasonable request.
Disclaimer/Publisher's Note
The statements, opinions and data contained in all publications are solely those of the individual author(s) and contributor(s) and not of EWA Publishing and/or the editor(s). EWA Publishing and/or the editor(s) disclaim responsibility for any injury to people or property resulting from any ideas, methods, instructions or products referred to in the content.
About volume
Volume title: Proceedings of CONF-MLA 2024 Workshop: Securing the Future: Empowering Cyber Defense with Machine Learning and Deep Learning
© 2024 by the author(s). Licensee EWA Publishing, Oxford, UK. This article is an open access article distributed under the terms and
conditions of the Creative Commons Attribution (CC BY) license. Authors who
publish this series agree to the following terms:
1. Authors retain copyright and grant the series right of first publication with the work simultaneously licensed under a Creative Commons
Attribution License that allows others to share the work with an acknowledgment of the work's authorship and initial publication in this
series.
2. Authors are able to enter into separate, additional contractual arrangements for the non-exclusive distribution of the series's published
version of the work (e.g., post it to an institutional repository or publish it in a book), with an acknowledgment of its initial
publication in this series.
3. Authors are permitted and encouraged to post their work online (e.g., in institutional repositories or on their website) prior to and
during the submission process, as it can lead to productive exchanges, as well as earlier and greater citation of published work (See
Open access policy for details).
References
[1]. Barros J, Araujo M and Rossetti R J F 2015 Short-term real-time traffic prediction methods: A survey. 2015 international conference on models and technologies for intelligent transportation systems (MT-ITS). IEEE, 132-139.
[2]. Tedjopurnomo D A, Bao Z, Zheng B, et al. 2020 A survey on modern deep neural network for traffic prediction: Trends, methods and challenges. IEEE Transactions on Knowledge and Data Engineering, 34(4), 1544-1561.
[3]. Yau K L A, Qadir J, Khoo H L, et al. 2017 A survey on reinforcement learning models and algorithms for traffic signal control. ACM Computing Surveys (CSUR), 50(3), 1-38.
[4]. Bouzidi E L H, Outtagarts A, Langar R, et al. 2021 Deep Q-Network and traffic prediction based routing optimization in software defined networks. Journal of Network and Computer Applications, 192, 103181.
[5]. Mi X, Yu C, Liu X, et al. 2022 A dynamic ensemble deep deterministic policy gradient recursive network for spatiotemporal traffic speed forecasting in an urban road network. Digital Signal Processing, 129, 103643.
[6]. Wei H, Zheng G, Gayah V, et al. 2021 Recent advances in reinforcement learning for traffic signal control: A survey of models and evaluation. ACM SIGKDD Explorations Newsletter, 22(2), 12-18.
[7]. Lee K, Eo M, Jung E, et al. 2021 Short-term traffic prediction with deep neural networks: A survey[J]. IEEE Access, 9, 54739-54756.
[8]. Jiang R, Yin D, Wang Z, et al. 2021 Dl-traff: Survey and benchmark of deep learning models for urban traffic prediction. Proceedings of the 30th ACM international conference on information & knowledge management, 4515-4525.
[9]. Jiang W and Luo J 2022 Graph neural network for traffic forecasting: A survey. Expert systems with applications, 207, 117921.
[10]. Wei H, Zheng G, Gayah V, et al. 2021 Recent advances in reinforcement learning for traffic signal control: A survey of models and evaluation. ACM SIGKDD Explorations Newsletter, 22(2), 12-18.