


1.Introduction
In the modern business environment, customer churn prediction has become one of the key means for enterprises to maintain competitive advantage. As market competition becomes increasingly fierce and customer acquisition costs continue to rise, how to effectively retain existing customers has become a core issue for enterprises. Statistics show that most companies invest 5 to 6 times more manpower, material resources, and financial resources for a new customer than for an old customer [1]. Therefore, reducing customer churn can not only save marketing costs, but also significantly improve the company's long-term profits. In light of this, predicting customer churn has emerged as a key area of research for data scientists.
Customer churn describes the practice of present clients giving up on buying offered goods or services. Customer churn prediction's primary objective is to detect potential future churn prospects so that businesses can implement suitable retention tactics. In order to achieve this goal, researchers have been arguing over how to reduce customer churn. Cao Guilin et al. wanted to use machine learning methods to conduct a preliminary analysis of relevant data using a logistic regression model, and then further analyze the data using a deep neural network model with dropout regularization [2, 3]. However, this method faces limitations such as data scarcity and imbalance, difficulty in feature selection, model complexity and lack of interpretability, overfitting, high computing resource requirements, and complex model updates and maintenance. These challenges limit the widespread application of machine learning models in customer churn prediction.
Traditional statistical techniques, including logistic regression (LR), Bayesian classifiers, and support vector machines (SVM), were mostly employed in the early stages of customer churn prediction [4-6]. In order to anticipate customer churn, techniques like random forest (RF) and gradient-boosted decision tree (GBDT) have become more and more popular with the advent of ensemble learning [3]. Some academics have also been interested in experimenting with deep learning techniques to forecast client attrition in recent years. Ji Juan wants to enable machine learning to extract more effective features by letting machines train on large amounts of data, thereby significantly improving the accuracy of classification and prediction [7]. However, due to the limited amount of data on lost customers, the results of deep learning models are unsatisfactory [8-10]. Therefore, the current mainstream methods are still dominated by traditional statistical methods and ensemble learning [3].
Therefore, this article will explore in depth the customer churn prediction model based on statistical methods and ensemble learning, analyze the effectiveness, applicability, and performance of these methods in practical applications, and provide a reference for enterprises in selecting and applying prediction models.
2.Method and data
2.1.Data
This article uses a data set about telco customer churn, which comes from the Kaggle website (https://www.kaggle.com/code/danishmubashar/telco-customer-churn-99-acc/input). The dataset contains 7032 records and 21 features. These features cover the basic information about customers, service types, account status, and monthly fees. It was compiled by Danish Mubashar and published on April 7, 2024.
The data used in this article consists of 7032 people, including churned customers and non-churned customers (customers who left last month are called churned customers), of which 3549 are male and 3483 are female. The data set contains 19 variables (gender, SeniorCitizen, Partner, Dependents, tenure, PhoneService, MultipleLines, InternetService, OnlineSecurity, OnlineBackup, DeviceProtection, TechSupport, StreamingTV, StreamingMovies, Contract, PaperlessBilling, PaymentMethod, MonthlyCharges, TotalCharges). In order to better present the visualization effect, this article only selects gender, SeniorCitizen, Partner, tenure, StreamingTV, StreamingMovies, Contract, PaperlessBilling, PaymentMethod, MonthlyCharges, and TotalCharges for detailed analysis.
Table 1: Gender distribution of total expenses
|
TotalChanges |
[0-2100] |
[2100-4200] |
[4200-6300] |
[6300-8400] |
Total |
|
|
Female |
churn(no) |
1434 |
454 |
404 |
252 |
2544 |
|
churn(yes) |
692 |
152 |
69 |
26 |
939 |
|
|
Female Summary |
2126 |
606 |
473 |
278 |
3483 |
|
|
Male |
churn(no) |
1469 |
498 |
408 |
244 |
2619 |
|
churn(yes) |
662 |
143 |
83 |
42 |
930 |
|
|
Male Summary |
2131 |
641 |
491 |
286 |
3549 |
|
|
Total |
4257 |
1247 |
964 |
564 |
7032 |
|
Table 1 shows the number of males and females who become churned customers or remain churned customers at different consumption levels. According to the table, When the total consumption is between [0-2100], the customer churn rate is high, and the female churn rate is slightly higher than that of male customers. Among them, there are 1434 female customers who have not churned and 692 who have churned. The churn rate of female customers is 32.5%. There are 1469 male customers who have not churned, and 662 who have churned. The churn rate of male customers is 31.1%. As the number of changes increases, the customer churn rate gradually decreases, especially when the total consumption reaches [6300-8400], the churn rate decreases significantly.
2.2.Method
Multiple linear regression and RF are two statistical and machine learning techniques used in this work to create a customer churn prediction model.
Multiple linear regression is used to examine the linear connection between several independent variables and a continuous dependent variable. It is possible to quantify the effect of the independent factors on the dependent variable by creating a regression equation.
Model formula:\( Y={β_{0}}+{β_{1}}{X_{1}}+{β_{2}}{X_{2}}+{β_{3}}{X_{3}}+{…+β_{n}}{X_{n}}+ϵ \)(1)
Among them:\( Y \)is the dependent variable;\( {X_{1}}{X_{2}},…,{X_{n}} \)are independent variables;\( {β_{0}} \)is the constant term;\( {β_{1}}{,β_{2}},…,{β_{n}} \)are the coefficients corresponding to the respective variables, indicating the contribution of each feature to the dependent variable;\( ϵ \)is the error term, indicating the unexplained random error. Its advantages are that it is simple and easy to understand, can provide a direct explanation of the independent variable to the dependent variable, and is applicable to problems with clear linear relationships.
Based on decision trees, RF is an ensemble learning system. It builds multiple decision trees lets each tree make independent predictions, and finally gets the final result by "voting" or "averaging". The working principle is shown in Figure 1.
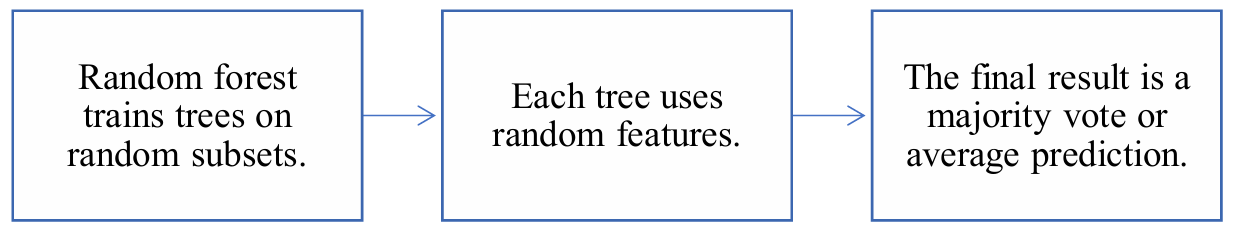
Figure 1: The process of Random Forest
Its advantages are that it can handle complex nonlinear relationships, is suitable for high-dimensional data, and is robust to noise and missing values, preventing overfitting and having good generalization ability, reducing the risk of overfitting through randomness.
Next, this article will use SPSSAU to analyze the relationship between the impact of X on Y, that is, the relationship between 19 factors and customer churn. Churn is the dependent variable (Y), and the other 19 are independent variables (X), where No means no and Yes means yes.
3.Results and discussion
3.1.Multiple Linear Regression
|
Table 2: Linear regression analysis results (n=7032) |
|||||||
|
Unstandardized coefficients |
Standardized coefficient |
t |
p |
Collinearity diagnostics |
|||
|
B |
Standard error |
Beta |
VIF |
Tolerance |
|||
|
gender |
-0.004 |
0.009 |
-0.004 |
-0.436 |
0.663 |
1.002 |
0.998 |
|
SeniorCitizen |
0.050 |
0.013 |
0.042 |
3.833 |
0.000** |
1.150 |
0.870 |
|
Partner |
0.002 |
0.011 |
0.002 |
0.151 |
0.880 |
1.461 |
0.684 |
|
tenure |
-0.002 |
0.001 |
-0.093 |
-3.358 |
0.001** |
7.494 |
0.133 |
|
StreamingTV |
-0.001 |
0.006 |
-0.001 |
-0.113 |
0.910 |
1.447 |
0.691 |
|
StreamingMovies |
-0.000 |
0.006 |
-0.000 |
-0.010 |
0.992 |
1.448 |
0.691 |
|
Contract |
-0.043 |
0.009 |
-0.080 |
-4.998 |
0.000** |
2.493 |
0.401 |
|
PaperlessBilling |
0.050 |
0.010 |
0.056 |
5.007 |
0.000** |
1.203 |
0.832 |
|
payment method |
0.008 |
0.005 |
0.019 |
1.705 |
0.088 |
1.186 |
0.843 |
|
MonthlyCharges |
0.006 |
0.000 |
0.397 |
17.525 |
0.000** |
4.968 |
0.201 |
|
TotalCharges |
-0.000 |
0.000 |
-0.265 |
-7.997 |
0.000** |
10.619 |
0.094 |
|
R 2 |
0.275 |
||||||
|
Adjust R 2 |
0.273 |
||||||
|
F |
F (19,7012)=140.246,p=0.000 |
||||||
|
D-W value |
2.003 |
||||||
|
Note: Dependent variable = Churn |
|||||||
|
*p<0.05 **p<0.01 |
|||||||
The\( {R^{2}} \)of this multiple linear regression model reaches 0.275, which means that these independent variables can explain 27.5% of the change in Churn (Table 2). When the model is tested by F, the F test result (F=140.246, p=0.000<0.05) shows that the model as a whole is statistically significant, that is, at least one independent variable has a significant impact on customer churn.
It can be found that the p-values of the five variables such as gender, Partner, StreamingTV, StreamingMovies, and PaymentMethod are relatively high and the effect is not significant, so the paper decided to do a stepwise regression to see the effect.
|
Table 3: Results of stepwise regression analysis (n=7032) |
|||||||
|
Unstandardized coefficients |
Standardized coefficient |
t |
p |
Collinearity diagnostics |
|||
|
B |
Standard error |
Beta |
VIF |
Tolerance |
|||
|
constant |
1.442 |
0.044 |
- |
32.786 |
0.000** |
- |
- |
|
SeniorCitizen |
0.050 |
0.013 |
0.042 |
3.859 |
0.000** |
1.137 |
0.880 |
|
tenure |
-0.002 |
0.000 |
-0.102 |
-3.761 |
0.000** |
7.110 |
0.141 |
|
Contract |
-0.043 |
0.008 |
-0.081 |
-5.089 |
0.000** |
2.439 |
0.410 |
|
PaperlessBilling |
0.050 |
0.010 |
0.055 |
4.975 |
0.000** |
1.201 |
0.832 |
|
MonthlyCharges |
0.006 |
0.000 |
0.393 |
18.131 |
0.000** |
4.552 |
0.220 |
|
TotalCharges |
-0.000 |
0.000 |
-0.261 |
-7.934 |
0.000** |
10.487 |
0.095 |
|
R 2 |
0.275 |
||||||
|
Adjust R 2 |
0.274 |
||||||
|
F |
F (14,7017)=190.165,p=0.000 |
||||||
|
D-W value |
2.003 |
||||||
|
Note: Dependent variable = Churn |
|||||||
|
* p<0.05 ** p<0.01 |
|||||||
The model is effective, based on the F test (F=190.165, p=0.000<0.05) displayed in Table 3. The particular analysis uses SeniorCitizen as an illustration. Senior Citizen's regression coefficient value is 0.050 (t=3.859, p=0.000<0.01), indicating a substantial positive influence of Senior Citizen on Churn.
According to the summary study, Churn will be significantly improved by SeniorCitizen, PaperlessBilling, and monthly charges. On the other hand, tenure, contract, and total charges will negatively affect churn.
3.2.Random Forest
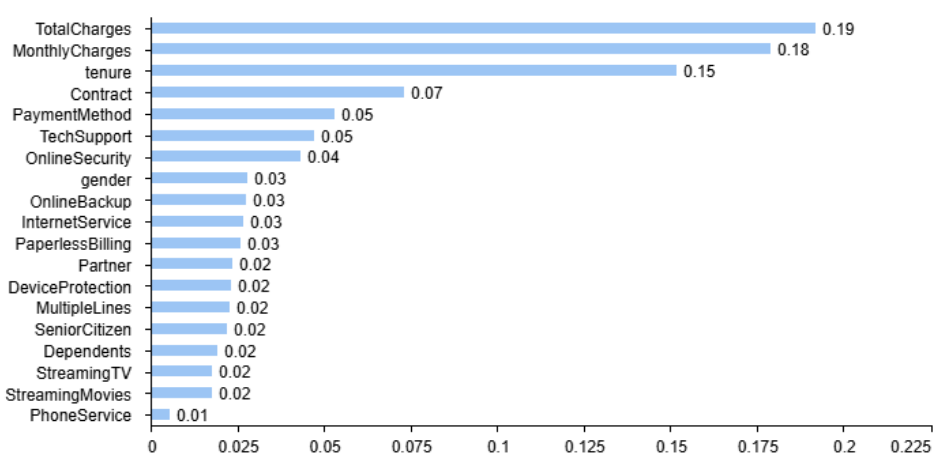
Figure 2: Feature Weight Graph
As shown in Figure 2, feature weight analysis shows that Total Charges, Monthly Charges, and Tenure are the three variables that have the most significant impact on the customer churn model, accounting for 19.21%, 17.89%, and 15.20% respectively. This means that these variables play an important role in predicting customer churn and have reference value for optimizing customer management and decision-making.
|
Table 4: Random Forest Model Summary Table |
||
|
name |
Parameter name |
Parameter Value |
|
Model evaluation effect |
Accuracy |
79.176% |
|
Precision (comprehensive) |
77.934% |
|
|
Recall (comprehensive) |
79.176% |
|
|
f1-score |
0.782 |
|
Table 4 above shows that RF modeling is used, the maximum depth of the tree is unrestricted, the node splitting standard is gini, the number of decision trees is 100, and the training set ratio is set at 0.8. The final model has an accuracy of 79.18% on the test set, a precision (comprehensive) of 77.93%, a recall (comprehensive) of 79.18%, and an f1-score (comprehensive) of 0.78. Comprehensive indicators show that RF performs better.
The above study used multiple linear regression and RF models to conduct predictive analysis on customer churn. The results show that the explanatory power of the multiple linear regression model is limited, and the\( {R^{2}} \)value is at a low level, indicating that the independent variables are insufficient to explain customer churn. At the same time, the RF model performed significantly better than multiple regression, achieving higher accuracy and model stability. Important variables such as customer satisfaction and service usage frequency contribute significantly to churn prediction in the RF model, and the significance level reaches statistical requirements.
4.Conclusion
This study used multiple linear regression and RF models to predict customer churn. Although multiple linear regression provided some insights, its explanatory power was limited, with an\( {R^{2}} \)of only 0.275. In contrast, the RF model performed better, with an accuracy of 79.18%, and showed strong robustness. Through analysis, it was found that SeniorCitizen, PaperlessBilling, and MonthlyCharges had a significant positive impact on churn, while tenure, Contract, and TotalCharges had a significant negative impact on churn. Among all the features, TotalCharges, MonthlyCharges, and tenure had the most significant impact on the customer churn model, contributing 19.21%, 17.89%, and 15.20%, respectively. These key features provide companies with a valuable basis for prediction. By leveraging the advantages of ensemble learning methods, companies can significantly improve their ability to predict and reduce customer churn. Future research can further explore hybrid models and deep learning techniques to improve prediction accuracy and address the challenges of data imbalance and feature selection.
References
[1]. Xue, X. (2023). Research on the influencing factors and countermeasures of corporate customer loyalty. Time-Honored Brand Marketing, 12, 132-134.
[2]. Cao, G., Yang, X., & Wang, R. (2024). Analysis of bank customer churn based on machine learning. Journal of Shandong Commercial Vocational and Technical College, 01, 105-110.
[3]. Yang, B., Wang, Z., Cheng, Z., Zhao, H., Wang, X., & Guan, Y. (2023). Customer churn prediction based on data reconstruction generated by diffusion model. Journal of Computer Research and Development, 61(2), 324.
[4]. Yang, B., Li, H., Xing, Y., et al. (2024). Directed search based on improved whale optimization algorithm for test case prioritization. International Journal of Computers Communications & Control. https://www.univagora.ro/jour/index.php/ijccc/article/view/5049
[5]. Ying, W., Qin, Z., Zhao, Y., et al. (2007). Support vector machine and its application in customer churn prediction. Systems Engineering - Theory & Practice, 27(7), 105−110. (in Chinese)
[6]. Ahn, J., Hwang, J., Kim, D., et al. (2020). A survey on churn analysis in various business domains. IEEE Access, 8, 220816−220839.
[7]. Ji, J. (2022). Establishment and evaluation of distance education student churn prediction model based on deep learning. Journal of Beijing Institute of Industrial Technology, 03, 21-26.
[8]. Wu, Z., Jing, L., Wu, B., et al. (2022). A PCA-AdaBoost model for e-commerce customer churn prediction. Annals of Operations Research, 1−18.
[9]. Prokhorenkova, L., Gusev, G., Vorobev, A., et al. (2018). CatBoost: Unbiased boosting with categorical features. In Advances in Neural Information Processing Systems (Vol. 31, pp. 6638−6648). New York: Curran Associates.
[10]. Pekel, O. E., & Ozcan, T. (2022). A novel deep learning model based on convolutional neural networks for employee churn prediction. Journal of Forecasting, 41(3), 539−550.
Cite this article
Deng,E. (2024). Customer Churn Prediction Based on Multiple Linear Regression and Random Forest. Applied and Computational Engineering,112,22-28.
Data availability
The datasets used and/or analyzed during the current study will be available from the authors upon reasonable request.
Disclaimer/Publisher's Note
The statements, opinions and data contained in all publications are solely those of the individual author(s) and contributor(s) and not of EWA Publishing and/or the editor(s). EWA Publishing and/or the editor(s) disclaim responsibility for any injury to people or property resulting from any ideas, methods, instructions or products referred to in the content.
About volume
Volume title: Proceedings of the 5th International Conference on Signal Processing and Machine Learning
© 2024 by the author(s). Licensee EWA Publishing, Oxford, UK. This article is an open access article distributed under the terms and
conditions of the Creative Commons Attribution (CC BY) license. Authors who
publish this series agree to the following terms:
1. Authors retain copyright and grant the series right of first publication with the work simultaneously licensed under a Creative Commons
Attribution License that allows others to share the work with an acknowledgment of the work's authorship and initial publication in this
series.
2. Authors are able to enter into separate, additional contractual arrangements for the non-exclusive distribution of the series's published
version of the work (e.g., post it to an institutional repository or publish it in a book), with an acknowledgment of its initial
publication in this series.
3. Authors are permitted and encouraged to post their work online (e.g., in institutional repositories or on their website) prior to and
during the submission process, as it can lead to productive exchanges, as well as earlier and greater citation of published work (See
Open access policy for details).
References
[1]. Xue, X. (2023). Research on the influencing factors and countermeasures of corporate customer loyalty. Time-Honored Brand Marketing, 12, 132-134.
[2]. Cao, G., Yang, X., & Wang, R. (2024). Analysis of bank customer churn based on machine learning. Journal of Shandong Commercial Vocational and Technical College, 01, 105-110.
[3]. Yang, B., Wang, Z., Cheng, Z., Zhao, H., Wang, X., & Guan, Y. (2023). Customer churn prediction based on data reconstruction generated by diffusion model. Journal of Computer Research and Development, 61(2), 324.
[4]. Yang, B., Li, H., Xing, Y., et al. (2024). Directed search based on improved whale optimization algorithm for test case prioritization. International Journal of Computers Communications & Control. https://www.univagora.ro/jour/index.php/ijccc/article/view/5049
[5]. Ying, W., Qin, Z., Zhao, Y., et al. (2007). Support vector machine and its application in customer churn prediction. Systems Engineering - Theory & Practice, 27(7), 105−110. (in Chinese)
[6]. Ahn, J., Hwang, J., Kim, D., et al. (2020). A survey on churn analysis in various business domains. IEEE Access, 8, 220816−220839.
[7]. Ji, J. (2022). Establishment and evaluation of distance education student churn prediction model based on deep learning. Journal of Beijing Institute of Industrial Technology, 03, 21-26.
[8]. Wu, Z., Jing, L., Wu, B., et al. (2022). A PCA-AdaBoost model for e-commerce customer churn prediction. Annals of Operations Research, 1−18.
[9]. Prokhorenkova, L., Gusev, G., Vorobev, A., et al. (2018). CatBoost: Unbiased boosting with categorical features. In Advances in Neural Information Processing Systems (Vol. 31, pp. 6638−6648). New York: Curran Associates.
[10]. Pekel, O. E., & Ozcan, T. (2022). A novel deep learning model based on convolutional neural networks for employee churn prediction. Journal of Forecasting, 41(3), 539−550.