


1. Introduction
China has constructed the largest high-speed railway network in the world with the highest train speed of 350km/h. By 2022, the network has reached a total length of over 40,000 kilometers and undertakes more than 60 percent of the country’s railway passenger service. Such a massive and rapid-developing high-speed railway system leads to increased attention to its safety measurements. Due to the nature of high-speed and high-intensity train service, minor system malfunctions can cause significant accidents [1]. Therefore, the security measures of the system are of high strategic importance.
Turnouts, which have direct contact with railroad vehicles and allow a train to move from one track to another, are crucial to the safety of the high-speed railway system. Turnouts are prone to defects due to high operation frequencies, hostile environments, impacts from trains, and the inherent complexity of the equipment, and their faults can cause severe accidents including derails and train collisions [2]. Thus, the construction of an effective and acute turnout fault diagnosis system is vital to the safe operation of the high-speed railway network.
The current diagnosis of high-speed turnouts relies on experienced staff to visually examine the current and power curve provided by the monitoring system, which is laborious and frequently leads to missing reports and erroneous judgments due to the complexity and uncertainty of turnout malfunctions. Several methods have been studied to improve the efficiency and accuracy of fault diagnosis, including BPNN, Case-based reasoning, SVM, etc. [3-7]. These methods improve the intelligence and efficiency of the turnout fault diagnosis, reduce the level of effort required by the process, and thus cut down the operational and maintenance cost of turnouts. However, these methods still have certain drawbacks. For instance, neural networks require a huge amount of training samples to achieve a good performance model, while in Case-based reasoning, the generalization ability needs improvement. It remains a significant issue how to improve the intelligence and applicability of the algorithm so that the accumulated and real-time data can be fully utilized to provide a more sensitive and accurate diagnosis of the turnout faults.
In this paper, an intelligent turnout diagnosis algorithm based on group decision-making is proposed. By adopting three individual classifiers as experts, the algorithm conducts decision fusion in a ‘one-vote veto’ manner to improve the sensitivity and reliability of diagnosis models.
2. Methodology
As discussed above, a group decision making method is proposed based on three classification algorithms including K-Nearest Neighbour, Naïve Bayes, and Deep Neural Network. The detailed mechanisms of the three individual algorithms are shown below.
2.1. Knn
The k-nearest neighbors algorithm, or KNN, is a classification algorithm suitable for studies involving multiple classes. The k nearest neighbor training examples of the object are picked by the distance between the object and the examples, where K is generally a small positive integer [8]. The detailed process is listed below:
Suppose x and y are two different cases, then the distance between the two cases could be calculated as follows:
\( d(x,y)={(\sum _{i=1}^{n}{({x_{i}}-{y_{i}})^{2}})^{1/2}} \) (1)
Based on the above equation, the distances between the case to be diagnosed and history cases are calculated and K historical cases with the smallest distances are picked as the decision neighbors. The classification result is given by the case label which has a majority number among the decision neighbors.
2.2. Naive bayes classifier
Naïve Bayes classifier is a classification algorithm based on Bayes' theorem and the assumption that features are independent of each other [9]. Bayes’ theorem is given by:
\( P(A|B)= \frac{P(B|A)P( A)}{P(B)} \) (2)
Where P(B) 0.
In the naïve Bayes classifier, an object to be classified is represented by a vector X = (x1, x2, …xn), in which x1 to xn represent n features. The probability of the instance belongs to a category Ck is given by:
\( P({C_{k}}|X)= \frac{P(X|{C_{k}})P({C_{k}})}{P(X)} \) (3)
Following the naïve assumption that each of the features is independent, and as P(X) does not depend on the object, the above expression can be modified into:
\( P({C_{k}}|X)∝ P({C_{k}})\prod _{i=1}^{n}P({x_{ki}}|{C_{k}}) \) (4)
|
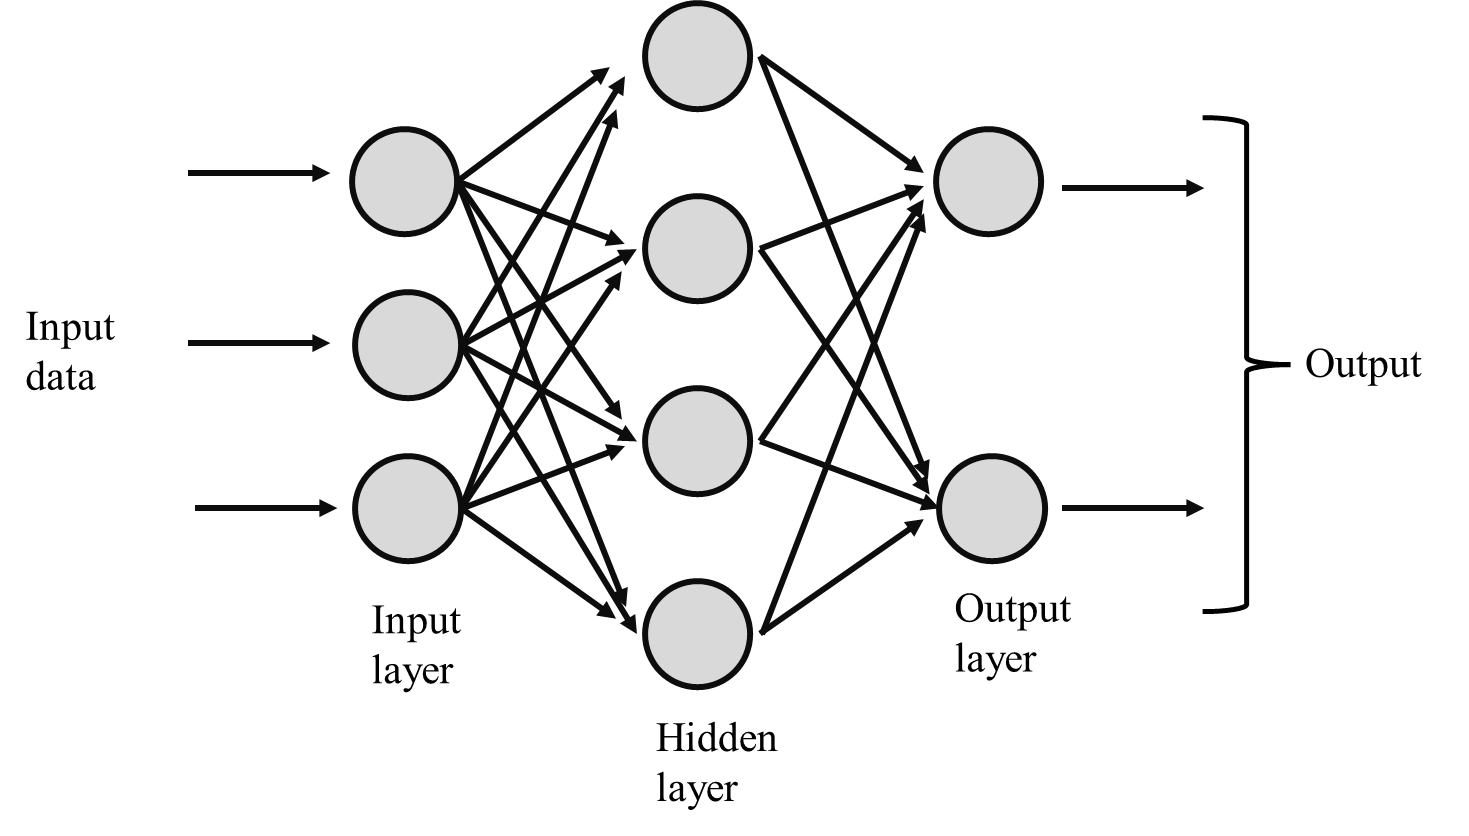
Figure 1. An example of the structure of DNN. |
The probability that the object belongs to each category is calculated, and the object is assigned to the class with the maximum probability, which is known as the maximum a posteriori (MAP) decision rule.
2.3. Deep neural network
Deep Neural Network (DNN) is a type of artificial neural network that can model intricate non-linear systems [10]. DNN consists of an input layer, an output layer, and one or several hidden layers between them. Each layer consists of multiple neurons, and each neuron, except those in the output layer, is connected to every neuron in the next layer, as shown in Figure 1. Each neuron in DNN consists of five parts: input (x_1, x_2, …, x_n |x_i∈R), weight w_i∈R, bias b∈R, active function, and output y=f(w*x+b).
The weights and biases need to be optimized through the training of the network to minimize the error between the output and the training dataset. The loss function, which evaluates the differences between the output and the training set, is given by:
\( Loss= {\sum _{i=1}^{n}({y_{i}}-(w{x_{i}}+b))^{2}} \) (5)
And Backpropagation (BP) is commonly used in DNN training to minimize the loss and determine proper weights and biases for the model.
2.4. Group decision making
This study introduces group decision making (GDM) to reduce the uncertainty of the individual fault diagnosis method and improve the accuracy and reliability of the diagnosis result. In the group decision making process, each of the diagnosis methods is regarded as an “expert”, and the final diagnosis result is proposed based on the output from multiple experts.
To guarantee the performance of the proposed model, the fusion method uses a ‘one-vote veto’ algorithm, which expression is shown below.
\( Case lable=\begin{cases} \begin{array}{c} normal, if all the experts classify the case as normal \\ failue, if any of the experts classies the case as failure \end{array} \end{cases} \) (6)
3. Experiment
The proposed Group decision making algorithm is discussed above. In this section, experiments are conducted with real-life turnout operation data to verify the effectiveness of the algorithm.
3.1. Data
The data used in the experiments are balanced fault data of turnouts’ single-phase current value versus time from real S700K turnouts. The dataset consists of 566 samples labeled as “normal” or “failure”. Each sample is padded with zero at the end so that they have the same length of 270 samples.
3.2. Experiment design
The experiment is divided into two main parts:
(1) Three classifiers, namely KNN, DNN, and naïve Bayes, are applied to the data separately.
(2) The group decision making algorithm uses these three classifiers with identical parameters as in part (1).
Each of the classifiers is regarded as an “expert”. To improve the recall performance of the algorithm and to minimize the missing report rate, the algorithm is configured in a “one-vote veto” way, i.e., the case will be classified as “failure” if any of the three experts determine the case as a failure.
In KNN, the number of neighbors K is set to 3. For DNN, a neuron network with 2 hidden layers is constructed, each with 136 neurons and Rectified Linear Unit (ReLU) as the active function. The output layer of the network consists of 2 neurons with active function as SoftMax and loss function as MEXENT.
5-fold cross-validation is applied in both experiments to optimize the classifiers by randomly dividing the dataset into 5 equal subsets, and using 4 sets for training and the remaining set for testing on a rolling basis.
3.3. Evaluation index
The experiment uses three indices, namely accuracy, selectivity, and recall, to evaluate the overall performance of the algorithms. They are given by:
\( Accracy= \frac{TP+TN}{TP+FP+TN+FN} \) (7)
\( Selectivity= \frac{TN}{TN+FP} \) (8)
\( Recall= \frac{TP}{TP+FN} \) (9)
Where:
TP refers to the count of failure cases correctly classified as failure;
TN refers to the count of normal cases correctly classified as normal;
FP refers to the count of normal cases falsely classified as failure;
FN refers to the count of failure cases falsely classified as normal.
As the turnouts are safety-critical to railway operations, it is vital to improve the sensibility of the diagnosis algorithm to reduce the probability of missing any malfunction. Thus, recall is of the greatest importance among the three evaluation criteria.
|
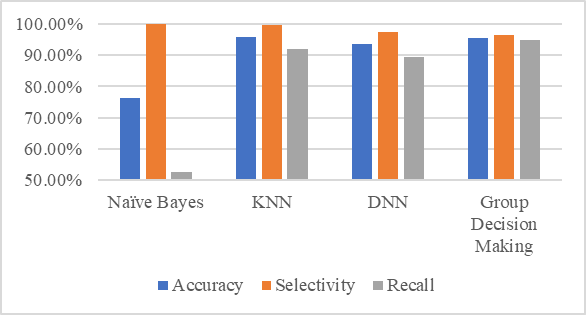
Figure 2. The performance of the three individual classifiers and group decision making algorithms. |
3.4. Result and analysis
Table. 1. Shows the Comparison results of accuracy, selectivity, and recall of the three individual classifiers and group decision making.
As shown in Table 1 and Figure 2, the Accuracy of KNN is 95.76%, which is the highest among the four classifiers, with the accuracy of Group Decision Making following closely, reaching 95.58%. The accuracy of the Naïve Bayes classifier is significantly lower than others, with only 76.33%. The selectivity of Group Decision Making is the lowest, yet still greater than 96%.
On the other hand, the recall of the Group Decision Making reaches 94.70%, which is the highest among all classifiers. Overall, the Group Decision Making has advantages in detecting the turnout faults compared to the three individual classifiers without sacrificing much accuracy performance.
The above outcomes verify that the group decision making algorithm can utilize the advantages of different experts and propose a better model, which can improve the robustness and the generalization ability of the diagnosis results.
4. Conclusion
The use of sections to divide the text of the paper is optional and left as a decision for the author. Where the author wishes to divide the paper into sections the formatting shown in table 2 should be used.
In this paper, a turnout fault diagnosis algorithm based on group decision making process is proposed to improve the diagnosis accuracy and reduce the missing report rate. This algorithm groups three classifiers, namely KNN, Naïve Bayes, and DNN, and assembles the classification results in a “one-vote veto” manner, i.e., the turnout will be diagnosed as faulted when any of the three classifiers determines there is a failure. This algorithm takes the turnout operation current versus time data streams as input. In the experiment, the accuracy, selectivity, and recall of the group decision making algorithm are determined and compared with the three individual classifiers, with 5-fold cross-validation applied to reduce error. The result demonstrates that the group decision making classifier has significant advantages in recall over the individual classifiers without a sensible dropping in the overall accuracy. It is expected that the group decision making algorithm can be applied in real-life applications to ease the pressure in the turnout fault diagnosis process as well as reduce the missing report rate.
References
[1]. V Havryliuk 2021 Fault detecting of turnouts using DWT and ANN 2021 IEEE International Conference on Modern Electrical and Energy Systems (MEES)
[2]. C Tastimur, O Yaman, M Karakose and E Akin 2017 A real time interface fr vision inspection of rail components and surface in railways 2017 International Artificial Intelligence and Data Processing Symposium (IDAP) p 1-6
[3]. P Zhang, G Zhang, W Dong, X Sun and X. Ji 2018 Fault Diagnosis of High-Speed Railway Turnout Based on Convolutional Neural Network 2018 24th International Conference on Automation and Computing (ICAC) p 1-6
[4]. C Guangwu and L Rong 2021 Method of turnout fault diagnosis based on DBN-BiLSTM Model 2021 CAA Symposium on Fault Detection, Supervision, and Safety for Technical Processes (SAFEPROCESS) p 1-6
[5]. H Zhao, H Chen, W Dong, X Sun and Y Ji 2017 Fault diagnosis of rail turnout system based on case-based reasoning with compound distance methods 2017 29th Chinese Control And Decision Conference (CCDC) p 4205-10
[6]. Y Zhang, X Deng and Y Huang 2021 Research on railroad turnout fault diagnosis based on support vector machine 2021 7th International Symposium on Mechatronics and Industrial Informatics (ISMII) p 119-22
[7]. J Zhang, Y Zhu, W Shi, G Sheng and Y Chen 2015 An improved machine learning scheme for data-driven fault diagnosis of power grid equipment 2015 IEEE 17th International Conference on High Performance Computing and Communications, 2015 IEEE 7th International Symposium on Cyberspace Safety and Security, and 2015 IEEE 12th International Conference on Embedded Software and Systems p 1737-42
[8]. T Cover and P Hart Nearest neighbor pattern classification 1967 IEEE Transactions on Information Theory vol. 13, no. 1 p 21-7
[9]. M M Saritas 2019 Performance analysis of ANN and naive Bayes classification algorithm for data classification International Journal of Intelligent Systems and Applications in Engineering vol. 7, no. 2 p 88–91
[10]. G Montavon, W Samek, and K-R Müller 2018 Methods for interpreting and understanding deep neural networks Digital Signal Processing 73 p 1–15
Cite this article
Wang,B. (2023). Research on turnout system diagnosis based on group decision making. Applied and Computational Engineering,6,409-414.
Data availability
The datasets used and/or analyzed during the current study will be available from the authors upon reasonable request.
Disclaimer/Publisher's Note
The statements, opinions and data contained in all publications are solely those of the individual author(s) and contributor(s) and not of EWA Publishing and/or the editor(s). EWA Publishing and/or the editor(s) disclaim responsibility for any injury to people or property resulting from any ideas, methods, instructions or products referred to in the content.
About volume
Volume title: Proceedings of the 3rd International Conference on Signal Processing and Machine Learning
© 2024 by the author(s). Licensee EWA Publishing, Oxford, UK. This article is an open access article distributed under the terms and
conditions of the Creative Commons Attribution (CC BY) license. Authors who
publish this series agree to the following terms:
1. Authors retain copyright and grant the series right of first publication with the work simultaneously licensed under a Creative Commons
Attribution License that allows others to share the work with an acknowledgment of the work's authorship and initial publication in this
series.
2. Authors are able to enter into separate, additional contractual arrangements for the non-exclusive distribution of the series's published
version of the work (e.g., post it to an institutional repository or publish it in a book), with an acknowledgment of its initial
publication in this series.
3. Authors are permitted and encouraged to post their work online (e.g., in institutional repositories or on their website) prior to and
during the submission process, as it can lead to productive exchanges, as well as earlier and greater citation of published work (See
Open access policy for details).
References
[1]. V Havryliuk 2021 Fault detecting of turnouts using DWT and ANN 2021 IEEE International Conference on Modern Electrical and Energy Systems (MEES)
[2]. C Tastimur, O Yaman, M Karakose and E Akin 2017 A real time interface fr vision inspection of rail components and surface in railways 2017 International Artificial Intelligence and Data Processing Symposium (IDAP) p 1-6
[3]. P Zhang, G Zhang, W Dong, X Sun and X. Ji 2018 Fault Diagnosis of High-Speed Railway Turnout Based on Convolutional Neural Network 2018 24th International Conference on Automation and Computing (ICAC) p 1-6
[4]. C Guangwu and L Rong 2021 Method of turnout fault diagnosis based on DBN-BiLSTM Model 2021 CAA Symposium on Fault Detection, Supervision, and Safety for Technical Processes (SAFEPROCESS) p 1-6
[5]. H Zhao, H Chen, W Dong, X Sun and Y Ji 2017 Fault diagnosis of rail turnout system based on case-based reasoning with compound distance methods 2017 29th Chinese Control And Decision Conference (CCDC) p 4205-10
[6]. Y Zhang, X Deng and Y Huang 2021 Research on railroad turnout fault diagnosis based on support vector machine 2021 7th International Symposium on Mechatronics and Industrial Informatics (ISMII) p 119-22
[7]. J Zhang, Y Zhu, W Shi, G Sheng and Y Chen 2015 An improved machine learning scheme for data-driven fault diagnosis of power grid equipment 2015 IEEE 17th International Conference on High Performance Computing and Communications, 2015 IEEE 7th International Symposium on Cyberspace Safety and Security, and 2015 IEEE 12th International Conference on Embedded Software and Systems p 1737-42
[8]. T Cover and P Hart Nearest neighbor pattern classification 1967 IEEE Transactions on Information Theory vol. 13, no. 1 p 21-7
[9]. M M Saritas 2019 Performance analysis of ANN and naive Bayes classification algorithm for data classification International Journal of Intelligent Systems and Applications in Engineering vol. 7, no. 2 p 88–91
[10]. G Montavon, W Samek, and K-R Müller 2018 Methods for interpreting and understanding deep neural networks Digital Signal Processing 73 p 1–15