


1. Introduction
1.1. Overview of ultraviolet-visible spectrophotometry
In an era marked by rapid scientific and technological advancements, the prominence of biopharmaceuticals and chemical analysis has experienced a significant surge. This is particularly due to the fact that the majority of pharmaceutical compounds demonstrate absorption characteristics within the ultraviolet to visible light spectrum. Consequently, UV-visible spectrophotometers have emerged as indispensable analytical tools in the realms of chemistry, biology, and pharmaceutical research [1]. When light interacts with a sample, it undergoes a series of transformations. A portion of the light is absorbed by the sample, which corresponds to the energy levels of the molecules within it, while the remaining light is transmitted through the material. This phenomenon is the basis of UV-visible spectrophotometry, a powerful analytical technique. By meticulously measuring the intensity of the light that passes through the sample, scientists can determine the concentration of the substance with high precision. This method relies on the Beer-Lambert law, which relates the absorbance of light to the concentration of the absorbing species.UV-visible spectrophotometers are indispensable tools in analytical chemistry, offering a wide range of applications. They are used to analyze the structure and purity of various compounds, providing insights into their molecular composition. In the field of molecular biology, these instruments are crucial for the quantification of nucleic acids, such as DNA and RNA, which is essential for gene expression studies and diagnostics. They also play a significant role in protein quantification, allowing researchers to measure protein concentration in samples, which is vital for enzyme kinetics and other biochemical assays.Furthermore, UV-visible spectrophotometry is employed in the quantitative testing of bacterial growth concentration, enabling microbiologists to monitor the proliferation of bacteria in cultures over time. This information is critical for understanding microbial dynamics and optimizing growth conditions. The detection of antibiotic content in samples is another important application, where the technique helps in assessing the effectiveness of antibiotics and in the development of new antimicrobial agents [3-4]. The role of UV-visible spectrophotometers in analytical chemistry is multifaceted and essential. They not only facilitate a deeper understanding of chemical compounds and biological molecules but also contribute to the development and quality control of pharmaceuticals. As technology continues to evolve, the capabilities of these spectrophotometers are likely to expand, further solidifying their position as a cornerstone in scientific research and pharmaceutical development.
1.2. The importance of pharmaceutical analysis
Pharmaceutical analysis is a pivotal discipline dedicated to the investigation and enhancement of quality control methodologies throughout the entire drug development lifecycle, spanning from research and development to manufacturing processes [5]. Its core goal is to conduct in-depth analysis of drugs, elucidate their quality characteristics, and establish scientific and reasonable quality control standards and methods to ensure that the quality and safety of drugs are effectively controlled [6].
Within the pharmaceutical industry, pharmaceutical analysis serves not only as a critical component in safeguarding drug quality but also a significant catalyst to promote drug research and development and medical technology progress. As science and technology advance and the demand for a healthy lifestyle grows, the importance of pharmaceutical analysis within the pharmaceutical sector is becoming increasingly pronounced [7-8].
2. The basic principle of UV visible spectrophotometry
2.1. Properties of light and spectrophotometry
2.1.1. Propagation and absorption of light
Light embodies wave-particle duality, meaning it exhibits both wave-like properties and particle-like behavior. The boundary of spectrum extends from approximately 310 nanometers in ultraviolet light to approximately 1100 nanometers in near-infrared light [9]. Natural light consists of various electromagnetic waves that manifest at distinct frequencies and wavelengths. These characteristics of light have been extensively studied and play a crucial role in numerous fields. Among them, spectrophotometry is a well-known example in light applications, which determines the content of a certain component in a sample by measuring the intensity changes of light emitted by a light source at different wavelengths [10]. Typically, the spectrophotometric method usually uses visible light and ultraviolet light as light sources, with visible light having a wavelength between 380 nanometers and 760 nanometers, while ultraviolet light has a wavelength between 200 nanometers and 400 nanometers. The utilization of monochromatic light in this method confers an exceptionally high level of detection sensitivity. In contrast to conventional chemical analysis methods, the analysis process of spectrophotometry is faster, which enables it to efficiently and quickly analyze a large number of samples.
2.1.2. Beer Lambert's law
The Bill Lambert law is the cornerstone of the field of spectroscopy and is crucial for qualitative and quantitative analysis of spectral data [11]. Under fixed optical path conditions, the absorbance of a substance is proportional to the product of its concentration. This relationship can be expressed concisely through mathematical formulas as: A=ε bc, where A represents absorbance and ε is the molar absorptivity. B represents the optical path length, and c represents the solution concentration. Profoundly mastering and applying this law is of great significance for quantitative analysis in analytical chemistry.
The Beer Lambert law is widely applied in various fields. It not only plays a role in optical tissue diagnosis, but is also used to measure the absorbance of biomolecules to evaluate their concentration and purity. In addition, this law also involves the measurement of pulsatile blood flow, critical closure pressure, and increased intracranial pressure [12], providing valuable quantitative tools for medical and scientific research.
2.2. Instruments and equipment
2.2.1. Construction of spectrophotometer
A spectrophotometer is a precision scientific instrument used to measure the degree of absorption of a substance by specific wavelengths of light [13]. The construction of this instrument usually includes the following main parts:

Figure 1: Basic structure of spectrophotometer
Table 1: Structure and function of spectrophotometer
Structure | Function |
Light | There are two types of devices that provide incident light that meets the requirements: thermal radiation light sources and gas discharge light sources. |
Monochromator | Decompose the composite light generated by the light source into monochromatic light and separate the required monochromatic beam, which is the heart part of the spectrophotometer. |
Absorption tank | Also known as a colorimetric dish, it is used to measure the absorbance of the test solution. Its bottom and two sides are frosted glass, and the other two sides are optical transparent surfaces. To reduce light reflection loss, the optical surface of the absorption cell must be completely perpendicular to the direction of the light beam. |
Detector | A device that converts optical signals into electrical signals. When measuring absorbance, it does not directly measure the intensity of light passing through the absorption cell, but converts the intensity of light into an electrical signal for testing. This type of photoelectric conversion device is called a detector. |
Monitor | The device that amplifies the signal output by the detector and displays it. |
These components work together to enable the spectrophotometer to accurately measure the absorption of specific wavelengths of light by the sample for quantitative and qualitative analysis. Different types of spectrophotometers (such as UV visible spectrophotometers, infrared spectrophotometers, etc.) may have different construction details, but the basic principles are similar [14].
2.2.2. Sample processing and measurement
To prepare a spectrophotometer sample, it is essential to begin with a suitable specimen that is homogeneous and free from contaminants. Next, prepare the appropriate medium, dissolve and filter to remove any particulates. Additionally, prepare a standard solution to construct a calibration curve [15]. Preparation before measurement: Confirm that the spectrophotometer is in normal working condition for calibration to ensure measurement accuracy. Measure the sample according to the established steps and record the measurement values. Finally, analyze the measurement results and calculate the sample concentration [16].
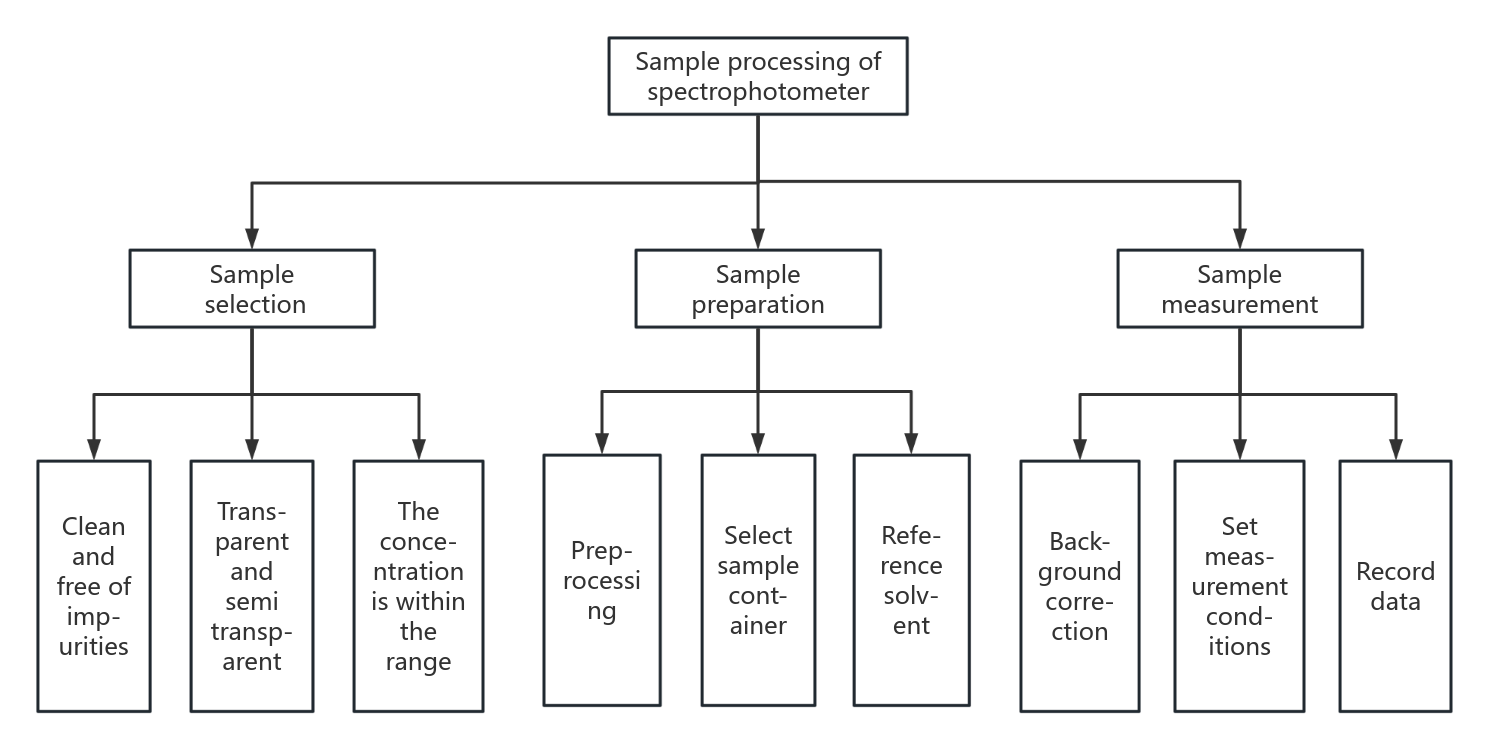
Figure 2: Processing of spectrophotometer samples
3. Application of UV visible spectrophotometry in drug analysis
3.1. Qualitative analysis of drugs
The qualitative analysis of pharmaceuticals is fundamental to both drug development and quality control processes. UV-visible spectrophotometry provides an efficient method for qualitative analysis of drugs by accurately measuring the absorbance of drugs at specific wavelengths. In practical applications, we can determine the presence and purity of drugs based on their UV absorption spectrum characteristics. During the initial phases of new drug development, UV visible spectrophotometry can be used to screen potential candidate drugs. By comparing the absorption spectra of different drugs, it is possible to preliminarily determine whether their chemical structures have therapeutic effects, such as detecting protein structures from UV absorbance spectra [17]. Furthermore, this technique enables the analysis of bioactive compounds within extracts and the evaluation of their biological activities [18]. The analysis of phytochemicals is performed using UV-Vis spectrophotometry and FTIR spectroscopy. Ethanol extracts from bark and leaves show higher phenolic content compared to other plant parts, with the bark having the most flavonoids [19]. Molecularly imprinted polymers synthesized as nanoadsorbents are used in magnetic microsolid phase extraction and UV-Vis spectrophotometric determination of valsartan in biological samples, with studies on isotherm, kinetics, and thermodynamics [20] After derivatization of neurotransmitters, UV-Vis spectrophotometry at 265 nm in the UV region shows maximum absorption. This method offers excellent linearity and reliability, with a coefficient of variation under 15% and a correlation coefficient near 1.0, indicating low experimental dispersion and high regression coefficient certainty. UV spectrophotometry provides selectivity, linearity, precision, specificity, stability, and accuracy for glutamate quantification in CSF. It is quick, efficient, easy, and cost-effective. Comparing HPLC and spectrophotometry results, the UV-Vis method closely matches glutamate release values, proving accurate, reproducible, and satisfactory for amino acid glutamate determination in CSF [21]
3.2. Identification of drugs
UV-visible spectrophotometry holds significant value in drug identification. Each drug has its unique ultraviolet absorption spectrum characteristics. By comparing the absorption curves of the sample and the standard in the ultraviolet region, it is possible to determine whether the structure of the drug matches the standard. In addition, by utilizing the fluorescence characteristics of drugs, the application of fluorescence spectrophotometry has further expanded the scope of drug identification and increased the accuracy of identification.UV-Vis spectrophotometry is applied in the analysis of wild edible Boletus edulis for species identification, source and storage assessment, fraud detection, and antioxidant property evaluation, offering insights into the use and limitations of spectroscopic techniques for future research and practical applications of this mushroom [22]. This method is also used to monitor absorbance spectral wavelengths for detecting chromophores in compounds, providing spectral information on complex conjugated systems in mixtures. With chemometric tools, it can visualize large UV-Vis datasets in food samples, making it an advanced analytical tool for food and dietary supplement quality control [23]. Gallic acid and its metal complexes are potent antioxidants that boost the immune system and combat degenerative and viral diseases, suggesting their potential as complementary drugs and significance in clinical trials [24]. In this study, differential pulse voltammetry, UV-Vis spectrophotometry, and potentiometry were employed to analyze the complexation of gallic acid with calcium.
3.3. Impurity detection
The presence of impurities can significantly compromise the safety and efficacy of pharmaceuticals. UV-visible spectrophotometry has shown significant advantages in impurity detection. By determining the maximum absorption wavelength of impurities in drugs, this technique facilitates the qualitative identification of impurities. At the same time, combined with the standard curve method, quantitative analysis of impurity content in drugs can be achieved, selected samples can be separated, and the main low monomer products can be identified[25]. To further enhance the sensitivity and selectivity of impurity detection, the detection process can be optimized by adjusting the experimental conditions. For instance, by modifying parameters such as solvent system, pH value, or temperature, the absorption signal of specific impurities can be enhanced, thereby increasing the precision of the detection process.Spectral interference from pollutants poses a significant challenge in applying UV/Vis spectrophotometry for concentration determination, as minor amounts of specific pollutants can lead to substantial quantification errors due to differences in molar absorptivity. Airin Antony has developed an enhanced Lorentz equation that not only detects and mitigates errors from unknown pollutants but also identifies severe impurities, significantly reducing concentration determination errors even in the presence of multiple unknown interferents[26]. Mona A Abdel Rahman has proposed and validated three chemometric-assisted spectrophotometric models—Partial Least Squares (PLS), Artificial Neural Networks (ANN), and Multivariate Curve Resolution Alternating Least Squares (MCR-ALS)—to resolve overlapping spectra of etoposide (ETO) and paracetamol (PCM), along with PCM impurities Paraaminophenol (PAP) and P-hydroxyphenylethanone (PHA). These models successfully analyzed the mixture of ETO and PCM, as well as PCM impurities, simultaneously, offering a separation-free technique for drug formulation analysis. The results were comparable to published chemometric models and reported HPLC methods, showing no significant differences [27]. MF Ergin has developed a rapid, simple, and specific UV spectrophotometric method for determining 4-HPG and 6-APA, impurities in amoxicillin production, using minimal chemicals to reduce environmental and health impacts. This green approach involves using different concentrations of NaOH as solvents and measuring the UV spectra of 4-HPG and 6-APA between 210 and 400 nm. The study detailed the UV spectrum of 4-HPG in three regions and confirmed the reaction of 6-APA with varying NaOH concentrations, observing a peak shift from 222 nm to 227 nm. This research aims to control and determine impurities without harmful organic solvents or chemicals [28].
3.4. Quantitative analysis of drugs
UV-visible spectrophotometry has a wide range of applications in quantitative analysis and content determination of drugs. This method can accurately determine the drug content by measuring the absorbance of the drug at a specific wavelength and combining it with the standard curve method. For mixtures containing multiple components, UV-Vis assay facilitates the direct quantification of drug content, obviating the need for intricate chemical reactions or sophisticated instrumentation. This is exemplified by its application in detecting and Guo's research team has developed an innovative colorimetric method using UV/Vis CM to detect and quantify total triterpenoids in traditional Chinese medicine. This method enhances sensitivity and accuracy by adding 2-hydroxy-5-methylbenzaldehyde and concentrated sulfuric acid, turning triterpenoids' color development more sensitive. Its accuracy was confirmed against HPLC and four other colorimetric methods. The method boasts advantages such as no heating required, high sensitivity, short operation time, low solvent use, and low equipment costs [29]. Andrew S Law's team has created a phosphate buffer-free UPLC method for simultaneous adenine nucleotide analysis using UV-Vis spectrophotometry and mass spectrometry (MS). The Acquity HSS T3 premium column with a volatile ammonium acetate buffer successfully separated and quantified ATP-related analytes in standard mixtures and mouse hind limb muscle extracts, allowing for reliable adenine nucleotide quantification and identification of unknown peaks through MS [30]. An analytical quality design principle was applied to predict piroxicam concentration in Kollidon VA 64 during hot melt extrusion. An analytical target spectrum for piroxicam content was established, and an online analysis program was developed using a UV-Vis absorbance spectrum-based prediction model. Online UV-Vis spectroscopy has proven to be a powerful and practical PAT tool for monitoring piroxicam content, a key quality attribute in pharmaceutical HME processes [31]. The strengths of UV-visible spectrophotometry lie in its straightforward, swift response, affordability, and the absence of requirements for complex chemical pre-treatment or costly equipment. These characteristics make it an ideal choice for large-scale drug content determination.
4. Conclusion and prospect
4.1. Research summary
UV visible spectrophotometry has a wide range of application value in the field of pharmaceutical analysis. As a simple, rapid, and reliable chemical analysis method, it provides solid technical support for drug development, production, and quality control. Through this method, the quality and safety of drugs can be effectively ensured, providing a solid guarantee for public health.
Although UV visible spectrophotometry is widely used, it has also encountered some challenges in practical operation. For example, the low absorbance of certain drugs may affect the accuracy of the measurement; At specific wavelengths, the absorbance of certain drugs may be affected by interference from other components; In addition, for complex drug systems, a single UV visible spectrophotometry method may not fully meet the analytical requirements. Therefore, in order to overcome these challenges, it may be necessary to combine other analytical techniques to improve the accuracy and reliability of the analysis.
4.2. Future outlook
UV visible spectrophotometry not only plays an important role in drug analysis, but also as a multifunctional analytical technique, its application range spans across multiple fields such as chemistry, biology, and environment, demonstrating its profound application value. For example, it serves as an advanced analytical tool for quality control of food and dietary supplements [32]; In the field of environmental monitoring, UV visible spectrophotometry is widely used for water quality detection, helping to monitor and protect our natural environment; In the industrial field, this technology is used to monitor chemical reactions in the production process in real-time, ensuring the stability and reliability of product quality. It plays an important role in biomedical, food industry, environmental monitoring, and industrial analysis fields, providing strong support for scientific research, production practice, and environmental protection.
Although UV visible spectrophotometry plays an important role in multiple fields, there are still some limitations to this technology that require continuous improvement to enhance its accuracy and applicability. To optimize the selection of light sources, it is possible to reduce the impact of light source fluctuations on experimental results by using more stable and accurate light sources, such as quartz bulbs. You can try using multi wavelength light sources to better capture the light absorption characteristics in different wavelength bands. At the same time, by combining other analytical methods, the accuracy and precision of drug analysis can be further improved, providing more reliable technical support for drug development and production. For example, based on SPME/GC-MS, NMR, and UV Vis analysis platforms, the first metabolomics comparative study was conducted on 9 cinnamon drugs and their different commercial formulations, targeting their metabolomics [33].
In summary, through in-depth research and continuous optimization of UV visible spectrophotometry, not only can its accuracy and applicability in drug analysis be significantly improved, but it can also meet the demand for high-precision analysis technology in modern scientific research. This continuous technological progress and innovation will open up new possibilities for future scientific research and industrial applications.
References
[1]. Chen Y. Drug-to-antibody ratio (DAR) by UV/Vis spectroscopy. Methods Mol Biol. 2013;1045:267-73.
[2]. Wamsley M, Zou S, Zhang D. Advancing Evidence-Based Data Interpretation in UV-Vis and Fluorescence Analysis for Nanomaterials: An Analytical Chemistry Perspective. Anal Chem. 2023 Dec 5;95(48):17426-17437.
[3]. Saha S, Singh J, Paul A, Sarkar R, Khan Z, Banerjee K. Anthocyanin Profiling Using UV-Vis Spectroscopy and Liquid Chromatography Mass Spectrometry. J AOAC Int. 2020 Jan 1;103(1):23-39.
[4]. Dankowska A, Kowalewski W. Tea types classification with data fusion of UV-Vis, synchronous fluorescence and NIR spectroscopies and chemometric analysis. Spectrochim Acta A Mol Biomol Spectrosc. 2019 Mar 15;211:195-202
[5]. Scriba G, Wätzig H. Pharmaceutical Analysis. Electrophoresis. 2018 Oct;39(20):2491.
[6]. Saha M, Dhiman S, Gupta GD, Asati V. An Investigative Review for Pharmaceutical Analysis of Fenofibrate. J Chromatogr Sci. 2023 May 30;61(5):494-504.
[7]. Østergaard J. UV imaging in pharmaceutical analysis. J Pharm Biomed Anal. 2018 Jan 5;147:140-148.
[8]. Biancolillo A, Marini F. Chemometric Methods for Spectroscopy-Based Pharmaceutical Analysis. Front Chem. 2018 Nov 21;6:576.
[9]. Biancolillo A, Marini F. Chemometric Methods for Spectroscopy-Based Pharmaceutical Analysis. Front Chem. 2018 Nov 21;6:576.
[10]. Jägerbrand AK, Spoelstra K. Effects of anthropogenic light on species and ecosystems. Science. 2023 Jun 16;380(6650).
[11]. Shi Z, Chow CWK, Fabris R, Liu J, Jin B. Applications of Online UV-Vis Spectrophotometer for Drinking Water Quality Monitoring and Process Control: A Review. Sensors (Basel). 2022 Apr 13;22(8).
[12]. Mayerhöfer TG, Pahlow S, Popp J. The Bouguer-Beer-Lambert Law: Shining Light on the Obscure. Chemphyschem. 2020 Sep 15;21(18):2029-2046.
[13]. Oshina I, Spigulis J. Beer-Lambert law for optical tissue diagnostics: current state of the art and the main limitations. J Biomed Opt. 2021 Oct;26(10).
[14]. Baker WB, Forti RM, Heye P, et al. Modified Beer-Lambert algorithm to measure pulsatile blood flow, critical closing pressure, and intracranial hypertension. Biomed Opt Express. 2024;15(9).
[15]. Advances on Water Quality Detection by UV-Vis Spectroscopy. Appl. Sci. 2020;10:6874.
[16]. Kusumiyati K, Putri IE. Comparison of color spectrophotometer and Vis/NIR spectroscopy on assessing natural pigments of cucumber applied with different ethephon concentrations. Heliyon. 2023 Nov 21;9(12).
[17]. Harada T, Manabe K. Chiroptical spectrophotometer and analytical method for optically anisotropic samples. Rev Sci Instrum. 2020 Dec 1;91(12).
[18]. Biter AB, Pollet J, Chen WH, Strych U, Hotez PJ, Bottazzi ME. A method to probe protein structure from UV absorbance spectra. Anal Biochem. 2019 Dec 15;587:113450.
[19]. Patle TK, Shrivas K, Kurrey R, Upadhyay S, Jangde R, Chauhan R. Phytochemical screening and determination of phenolics and flavonoids in Dillenia pentagyna using UV-vis and FTIR spectroscopy. Spectrochim Acta A Mol Biomol Spectrosc. 2020 Dec 5;242:118717.
[20]. Azizi-Khereshki N, Mousavi HZ, Dogaheh MG, Farsadrooh M, Alizadeh N, Mohammadi A. Synthesis of molecularly imprinted polymer as a nanosorbent for dispersive magnetic micro solid-phase extraction and determination of valsartan in biological samples by UV-Vis Spectrophotometry: Isotherm, kinetics, and thermodynamic studies. Spectrochim Acta A Mol Biomol Spectrosc. 2023 Aug 5;296:122656.
[21]. Ferreira CP, Techera Antunes FT, Rebelo IN, da Silva CA Junior, Vilanova FN, Corrêa DS, de Souza AH. Application of the UV-vis spectrophotometry method for the determination of glutamate in the cerebrospinal fluid of rats. J Pharm Biomed Anal. 2020 Jul 15;186:113290.
[22]. Chen J, Li JQ, Li T, Liu HG, Wang YZ. Application of UV-Vis and Infrared Spectroscopy on Wild Edible Bolete Mushrooms Discrimination and Evaluation: A Review. Crit Rev Anal Chem. 2023;53(4):852-868.
[23]. Farag MA, Sheashea M, Zhao C, Maamoun AA. UV Fingerprinting Approaches for Quality Control Analyses of Food and Functional Food Coupled to Chemometrics: A Comprehensive Analysis of Novel Trends and Applications. Foods. 2022 Sep 16;11(18):2867.
[24]. Goman D, Stanković A, Galović O, Džakula BN, Kontrec J, Medvidović-Kosanović M. Complexation of gallic acid with calcium: electrochemical, potentiometric, and UV-VIS studies. Anal Methods. 2024 Jan 18;16(3):391-395.
[25]. De Saegher T, Vercammen J, Atanasova B, Van Geem KM, De Clercq J, Verberckmoes A, Lauwaert J. Efficient mapping of lignin depolymerization product pools and quantification of specific monomers through rapid GPC-HPLC-UV/VIS analysis. Anal Chim Acta. 2023 Oct 16;1278:341738
[26]. Antony A, Mitra J. Refractive index-assisted UV/Vis spectrophotometry to overcome spectral interference by impurities. Anal Chim Acta. 2021 Mar 8;1149:238186
[27]. Rahman MAA, Elghobashy MR, Zaazaa HE, El-Mosallamy SS. Novel analytical method based on chemometric models applied to UV-Vis spectrophotometric data for simultaneous determination of Etoricoxib and Paracetamol in presence of Paracetamol impurities. BMC Chem. 2023 Dec 7;17(1):176. doi: 10.1186/s13065-023-01095-x. PMID: 38062520; PMCID: PMC10702036.
[28]. Ergin MF, Yasa H. Determination of amoxicillin trihydrate impurities 4-hydroxyphenylglycine (4-HPG) and 6-Aminopenicylanic acid (6-APA) by means of ultraviolet spectroscopy. Methods Appl Fluoresc. 2022 May 25;10(3).
[29]. Guo Y, Han Z, Zhang J, Lu Y, Li C, Liu G. Development of a high-speed and ultrasensitive UV/Vis-CM for detecting total triterpenes in traditional Chinese medicine and its application. Heliyon. 2024 May 31;10(11):e32239.
[30]. Law AS, Hafen PS, Brault JJ. Liquid chromatography method for simultaneous quantification of ATP and its degradation products compatible with both UV-Vis and mass spectrometry. J Chromatogr B Analyt Technol Biomed Life Sci. 2022 Aug 15;1206:123351.
[31]. Almeida J, Bezerra M, Markl D, Berghaus A, Borman P, Schlindwein W. Development and Validation of an In-Line API Quantification Method Using AQbD Principles Based on UV-Vis Spectroscopy to Monitor and Optimise Continuous Hot Melt Extrusion Process. Pharmaceutics. 2020 Feb 12;12(2):150.
[32]. Farag MA, Sheashea M, Zhao C, Maamoun AA. UV Fingerprinting Approaches for Quality Control Analyses of Food and Functional Food Coupled to Chemometrics: A Comprehensive Analysis of Novel Trends and Applications. Foods. 2022 Sep 16;11(18):2867.
[33]. Farag MA, Khaled SE, El Gingeehy Z, Shamma SN, Zayed A. Comparative Metabolite Profiling and Fingerprinting of Medicinal Cinnamon Bark and Its Commercial Preparations via a Multiplex Approach of GC-MS, UV, and NMR Techniques. Metabolites. 2022 Jul 1;12(7):614.
Cite this article
Liu,M. (2025). The Application of Ultraviolet-Visible Spectrophotometry in Pharmaceutical Analysis. Applied and Computational Engineering,159,85-92.
Data availability
The datasets used and/or analyzed during the current study will be available from the authors upon reasonable request.
Disclaimer/Publisher's Note
The statements, opinions and data contained in all publications are solely those of the individual author(s) and contributor(s) and not of EWA Publishing and/or the editor(s). EWA Publishing and/or the editor(s) disclaim responsibility for any injury to people or property resulting from any ideas, methods, instructions or products referred to in the content.
About volume
Volume title: Proceedings of the 5th International Conference on Materials Chemistry and Environmental Engineering
© 2024 by the author(s). Licensee EWA Publishing, Oxford, UK. This article is an open access article distributed under the terms and
conditions of the Creative Commons Attribution (CC BY) license. Authors who
publish this series agree to the following terms:
1. Authors retain copyright and grant the series right of first publication with the work simultaneously licensed under a Creative Commons
Attribution License that allows others to share the work with an acknowledgment of the work's authorship and initial publication in this
series.
2. Authors are able to enter into separate, additional contractual arrangements for the non-exclusive distribution of the series's published
version of the work (e.g., post it to an institutional repository or publish it in a book), with an acknowledgment of its initial
publication in this series.
3. Authors are permitted and encouraged to post their work online (e.g., in institutional repositories or on their website) prior to and
during the submission process, as it can lead to productive exchanges, as well as earlier and greater citation of published work (See
Open access policy for details).
References
[1]. Chen Y. Drug-to-antibody ratio (DAR) by UV/Vis spectroscopy. Methods Mol Biol. 2013;1045:267-73.
[2]. Wamsley M, Zou S, Zhang D. Advancing Evidence-Based Data Interpretation in UV-Vis and Fluorescence Analysis for Nanomaterials: An Analytical Chemistry Perspective. Anal Chem. 2023 Dec 5;95(48):17426-17437.
[3]. Saha S, Singh J, Paul A, Sarkar R, Khan Z, Banerjee K. Anthocyanin Profiling Using UV-Vis Spectroscopy and Liquid Chromatography Mass Spectrometry. J AOAC Int. 2020 Jan 1;103(1):23-39.
[4]. Dankowska A, Kowalewski W. Tea types classification with data fusion of UV-Vis, synchronous fluorescence and NIR spectroscopies and chemometric analysis. Spectrochim Acta A Mol Biomol Spectrosc. 2019 Mar 15;211:195-202
[5]. Scriba G, Wätzig H. Pharmaceutical Analysis. Electrophoresis. 2018 Oct;39(20):2491.
[6]. Saha M, Dhiman S, Gupta GD, Asati V. An Investigative Review for Pharmaceutical Analysis of Fenofibrate. J Chromatogr Sci. 2023 May 30;61(5):494-504.
[7]. Østergaard J. UV imaging in pharmaceutical analysis. J Pharm Biomed Anal. 2018 Jan 5;147:140-148.
[8]. Biancolillo A, Marini F. Chemometric Methods for Spectroscopy-Based Pharmaceutical Analysis. Front Chem. 2018 Nov 21;6:576.
[9]. Biancolillo A, Marini F. Chemometric Methods for Spectroscopy-Based Pharmaceutical Analysis. Front Chem. 2018 Nov 21;6:576.
[10]. Jägerbrand AK, Spoelstra K. Effects of anthropogenic light on species and ecosystems. Science. 2023 Jun 16;380(6650).
[11]. Shi Z, Chow CWK, Fabris R, Liu J, Jin B. Applications of Online UV-Vis Spectrophotometer for Drinking Water Quality Monitoring and Process Control: A Review. Sensors (Basel). 2022 Apr 13;22(8).
[12]. Mayerhöfer TG, Pahlow S, Popp J. The Bouguer-Beer-Lambert Law: Shining Light on the Obscure. Chemphyschem. 2020 Sep 15;21(18):2029-2046.
[13]. Oshina I, Spigulis J. Beer-Lambert law for optical tissue diagnostics: current state of the art and the main limitations. J Biomed Opt. 2021 Oct;26(10).
[14]. Baker WB, Forti RM, Heye P, et al. Modified Beer-Lambert algorithm to measure pulsatile blood flow, critical closing pressure, and intracranial hypertension. Biomed Opt Express. 2024;15(9).
[15]. Advances on Water Quality Detection by UV-Vis Spectroscopy. Appl. Sci. 2020;10:6874.
[16]. Kusumiyati K, Putri IE. Comparison of color spectrophotometer and Vis/NIR spectroscopy on assessing natural pigments of cucumber applied with different ethephon concentrations. Heliyon. 2023 Nov 21;9(12).
[17]. Harada T, Manabe K. Chiroptical spectrophotometer and analytical method for optically anisotropic samples. Rev Sci Instrum. 2020 Dec 1;91(12).
[18]. Biter AB, Pollet J, Chen WH, Strych U, Hotez PJ, Bottazzi ME. A method to probe protein structure from UV absorbance spectra. Anal Biochem. 2019 Dec 15;587:113450.
[19]. Patle TK, Shrivas K, Kurrey R, Upadhyay S, Jangde R, Chauhan R. Phytochemical screening and determination of phenolics and flavonoids in Dillenia pentagyna using UV-vis and FTIR spectroscopy. Spectrochim Acta A Mol Biomol Spectrosc. 2020 Dec 5;242:118717.
[20]. Azizi-Khereshki N, Mousavi HZ, Dogaheh MG, Farsadrooh M, Alizadeh N, Mohammadi A. Synthesis of molecularly imprinted polymer as a nanosorbent for dispersive magnetic micro solid-phase extraction and determination of valsartan in biological samples by UV-Vis Spectrophotometry: Isotherm, kinetics, and thermodynamic studies. Spectrochim Acta A Mol Biomol Spectrosc. 2023 Aug 5;296:122656.
[21]. Ferreira CP, Techera Antunes FT, Rebelo IN, da Silva CA Junior, Vilanova FN, Corrêa DS, de Souza AH. Application of the UV-vis spectrophotometry method for the determination of glutamate in the cerebrospinal fluid of rats. J Pharm Biomed Anal. 2020 Jul 15;186:113290.
[22]. Chen J, Li JQ, Li T, Liu HG, Wang YZ. Application of UV-Vis and Infrared Spectroscopy on Wild Edible Bolete Mushrooms Discrimination and Evaluation: A Review. Crit Rev Anal Chem. 2023;53(4):852-868.
[23]. Farag MA, Sheashea M, Zhao C, Maamoun AA. UV Fingerprinting Approaches for Quality Control Analyses of Food and Functional Food Coupled to Chemometrics: A Comprehensive Analysis of Novel Trends and Applications. Foods. 2022 Sep 16;11(18):2867.
[24]. Goman D, Stanković A, Galović O, Džakula BN, Kontrec J, Medvidović-Kosanović M. Complexation of gallic acid with calcium: electrochemical, potentiometric, and UV-VIS studies. Anal Methods. 2024 Jan 18;16(3):391-395.
[25]. De Saegher T, Vercammen J, Atanasova B, Van Geem KM, De Clercq J, Verberckmoes A, Lauwaert J. Efficient mapping of lignin depolymerization product pools and quantification of specific monomers through rapid GPC-HPLC-UV/VIS analysis. Anal Chim Acta. 2023 Oct 16;1278:341738
[26]. Antony A, Mitra J. Refractive index-assisted UV/Vis spectrophotometry to overcome spectral interference by impurities. Anal Chim Acta. 2021 Mar 8;1149:238186
[27]. Rahman MAA, Elghobashy MR, Zaazaa HE, El-Mosallamy SS. Novel analytical method based on chemometric models applied to UV-Vis spectrophotometric data for simultaneous determination of Etoricoxib and Paracetamol in presence of Paracetamol impurities. BMC Chem. 2023 Dec 7;17(1):176. doi: 10.1186/s13065-023-01095-x. PMID: 38062520; PMCID: PMC10702036.
[28]. Ergin MF, Yasa H. Determination of amoxicillin trihydrate impurities 4-hydroxyphenylglycine (4-HPG) and 6-Aminopenicylanic acid (6-APA) by means of ultraviolet spectroscopy. Methods Appl Fluoresc. 2022 May 25;10(3).
[29]. Guo Y, Han Z, Zhang J, Lu Y, Li C, Liu G. Development of a high-speed and ultrasensitive UV/Vis-CM for detecting total triterpenes in traditional Chinese medicine and its application. Heliyon. 2024 May 31;10(11):e32239.
[30]. Law AS, Hafen PS, Brault JJ. Liquid chromatography method for simultaneous quantification of ATP and its degradation products compatible with both UV-Vis and mass spectrometry. J Chromatogr B Analyt Technol Biomed Life Sci. 2022 Aug 15;1206:123351.
[31]. Almeida J, Bezerra M, Markl D, Berghaus A, Borman P, Schlindwein W. Development and Validation of an In-Line API Quantification Method Using AQbD Principles Based on UV-Vis Spectroscopy to Monitor and Optimise Continuous Hot Melt Extrusion Process. Pharmaceutics. 2020 Feb 12;12(2):150.
[32]. Farag MA, Sheashea M, Zhao C, Maamoun AA. UV Fingerprinting Approaches for Quality Control Analyses of Food and Functional Food Coupled to Chemometrics: A Comprehensive Analysis of Novel Trends and Applications. Foods. 2022 Sep 16;11(18):2867.
[33]. Farag MA, Khaled SE, El Gingeehy Z, Shamma SN, Zayed A. Comparative Metabolite Profiling and Fingerprinting of Medicinal Cinnamon Bark and Its Commercial Preparations via a Multiplex Approach of GC-MS, UV, and NMR Techniques. Metabolites. 2022 Jul 1;12(7):614.