


1. Introduction
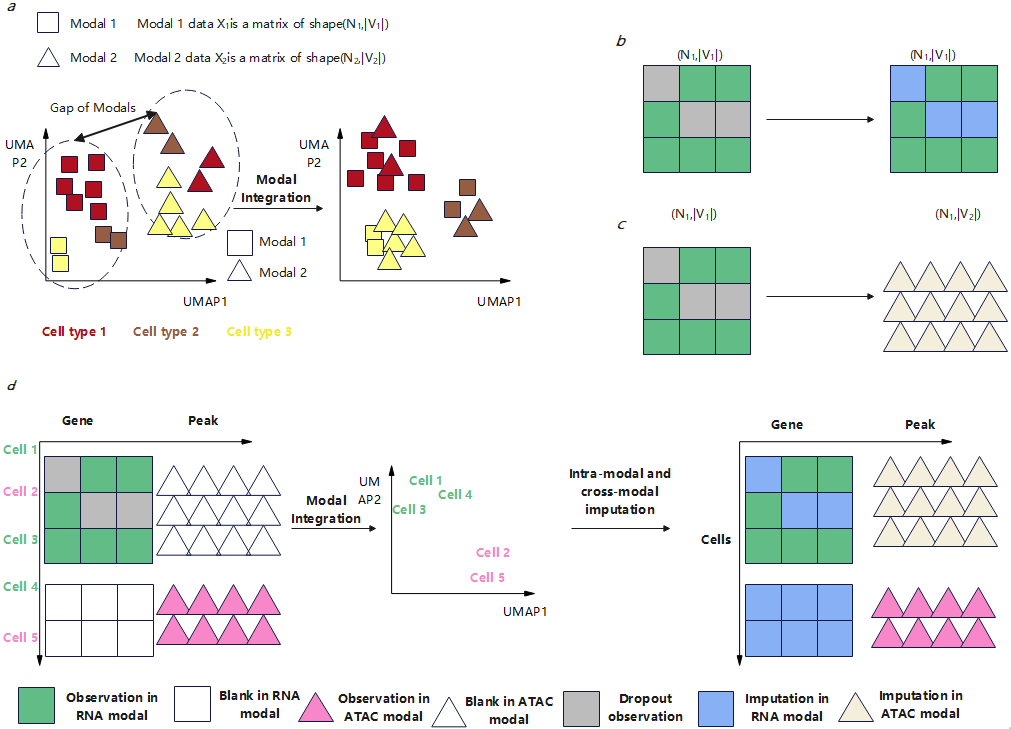
Advances in single-cell measurement technologies have enabled cell-resolution acquisition of multimodal biological data, including transcriptomes and chromatin accessibility. The rapid growth of these datasets has spurred the development of deep learning methods for multimodal biological data analysis, aiming to elucidate biological states and facilitate applications such as drug discovery [1]. Recent studies have identified fundamental tasks for multimodal cell data analysis [2]: integration and imputation. Figure 1 illustrates definitions of multimodal integration and imputation.
Integration involves bridging modality gaps and identifying biological clusters in a unified multimodal atlas to reveal cell identity and function. Imputation aims to recover missing signals caused by measurement noise. While intra-modal imputation restores zero or low-expression values in the original data, cross-modal imputation reconstructs data across modalities in the absence of joint measurements. Although methods exist for separate integration and imputation, no unified benchmark addresses both tasks. This study reviews existing methods and establishes a joint benchmark to promote multimodal biological data analysis.
For integration, multimodal datasets typically consist of unpaired cells with cross-modal feature mismatches. Matrices represent cell data, where rows are samples (cells) and columns are features (genes/proteins). For different modalities, feature spaces are independent, and inter-modality samples lack pairing information. Traditional methods project multimodal data into a joint feature space, but this can disrupt biological heterogeneity [3-5]. Recent approaches transform integration into end-to-end cell representation learning [6-8]. Techniques like Concerto (contrastive learning) [10], scBERT (Transformer-based gene representations) [11], and CLUE (cross-modal guided graphs) [12] demonstrate advancements in cell representation learning. Monae combines these perspectives while ensuring computational efficiency [13].
For imputation, dropout events in scRNA-seq data introduce high noise, complicating downstream analyses. Intra-modal imputation recovers true values from zero counts, while cross-modal imputation predicts missing modalities using complementary signals [14]. Most existing methods target RNA modality, divided into model-based [15-19] and deep learning-based [20-23] approaches. Recent methods support multimodal integration and cross-modal imputation [24]. Monae uniquely handles unpaired scenarios and jointly performs integration and imputation [13].
In summary, current methods for multimodal biological data integration and imputation have established their own benchmarks independently, lacking unified datasets and standardized evaluation metrics. This fragmentation hinders direct comparisons and progress in the field. Therefore, this study aims to collect and systematically evaluate a broad range of existing methods for integration and imputation, establishing a reliable and comprehensive benchmark. This effort will provide a foundation for future research in multimodal biological data analysis, fostering the development of more robust and generalizable tools.
2. Methods
We summarize representative methods for integration and imputation tasks, selecting benchmarking candidates as shown in Table 1. Datasets used in benchmarks are detailed in Table 2.
|
Methods |
Year |
Task |
Integration cases |
Imputation cases |
||
|
Totally unpaired |
3 modalities |
Intra-modal.impu |
Cross-modal.impu |
|||
|
Monae |
2024 |
both |
Yes |
Yes |
Yes |
Yes |
|
Monae-E |
2024 |
both |
Yes |
Yes |
Yes |
Yes |
|
scButterfly |
2024 |
both |
No |
No |
No |
Yes |
|
MultiVI |
2023 |
both |
No |
Yes |
Yes |
Yes |
|
JAMIE |
2023 |
both |
No |
No |
No |
Yes |
|
CoVEL |
2024 |
integration |
Yes |
Yes |
No |
No |
|
GLUE |
2022 |
integration |
Yes |
Yes |
No |
No |
|
UnitedNet |
2023 |
imputation |
No |
No |
No |
Yes |
|
BABEL |
2021 |
imputation |
No |
No |
No |
Yes |
|
DCA |
2019 |
imputation |
No |
No |
Yes |
No |
|
MAGIC |
2018 |
imputation |
No |
No |
Yes |
No |
|
Dataset |
Task |
Batch |
Modality |
Modalrelation |
Organ |
|
10xMultiome |
both |
N/A |
2 |
Paired |
HomoPBMC |
|
Chen2019 |
both |
N/A |
2 |
Shuffle |
MouseCortex |
|
Ma2020 |
both |
4 |
2 |
Paired |
MouseSkin |
|
Muto2021 |
both |
5 |
2 |
Unpaired |
HomoKidney |
2.1. Integration
Integration of multimodal cell data can be categorized into two primary types: semi-supervised and unsupervised methods. Semi-supervised methods rely on paired observations across modalities. For instance, MultiVI employs a series of variational autoencoders to learn from multimodal data and align joint embeddings [6]. CLUE introduces auxiliary tasks to facilitate alignment between heterogeneous feature spaces [12]. scMoGNN leverages graph neural networks (GNNs) to identify connections between different cell modalities and integrates them using established single-modal embeddings [25]. However, due to the high cost of obtaining paired cell data, unsupervised methods have gained popularity. These methods merge multimodal measurements without relying on paired data. Techniques like Seurat [3], LIGER [4], and Harmony [5] first perform functional transformations to resolve differences within shared spaces, but such transformations may compromise inherent biological heterogeneity. The matrix factorization method iNMF [26] circumvents the need for projections but lacks the ability to capture complex biological interactions due to its linearity. Other methods, such as bindSC [27], are limited by dependencies on specific modalities (e.g., RNA and ATAC) and scalability issues. Pamona [28] uses nonlinear manifold alignment to synchronize data across modalities but struggles with uniformly distributed data. GLUE [29] fuses multimodal information via guided graphs, though its integration outcomes remain suboptimal. CoVEL [9] enhances cell representation by fusing information from single-cell multimodal data, demonstrating improved integration performance through multi-view embedding learning. However, its complex architecture limits applicability across diverse datasets. Monae addresses these limitations by refining CoVEL into an efficient integration framework [13].
2.2. Imputation
Most imputation methods focus on the RNA modality and are classified into model-based and deep learning-based approaches. Model-based methods recover gene expression counts using similarity relationships (e.g., gene-gene or cell-cell correlations). SAVER [15] improves expression estimates by leveraging gene-cell associations, while MAGIC [16] shares information across similar cells via data diffusion to account for dropout events. Deep learning methods, such as AutoImpute [30], learn inherent data distributions through autoencoders. DCA [23] introduces a zero-inflated negative binomial model to capture nonlinear gene-gene correlations and sparse count distributions. However, these single-modal methods lack signals from complementary modalities. Only a few techniques support multimodal data. UnitedNet [14] performs cross-modal imputation via multitask learning but requires paired cell data. scButterfly [31], MultiVI [6], and JAMIE [32] enable multimodal integration and cross-modal imputation but depend on partial pairing. Monae uniquely supports unpaired scenarios and simultaneously handles intra-modal and cross-modal imputation [13].
3. Experiments
3.1. Experimental settings
We employed four publicly available multimodal datasets in our study. Dataset 1, 10xMultiome[33], comprised 9,631 human peripheral blood mononuclear cells (PBMCs) profiled using 10x Genomics Multiome technology to jointly measure transcriptomic and chromatin accessibility features. Dataset 2, Chen2019[34], included 9,190 mouse cortical cells generated via SNARE-seq, with cell pairing modified to simulate unpaired multimodal scenarios. Dataset 3, Ma2020[35], contained 32,231 mouse skin cells assayed by SHARE-seq across four batches per modality, enabling batch effect evaluation. Dataset 4, Muto2021[36], featured 44,190 human kidney cells (19,985 RNA and 24,205 ATAC profiles) generated through snRNA-seq and snATAC-seq, with five batches per modality to test scalability under complex unpaired conditions. For integration performance assessment, we computed a composite score integrating batch correction metrics (SAS, GC, batch.r) and biological fidelity metrics (MAP, cell type ASW, NC). Imputation efficacy was evaluated using AMI, ARI, NMI, and HOM metrics. All experiments adopted a standardized 10% random cell split for validation to ensure robustness.3.2.Multimodal Integration Benchmarks.
Results on four datasets are shown in Tables 3–6.
|
method |
NC |
MAP |
cell type ASW |
SAS |
omics layer ASW |
GC |
bio.c |
batch.r |
overall |
|
scButterfly |
0.153 |
0.812 |
0.592 |
0.855 |
0.637 |
0.953 |
0.519 |
0.815 |
0.637 |
|
GLUE |
0.205 |
0.875 |
0.603 |
0.892 |
0.909 |
0.968 |
0.561 |
0.923 |
0.706 |
|
MultiVI |
0.16 |
0.8 |
0.62 |
0.84 |
0.8 |
0.85 |
0.527 |
0.83 |
0.648 |
|
JAMIE |
0.166 |
0.76 |
0.51 |
0.82 |
0.72 |
0.81 |
0.479 |
0.783 |
0.601 |
|
CoVEL |
0.224 |
0.864 |
0.635 |
0.919 |
0.923 |
0.961 |
0.574 |
0.934 |
0.718 |
|
Monae |
0.244 |
0.959 |
0.851 |
0.948 |
0.926 |
0.945 |
0.685 |
0.94 |
0.787 |
|
Monae-E |
0.324 |
0.88 |
0.732 |
0.863 |
0.84 |
0.964 |
0.645 |
0.889 |
0.743 |
|
method |
NC |
MAP |
cell type ASW |
SAS |
omics layer ASW |
GC |
bio.c |
batch.r |
overall |
|
scButterfly |
0.15 |
0.57 |
0.51 |
0.91 |
0.68 |
0.86 |
0.41 |
0.817 |
0.573 |
|
GLUE |
0.259 |
0.641 |
0.543 |
0.867 |
0.9 |
0.935 |
0.481 |
0.901 |
0.649 |
|
MultiVI |
0.14 |
0.55 |
0.46 |
0.85 |
0.77 |
0.58 |
0.383 |
0.733 |
0.523 |
|
JAMIE |
0.132 |
0.481 |
0.41 |
0.831 |
0.784 |
0.528 |
0.341 |
0.714 |
0.49 |
|
CoVEL |
0.178 |
0.609 |
0.605 |
0.856 |
0.904 |
0.902 |
0.464 |
0.887 |
0.633 |
|
Monae |
0.204 |
0.903 |
0.741 |
0.971 |
0.876 |
0.946 |
0.616 |
0.931 |
0.742 |
|
Monae-E |
0.178 |
0.647 |
0.598 |
0.932 |
0.925 |
0.901 |
0.475 |
0.919 |
0.652 |
|
method |
NC |
MAP |
cell type ASW |
SAS |
omics layer ASW |
GC |
bio.c |
batch.r |
overall |
|
scButterfly |
0.117 |
0.518 |
0.498 |
0.86 |
0.648 |
0.476 |
0.377 |
0.661 |
0.491 |
|
GLUE |
0.2 |
0.829 |
0.564 |
0.91 |
0.812 |
0.845 |
0.531 |
0.856 |
0.661 |
|
MultiVI |
0.167 |
0.495 |
0.502 |
0.875 |
0.771 |
0.694 |
0.388 |
0.78 |
0.545 |
|
JAMIE |
0.099 |
0.455 |
0.407 |
0.764 |
0.603 |
0.518 |
0.32 |
0.628 |
0.443 |
|
CoVEL |
0.2 |
0.857 |
0.567 |
0.914 |
0.857 |
0.886 |
0.541 |
0.886 |
0.679 |
|
Monae |
0.153 |
0.919 |
0.84 |
0.937 |
0.763 |
0.951 |
0.637 |
0.884 |
0.736 |
|
Monae-E |
0.236 |
0.628 |
0.586 |
0.917 |
0.779 |
0.728 |
0.483 |
0.808 |
0.613 |
|
method |
NC |
MAP |
cell type ASW |
SAS |
omics layer ASW |
GC |
bio.c |
batch.r |
overall |
|
scButterfly |
0.181 |
0.927 |
0.698 |
0.814 |
0.66 |
0.974 |
0.602 |
0.816 |
0.687 |
|
GLUE |
0.17 |
0.911 |
0.619 |
0.621 |
0.908 |
0.96 |
0.567 |
0.83 |
0.672 |
|
MultiVI |
0.178 |
0.897 |
0.617 |
0.656 |
0.754 |
0.872 |
0.564 |
0.761 |
0.643 |
|
JAMIE |
0.17 |
0.903 |
0.528 |
0.61 |
0.687 |
0.789 |
0.534 |
0.695 |
0.598 |
|
CoVEL |
0.184 |
0.937 |
0.699 |
0.82 |
0.851 |
0.982 |
0.607 |
0.884 |
0.718 |
|
Monae |
0.193 |
0.974 |
0.765 |
0.922 |
0.878 |
0.978 |
0.644 |
0.926 |
0.757 |
|
Monae-E |
0.191 |
0.951 |
0.765 |
0.863 |
0.877 |
0.978 |
0.635 |
0.906 |
0.744 |
Based on the assessment results of four multimodal integration methods across four representative datasets, significant disparities in method performance were observed across key metrics. The detailed findings are summarized as follows:
3.2.1.Methods with outstanding overall performance
3.2.1.1. CoVEL
CoVEL demonstrated exceptional cross-modal prediction accuracy (MAP scores of 0.857 in Dataset 3 and 0.937 in Dataset 4), ranking among top-tier methods with consistent overall scores (0.679–0.686). Despite a relatively low Normalized Mutual Information (NC) score of 0.2 in Dataset 3, its robustness in cross-modal data fusion stood out, achieving high Shared Neighbors Consistency (SAS = 0.914).
3.2.1.2. Monae series
Monae-E exhibited superior performance in graph connectivity (GC) and biological consistency (bio.c) metrics (e.g., GC=0.978, bio.c=0.645 in Dataset 4), underscoring its strength in integrating biological features.Monae achieved a balanced overall score of 0.736 (Dataset 3) and 0.757 (Dataset 4), with a notable MAP value of 0.974. However, its NC score remained relatively low (0.153–0.193), indicating room for improvement in cross-modal cell type annotation consistency.
3.2.2. Methods with specific metric advantages
3.2.2.1. GLUE
Excelled in batch effect removal (batch.r) and shared neighborhood consistency (SAS) (e.g., batch.r=0.908 in Dataset 4, SAS=0.9 in Dataset 2). However, its NC (0.2 in Dataset 3) and MAP (0.829 in Dataset 3) scores were suboptimal, limiting its utility in cell annotation and cross-modal prediction tasks.
3.2.2.2. scButterfly
Achieved high MAP values (0.812 in Dataset 1, 0.875 in Dataset 2) but underperformed in NC (0.181 in Dataset 4) and overall score (0.687 in Dataset 4). It is best suited for scenarios prioritizing cross-modal mapping consistency over global integration.
3.2.2.3. JAMIE
Showcased strong performance in omics layer ASW (0.831 in Dataset 2) but lagged in NC (0.099 in Dataset 3) and overall score (0.443), reflecting a focus on local structure preservation rather than holistic integration.
3.2.3. Characteristics of other methods
3.2.3.1. MultiVI
Delivered moderate performance in biological consistency (GC and bio.c) (e.g., GC=0.872 in Dataset 4) but struggled with NC (0.167–0.495) and MAP (0.495 in Dataset 4). It is recommended for applications emphasizing biological fidelity over cross-modal alignment.
3.2.4. Summary and recommendations
3.2.4.1. Overall performance recommendations
Monae-E is ideal for tasks requiring balanced biological interpretability and cross-modal prediction (e.g., GC, bio.c, MAP).CoVEL excels in prediction accuracy and cross-modal consistency, making it suitable for cell state mapping-intensive scenarios.
3.2.4.2. Scenario-specific selections
GLUE is preferred for batch effect mitigation.scButterfly is advisable for optimizing cross-modal mapping consistency.
3.2.4.3. Limitations and future directions
Most methods struggle to balance NC (cross-modal annotation consistency) and batch.r (batch effect removal), highlighting the need for algorithms that synergize local precision with global stability. Future work should focus on unified frameworks addressing these trade-offs.
3.3. Intra-modal imputation benchmarks (Muto2021 dataset)
The intra-modal imputation benchmark focused on the Muto2021 dataset, where RNA and ATAC modalities are completely unpaired. This challenging setup evaluates algorithms’ ability to recover missing signals without direct cross-modal correspondence. Results are presented in Table 7.
|
method |
ARI |
AMI |
NMI |
HOM |
dataset |
|
MultiVI |
0.282 |
0.72 |
0.697 |
0.929 |
muto2021 |
|
MAGIC |
0.189 |
0.628 |
0.655 |
0.931 |
muto2021 |
|
DCA |
0.31 |
0.676 |
0.591 |
0.907 |
muto2021 |
|
Monae |
0.39 |
0.729 |
0.73 |
0.908 |
muto2021 |
|
Monae-E |
0.416 |
0.706 |
0.735 |
0.918 |
muto2021 |
The unpaired Muto2021 dataset posed challenges for imputation robustness. Monae-E ranked first in HOMe (0.918) and NMI (0.735), excelling in cross-modal distribution alignment. Monae closely followed (AMI=0.729, NMI=0.730). Traditional methods like MultiVI (HOMe=0.929) and MAGIC (HOMe=0.931) underperformed (NMI <0.70), while DCA achieved moderate NMI (0.591) but lagged in HOMe (0.907). These results validate deep learning’s superiority for unpaired intra-modal imputation, with Monae-E’s optimized joint learning strategy achieving superior cross-modal representation.
3.4. Cross-modal imputation benchmarks (Muto2021 dataset)
Cross-modal imputation experiments used the Muto2021 dataset, featuring completely unpaired RNA and ATAC modalities, to assess methods’ robustness in reconstructing missing modalities without direct pairwise correspondence. Results are shown in Tables 8–9 (RNA→ATAC and ATAC→RNA directions).
|
method |
ARI |
AMI |
NMI |
HOM |
dataset |
|
BABEL |
0.119 |
0.235 |
0.266 |
0.32 |
Muto-2021 |
|
UnitedNet |
0.203 |
0.424 |
0.451 |
0.436 |
Muto-2021 |
|
JAMIE |
0.141 |
0.273 |
0.396 |
0.413 |
Muto-2021 |
|
MultiVI |
0.265 |
0.632 |
0.646 |
0.872 |
Muto-2021 |
|
scButterfly |
0.297 |
0.703 |
0.645 |
0.923 |
Muto-2021 |
|
Monae |
0.44 |
0.778 |
0.771 |
0.934 |
Muto-2021 |
|
Monae-E |
0.451 |
0.751 |
0.764 |
0.9 |
Muto-2021 |
|
method |
ARI |
AMI |
NMI |
HOM |
dataset |
|
BABEL |
0.042 |
0.134 |
0.123 |
0.147 |
Muto-2021 |
|
UnitedNet |
0.062 |
0.108 |
0.108 |
0.17 |
Muto-2021 |
|
JAMIE |
0.087 |
0.206 |
0.218 |
0.27 |
Muto-2021 |
|
MultiVI |
0.211 |
0.61 |
0.637 |
0.883 |
Muto-2021 |
|
scButterfly |
0.331 |
0.697 |
0.683 |
0.888 |
Muto-2021 |
|
Monae |
0.229 |
0.674 |
0.66 |
0.937 |
Muto-2021 |
|
Monae-E |
0.183 |
0.596 |
0.606 |
0.895 |
Muto-2021 |
3.4.1. Overall performance comparison
3.4.1.1. scButterfly excels in RNA→ATAC direction
NMI reached 0.645, and HOM achieved 0.923, significantly outperforming other methods (e.g., MultiVI: NMI=0.646, HOM=0.872).AMI (0.703) and ARI (0.297) also demonstrated strong capability in capturing cross-modal joint distributions.
3.4.1.2. MultiVI shows robustness in ATAC→RNA direction
NMI=0.637 and HOM=0.883 highlighted its strength in preserving global structure.However, ARI (0.211) and AMI (0.61) were relatively low, indicating weaker fine-grained alignment.
3.4.1.3. Monae exhibits directional variability
RNA→ATAC: NMI=0.764, HOM=0.934 (Table 8).ATAC→RNA: NMI=0.66, HOM=0.895 (Table 9).Performance discrepancies likely reflect directional data distribution shifts, yet Monae still outperformed most traditional methods.
3.4.2. Methodological insights
3.4.2.1. Deep learning methods dominate
scButterfly achieved near-perfect HOM (0.923) in RNA→ATAC, showcasing exceptional consistency in modeling cross-modal cell states.scButterfly and MultiVI surpassed traditional methods (e.g., BABEL: NMI=0.235) by wide margins in HOM and NMI.
3.4.2.2. Limitations of traditional approaches
BABEL underperformed across all metrics (RNA→ATAC: NMI=0.235, HOM=0.32; ATAC→RNA: NMI=0.123, HOM=0.147), underscoring challenges in aligning heterogeneous modalities.JAMIE’s HOM=0.413 in RNA→ATAC revealed weaknesses in local structure preservation.
3.4.3. Key conclusions
3.4.3.1. Directional sensitivity of cross-modal mapping
Performance disparities between RNA→ATAC and ATAC→RNA tasks (e.g., scButterfly’s NMI drop from 0.645 to 0.683; Monae’s HOM decline from 0.934 to 0.895) emphasize the need for direction-specific optimizations.
3.4.3.2. Deep learning methods excel in complex scenarios
Generative models (e.g., scButterfly) and joint embedding frameworks (e.g., MultiVI) outperformed traditional methods in capturing global dependencies (HOM) and distribution consistency (NMI).
3.4.3.3. Practical trade-offs
For high-precision cell state alignment (HOM > 0.9), prioritize scButterfly.For balanced efficiency and robustness, MultiVI remains a viable alternative.
3.4.4. Summary
These experiments validate the effectiveness of deep learning in unpaired multimodal integration. scButterfly leads in RNA→ATAC imputation, while MultiVI excels in ATAC→RNA stability. Future work must resolve directional sensitivities to achieve generalized cross-modal solutions.
4. Conclusion
This study establishes a benchmark for multimodal biological data integration and imputation, revealing significant methodological disparities. CoVEL excels in cross-modal prediction accuracy (MAP) and shared neighborhood preservation (SAS), while Monae variants balance biological interpretability (graph connectivity, biological conservation) with integration efficacy. Deep learning methods (e.g., scButterfly, Monae-E) outperform traditional approaches in unpaired imputation tasks. Task-specific recommendations include GLUE for batch effect removal, scButterfly for RNA→ATAC mapping, and Monae-E for holistic integration. Key challenges remain in reconciling local precision with global stability and addressing directional biases. Future work should prioritize unified frameworks, scalable architectures, and direction-agnostic models to advance robust, generalizable solutions in multimodal biological analysis.
References
[1]. Heumos L, Schaar A C, Lance C, et al. Best practices for single-cell analysis across modalities [J]. Nature Reviews Genetics, 2023, 24(8): 550-572.
[2]. Luecken M D, Burkhardt D B, Cannoodt R, et al. A sandbox for prediction and integration of DNA, RNA, and proteins in single cells [C]//Thirty-fifth conference on neural information processing systems datasets and benchmarks track (Round 2). 2021.
[3]. Stuart T, Butler A, Hoffman P, et al. Comprehensive integration of single-cell data [J]. cell, 2019, 177(7): 1888 1902. e21.
[4]. Welch J D, Kozareva V, Ferreira A, et al. Single-cell multi-omic integration compares and contrasts features of brain cell identity [J]. Cell, 2019, 177(7): 1873-1887. e17.
[5]. Korsunsky I, Millard N, Fan J, et al. Fast, sensitive and accurate integration of single-cell data with Harmony [J]. Nature methods, 2019, 16(12): 1289-1296.
[6]. Ashuach T, Gabitto M I, Koodli R V, et al. MultiVI: deep generative model for the integration of multimodal data [J]. Nature Methods, 2023, 20(8): 1222-1231.
[7]. Cohen Kalafut N, Huang X, Wang D. Joint variational autoencoders for multimodal imputation and embedding [J]. Nature machine intelligence, 2023, 5(6): 631-642.
[8]. Tang Z, Chen G, Chen S, et al. Knowledge-based inductive bias and domain adaptation for cell type annotation [J]. Communications Biology, 2024, 7(1): 1440.
[9]. Tang Z, Huang J, Chen G, et al. Comprehensive view embedding learning for single-cell multimodal integration [C]//Proceedings of the AAAI Conference on Artificial Intelligence. 2024, 38(14): 15292-15300.
[10]. Yang M, Yang Y, Xie C, et al. Contrastive learning enables rapid mapping to multimodal single-cell atlas of multimillion scale [J]. Nature Machine Intelligence, 2022, 4(8): 696-709.
[11]. Yang F, Wang W, Wang F, et al. scBERT as a large-scale pretrained deep language model for cell type annotation of single-cell RNA-seq data [J]. Nature Machine Intelligence, 2022, 4(10): 852-866.
[12]. Tu X, Cao Z J, Xia C R, et al. Cross-linked unified embedding for cross-modality representation learning [C]//Advances in Neural Information Processing Systems. 2022.
[13]. Tang Z, Chen G, Chen S, et al. Modal-nexus auto-encoder for multi-modality cellular data integration and imputation [J]. Nature Communications, 2024, 15(1): 9021.
[14]. Tang X, Zhang J, He Y, et al. Explainable multi-task learning for multi-modality biological data analysis [J]. Nature communications, 2023, 14(1): 2546..
[15]. Huang M, Wang J, Torre E, et al. SAVER: gene expression recovery for single-cell RNA sequencing [J]. Nature methods, 2018, 15(7): 539-542.
[16]. Van Dijk D, Sharma R, Nainys J, et al. Recovering gene interactions from single-cell data using data diffusion [J]. Cell, 2018, 174(3): 716-729. e27.
[17]. Li W V, Li J J. An accurate and robust imputation method scImpute for single-cell RNA-seq data [J]. Nature communications, 2018, 9(1): 997.
[18]. Gong W, Kwak I Y, Pota P, et al. DrImpute: imputing dropout events in single cell RNA sequencing data [J]. BMC bioinformatics, 2018, 19: 1-10.
[19]. Linderman G C, Zhao J, Roulis M, et al. Zero-preserving imputation of single-cell RNA-seq data [J]. Nature communications, 2022, 13(1): 192.
[20]. Arisdakessian C, Poirion O, Yunits B, et al. DeepImpute: an accurate, fast, and scalable deep neural network method to impute single-cell RNA-seq data [J]. Genome biology, 2019, 20: 1-14.
[21]. Jin K, Ou-Yang L, Zhao X M, et al. scTSSR: gene expression recovery for single-cell RNA sequencing using two side sparse self-representation [J]. Bioinformatics, 2020, 36(10): 3131-3138.
[22]. Wang J, Ma A, Chang Y, et al. scGNN is a novel graph neural network framework for single-cell RNA-Seq analyses [J]. Nature communications, 2021, 12(1): 1882.
[23]. Eraslan G, Simon L M, Mircea M, et al. Single-cell RNA-seq denoising using a deep count autoencoder [J]. Nature communications, 2019, 10(1): 390.
[24]. Wu K E, Yost K E, Chang H Y, et al. BABEL enables cross-modality translation between multiomic profiles at single-cell resolution [J]. Proceedings of the National Academy of Sciences, 2021, 118(15): e2023070118.
[25]. Wen H, Ding J, Jin W, et al. Graph neural networks for multimodal single-cell dataintegration [C]//Proceedings of the 28th ACM SIGKDD conference on knowledge discovery and data mining. 2022: 4153-4163.
[26]. Gao C, Liu J, Kriebel A R, et al. Iterative single-cell multi-omic integration using online learning [J]. Nature biotechnology, 2021, 39(8): 1000-1007.
[27]. Dou J, Liang S, Mohanty V, et al. Bi-order multimodal integration of single-cell data [J]. Genome biology, 2022, 23(1): 112.
[28]. Cao K, Hong Y, Wan L. Manifold alignment for heterogeneous single-cell multi-omics data integration using Pamona [J]. Bioinformatics, 2022, 38(1): 211-219.
[29]. Cao Z J, Gao G. Multi-omics single-cell data integration and regulatory inference with graph-linked embedding [J]. Nature Biotechnology, 2022, 40(10): 1458-1466.
[30]. Talwar D, Mongia A, Sengupta D, et al. AutoImpute: Autoencoder based imputation of single-cell RNA-seq data [J]. Scientific reports, 2018, 8(1): 16329.
[31]. Cao Y, Zhao X, Tang S, et al. scButterfly: a versatile single-cell cross-modality translation method via dual-aligned variational autoencoders [J]. Nature Communications, 2024, 15(1): 2973.
[32]. Cohen Kalafut N, Huang X, Wang D. Joint variational autoencoders for multimodal imputation and embedding [J]. Nature machine intelligence, 2023, 5(6): 631-642.
[33]. PBMC from a Healthy Donor, Single Cell Multiome ATAC Gene Expression Demonstration Data by Cell Ranger ARC 1.0.0. 10X Genomics https: //support.10xgenomics.com/single-cell-multiome-atacgex/datasets/1.0.0/pbmc_granulocyte_sorted_ 10k (2020).
[34]. Chen S, Lake B B, Zhang K. High-throughput sequencing of the transcriptome and chromatin accessibility in the same cell [J]. Nature biotechnology, 2019, 37(12): 1452-1457.
[35]. Ma S, Zhang B, LaFave L M, et al. Chromatin potential identified by shared single-cell profiling of RNA and chromatin [J]. Cell, 2020, 183(4): 1103-1116. e20.
[36]. Muto Y, Wilson P C, Ledru N, et al. Single cell transcriptional and chromatin accessibility profiling redefine cellular heterogeneity in the adult human kidney [J]. Nature communications, 2021, 12(1): 2190.
Cite this article
Zhang,B.;Zhang,S. (2025). Benchmarking Multimodal Biological Data Integration and Imputation. Applied and Computational Engineering,157,80-91.
Data availability
The datasets used and/or analyzed during the current study will be available from the authors upon reasonable request.
Disclaimer/Publisher's Note
The statements, opinions and data contained in all publications are solely those of the individual author(s) and contributor(s) and not of EWA Publishing and/or the editor(s). EWA Publishing and/or the editor(s) disclaim responsibility for any injury to people or property resulting from any ideas, methods, instructions or products referred to in the content.
About volume
Volume title: Proceedings of CONF-CDS 2025 Symposium: Data Visualization Methods for Evaluatio
© 2024 by the author(s). Licensee EWA Publishing, Oxford, UK. This article is an open access article distributed under the terms and
conditions of the Creative Commons Attribution (CC BY) license. Authors who
publish this series agree to the following terms:
1. Authors retain copyright and grant the series right of first publication with the work simultaneously licensed under a Creative Commons
Attribution License that allows others to share the work with an acknowledgment of the work's authorship and initial publication in this
series.
2. Authors are able to enter into separate, additional contractual arrangements for the non-exclusive distribution of the series's published
version of the work (e.g., post it to an institutional repository or publish it in a book), with an acknowledgment of its initial
publication in this series.
3. Authors are permitted and encouraged to post their work online (e.g., in institutional repositories or on their website) prior to and
during the submission process, as it can lead to productive exchanges, as well as earlier and greater citation of published work (See
Open access policy for details).
References
[1]. Heumos L, Schaar A C, Lance C, et al. Best practices for single-cell analysis across modalities [J]. Nature Reviews Genetics, 2023, 24(8): 550-572.
[2]. Luecken M D, Burkhardt D B, Cannoodt R, et al. A sandbox for prediction and integration of DNA, RNA, and proteins in single cells [C]//Thirty-fifth conference on neural information processing systems datasets and benchmarks track (Round 2). 2021.
[3]. Stuart T, Butler A, Hoffman P, et al. Comprehensive integration of single-cell data [J]. cell, 2019, 177(7): 1888 1902. e21.
[4]. Welch J D, Kozareva V, Ferreira A, et al. Single-cell multi-omic integration compares and contrasts features of brain cell identity [J]. Cell, 2019, 177(7): 1873-1887. e17.
[5]. Korsunsky I, Millard N, Fan J, et al. Fast, sensitive and accurate integration of single-cell data with Harmony [J]. Nature methods, 2019, 16(12): 1289-1296.
[6]. Ashuach T, Gabitto M I, Koodli R V, et al. MultiVI: deep generative model for the integration of multimodal data [J]. Nature Methods, 2023, 20(8): 1222-1231.
[7]. Cohen Kalafut N, Huang X, Wang D. Joint variational autoencoders for multimodal imputation and embedding [J]. Nature machine intelligence, 2023, 5(6): 631-642.
[8]. Tang Z, Chen G, Chen S, et al. Knowledge-based inductive bias and domain adaptation for cell type annotation [J]. Communications Biology, 2024, 7(1): 1440.
[9]. Tang Z, Huang J, Chen G, et al. Comprehensive view embedding learning for single-cell multimodal integration [C]//Proceedings of the AAAI Conference on Artificial Intelligence. 2024, 38(14): 15292-15300.
[10]. Yang M, Yang Y, Xie C, et al. Contrastive learning enables rapid mapping to multimodal single-cell atlas of multimillion scale [J]. Nature Machine Intelligence, 2022, 4(8): 696-709.
[11]. Yang F, Wang W, Wang F, et al. scBERT as a large-scale pretrained deep language model for cell type annotation of single-cell RNA-seq data [J]. Nature Machine Intelligence, 2022, 4(10): 852-866.
[12]. Tu X, Cao Z J, Xia C R, et al. Cross-linked unified embedding for cross-modality representation learning [C]//Advances in Neural Information Processing Systems. 2022.
[13]. Tang Z, Chen G, Chen S, et al. Modal-nexus auto-encoder for multi-modality cellular data integration and imputation [J]. Nature Communications, 2024, 15(1): 9021.
[14]. Tang X, Zhang J, He Y, et al. Explainable multi-task learning for multi-modality biological data analysis [J]. Nature communications, 2023, 14(1): 2546..
[15]. Huang M, Wang J, Torre E, et al. SAVER: gene expression recovery for single-cell RNA sequencing [J]. Nature methods, 2018, 15(7): 539-542.
[16]. Van Dijk D, Sharma R, Nainys J, et al. Recovering gene interactions from single-cell data using data diffusion [J]. Cell, 2018, 174(3): 716-729. e27.
[17]. Li W V, Li J J. An accurate and robust imputation method scImpute for single-cell RNA-seq data [J]. Nature communications, 2018, 9(1): 997.
[18]. Gong W, Kwak I Y, Pota P, et al. DrImpute: imputing dropout events in single cell RNA sequencing data [J]. BMC bioinformatics, 2018, 19: 1-10.
[19]. Linderman G C, Zhao J, Roulis M, et al. Zero-preserving imputation of single-cell RNA-seq data [J]. Nature communications, 2022, 13(1): 192.
[20]. Arisdakessian C, Poirion O, Yunits B, et al. DeepImpute: an accurate, fast, and scalable deep neural network method to impute single-cell RNA-seq data [J]. Genome biology, 2019, 20: 1-14.
[21]. Jin K, Ou-Yang L, Zhao X M, et al. scTSSR: gene expression recovery for single-cell RNA sequencing using two side sparse self-representation [J]. Bioinformatics, 2020, 36(10): 3131-3138.
[22]. Wang J, Ma A, Chang Y, et al. scGNN is a novel graph neural network framework for single-cell RNA-Seq analyses [J]. Nature communications, 2021, 12(1): 1882.
[23]. Eraslan G, Simon L M, Mircea M, et al. Single-cell RNA-seq denoising using a deep count autoencoder [J]. Nature communications, 2019, 10(1): 390.
[24]. Wu K E, Yost K E, Chang H Y, et al. BABEL enables cross-modality translation between multiomic profiles at single-cell resolution [J]. Proceedings of the National Academy of Sciences, 2021, 118(15): e2023070118.
[25]. Wen H, Ding J, Jin W, et al. Graph neural networks for multimodal single-cell dataintegration [C]//Proceedings of the 28th ACM SIGKDD conference on knowledge discovery and data mining. 2022: 4153-4163.
[26]. Gao C, Liu J, Kriebel A R, et al. Iterative single-cell multi-omic integration using online learning [J]. Nature biotechnology, 2021, 39(8): 1000-1007.
[27]. Dou J, Liang S, Mohanty V, et al. Bi-order multimodal integration of single-cell data [J]. Genome biology, 2022, 23(1): 112.
[28]. Cao K, Hong Y, Wan L. Manifold alignment for heterogeneous single-cell multi-omics data integration using Pamona [J]. Bioinformatics, 2022, 38(1): 211-219.
[29]. Cao Z J, Gao G. Multi-omics single-cell data integration and regulatory inference with graph-linked embedding [J]. Nature Biotechnology, 2022, 40(10): 1458-1466.
[30]. Talwar D, Mongia A, Sengupta D, et al. AutoImpute: Autoencoder based imputation of single-cell RNA-seq data [J]. Scientific reports, 2018, 8(1): 16329.
[31]. Cao Y, Zhao X, Tang S, et al. scButterfly: a versatile single-cell cross-modality translation method via dual-aligned variational autoencoders [J]. Nature Communications, 2024, 15(1): 2973.
[32]. Cohen Kalafut N, Huang X, Wang D. Joint variational autoencoders for multimodal imputation and embedding [J]. Nature machine intelligence, 2023, 5(6): 631-642.
[33]. PBMC from a Healthy Donor, Single Cell Multiome ATAC Gene Expression Demonstration Data by Cell Ranger ARC 1.0.0. 10X Genomics https: //support.10xgenomics.com/single-cell-multiome-atacgex/datasets/1.0.0/pbmc_granulocyte_sorted_ 10k (2020).
[34]. Chen S, Lake B B, Zhang K. High-throughput sequencing of the transcriptome and chromatin accessibility in the same cell [J]. Nature biotechnology, 2019, 37(12): 1452-1457.
[35]. Ma S, Zhang B, LaFave L M, et al. Chromatin potential identified by shared single-cell profiling of RNA and chromatin [J]. Cell, 2020, 183(4): 1103-1116. e20.
[36]. Muto Y, Wilson P C, Ledru N, et al. Single cell transcriptional and chromatin accessibility profiling redefine cellular heterogeneity in the adult human kidney [J]. Nature communications, 2021, 12(1): 2190.