


1. Introduction
The act of predicting inflation has substantial ramifications for the formulation of policies and the understanding of numerous economic aspects. The rate of inflation, which refers to the percentage change in prices for goods and services over a given period, has a direct influence on the purchasing power of the ordinary consumer. In the United States, the measurement of this rate is determined by the examination of fluctuations in the Consumer Price Index (CPI). The significance of inflation stems from its substantial impact on crucial economic aspects, such as the transfer of income and the pricing of financial instruments.
The precise forecasting of inflation holds significant importance for a range of stakeholders. However, improving the accuracy of a basic univariate model is a difficult task due to the presence of structural instability in the inflation of the United States [1]. specifically, For instance, the Atkeson-Ohanian model [2], which employs a random walk forecast, has demonstrated comparable levels of accuracy in predicting inflation as models based on the Philip Curve since the mid-1980s. Therefore, there is a growing importance in examining the suitability of machine learning models for macroeconomic forecasting. In recent decades, there has been an increasing scholarly focus on the utilization of machine learning models for the analysis of economic and financial data. The Artificial Neural Network (ANN) is a widely utilized machine learning technique in the field of inflation forecasting [3-4]. When comparing Neural Networks to classic econometric models, it is evident that Neural Networks are driven by data and exhibit improved efficacy in forecasting intricate non-linear datasets. Long Short-Term Memory (LSTM) neural networks, which fall under the category of Recurrent Neural Networks (RNNs), are widely employed in the field of time series forecasting owing to their capacity to effectively retain and exploit lengthy data sequences. A recent study on inflation forecasting has revealed that LSTM models provide superior performance compared to other models such as autoregressive model (AR), ANN, and Markov-switching models [5]. However, LSTM models exhibit similar performance to seasonal autoregressive models (SARIMA).
The Autoregressive Integrated Moving Average (ARIMA) model is widely recognized as one of the most popular and effective methods for forecasting univariate time series. This approach was introduced by Box and Jenkins [6]. The ARIMA model has a high level of accuracy in capturing diverse linear patterns. A drawback of the ARIMA model is its inherent inability to effectively capture non-linear and intricate patterns seen in real-world time series data. In order to exploit the comparative advantage offered by linear and nonlinear forecasting models, we adopt a hybrid methodology first introduced by Zhang [7]. This strategy entails the integration of ANN and ARIMA to effectively forecast various forms of time series data. The incorporation of decomposition approach is observed in several research to enhance the hybrid framework [8-10]. One extensively utilized technique in the field of economics and finance is the wavelet analysis [11]. In the hybrid structure framework, Khandelwal et al.conducted an experiment utilizing a hybrid ARIMA-ANN strategy that incorporates the discrete wavelet transform (DWT) [9]. The results of their experiment demonstrate that this technique outperforms Zhang's hybrid model in terms of forecasting accuracy. This study employs a hybrid model that combines the LSTM and SARIMA models, utilizing the DWT technique, to predict inflation in the United States. The objective of this study is to examine the potential improvement in forecasting accuracy of U.S. inflation through the implementation of a hybrid technique. The accuracy of the hybrid model is evaluated by a one-step rolling-window methodology, and its performance is compared to that of separate models, specifically Random Walk, LSTM, ARIMA, and SARIMA. Furthermore, a comparative analysis is conducted between our hybrid approach and Zhang's established hybrid method in order to assess the efficacy of the DWT.
2. Methodology
The author assesses the predictive performance of univariate time series forecasting models through the utilization of two metrics: Mean Squared Error (MSE) and Mean Absolute Error (MAE). The predictions employed in our study employ a single step rolling window methodology, utilizing an expanding window technique. We have included every monthly Consumer Price Index (CPI) data accessible from January 1980 to June 2023, comprising a total of 762 observations. The training dataset consists of Consumer Price Index (CPI) inflation data starting from January 1980 and ending in June 2017. On the other hand, the test dataset covers the period from July 2017 to June 2023, which accounts for approximately 10% of the complete dataset.
2.1. Data
To measure inflation, the monthly growth in the unadjusted Consumer Price Index (CPI) for all items in the United States is utilized. The data was obtained from the FRED database, which is maintained by the Federal Reserve Bank of St. Louis. The specific series identifier for the data is CPALTT01USM657N. The CPI inflation captures the fluctuations in the average price of a specific assortment of goods and services over a given period. It is widely regarded as the principal gauge of inflation within the United States, shown in figure 1. The monthly growth rate of the CPI refers to the percentage change observed in comparison to the preceding period.
In the case of LSTM and Hybrid techniques, the inflation series is transformed into a supervised learning format by restructuring it with a window size of 12 months. This allows for the prediction of future values based on the preceding window. During the data processing phase, the input time series is subjected to normalization, wherein it is rescaled to a range of 0 to 1, before being utilized for fitting the LSTM model and hybrid techniques. After the generation of forecasts, they undergo a process of re-scaling to their original units in order to facilitate their evaluation.
\( {y^{ \prime }}=\frac{y-{y_{min}}}{{y_{max}}-{y_{min}}} \) (1)
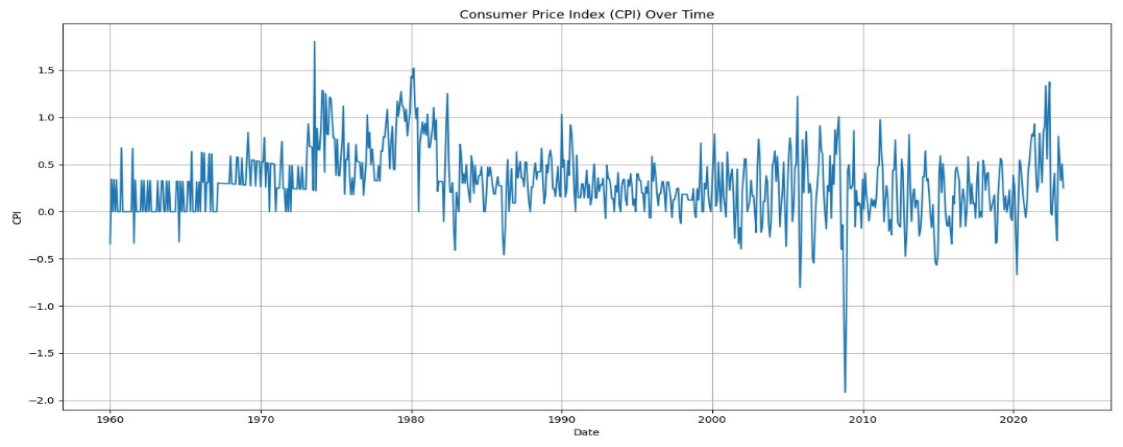
Figure 1: non-seasonally adjusted consumer price index of United States
2.2. Forecasting models
2.2.1. Random Walk (Atkeson-Ohanian)
The Atkeson-Ohanian (AO)[2] forecast is simply a random walk type of forecast that forecasts GDP inflation based on the average of previous 4 quarters. This model is considered as the benchmark. In the case of CPI inflation, we consider using the average of last 12 months to forecast. The AO forecast could be formulated as follows:
\( {y_{t}}={y_{t-1}}+{ϵ_{t}} \) (2)
2.2.2. ARIMA/SARIMA
The Autoregressive Integrated Moving Average (ARIMA) is a prominent model for forecasting univariate time series. An ARIMA(p,d,q) model can be written as:
\( {y_{t}}={ϕ_{1}}{y_{t-1}}+…+{ϕ_{p}}{y_{t-p}}+{θ_{1}}{ε_{t-1}}+…+{θ_{q}}{ε_{t-q}}+{ε_{t}} \) (3)
where \( {y_{t}} \) is the inflation at time \( t \) and \( {ε_{t}} \) is the white noise. p,d,q are the order for the autoregressive process(AR), intergration(I), moving average process, respectively. As U.S CPI consists of Signiant seasonal pattern due to various of economic factors, seasonal ARIMA(SARIMA) model is considered. SARIMA extends ARIMA by incorporating seasonal patterns to the model. The SARIMA(p,d,q)(P,D,Q)s model can mathematically expressed as follow [12]:
\( {ϕ_{p}}(B){Φ_{P}}({B^{s}}){∇^{d}}∇_{s}^{D}{z_{t}}={θ_{q}}(B){Θ_{Q}}({B^{s}}){ε_{t}} \) (4)
where P,D,Q is the order for seasonal autoregressive process, intergration, moving average process, respectively, and s indicates the seasonal period. The autogressions is implemented by the Statsmodel library in python. Base on AIC and BIC metric, we consider SARIMA (0,1,3) (1,0,1)12 and ARIMA (1,1,1).
2.2.3. LSTM
Long Short-Term Memory (LSTM) is a specific type of Recurrent neural network (RNNs) introduced by Hochreiter and Schmidhuber [13]. Over the years, LSTMs have gained significant traction in domains such as time series forecasting and natural language processing. While Recurrent RNNs are inherently designed to handle sequential data by preserving short-term dependencies through their recurrent connections, they adjust their weights using an algorithm called backpropagation through time. However, RNNs face challenges with the exploding and vanishing gradient problem. LSTMs address this by incorporating cell state \( C \) that enable the efficient storage and retrieval of long-term patterns, enhancing the capabilities of the traditional RNN architecture. The short-term state \( {h_{t}} \) represents the LSTM's updated memory at time step t based on the current input \( {y_{t}} \) and previous sequences The LSTM is structured around three gates: the forget gate \( {f_{t}} \) , the input gate \( {i_{t}} \) , and the output gate \( {o_{t}} \) . A illustration of the LSTM memory cell's structure is presented in Figure 2. The forget gate \( {f_{t}} \) dictates which fraction of the previous cell state \( {C_{t-1}} \) is retained. Simultaneously, the input gate it manages the update of the cell state with new computed values. The output gate \( {o_{t}} \) modulates how the current cell state \( {C_{t}} \) . influences the short-term state \( {h_{t}} \) ,which represents the LSTM's output for the current timestep. Given an input series represented by \( y=({y_{1}},{y_{2}},…,{y_{T}}) \) and its corresponding output \( ({h=(h_{1}},{h_{2}},…,{h_{T}}) \) ,the following equations define the dynamics of the LSTM sequence [14]:
\( {i_{t}}=σ({W_{yi}}\cdot {y_{t}}+{W_{hi}}\cdot {h_{t-1}}+{b_{i}}) \) (input gate)
\( {f_{t}}=σ({W_{yf}}\cdot {y_{t}}+{W_{hf}}\cdot {h_{t-1}}+{b_{f}}) \) (forget gate)
\( {o_{t}}=σ({W_{yo}}\cdot {y_{t}}+{W_{ho}}\cdot {h_{t-1}}+{b_{o}}) \) (output gate)
\( \widetilde{{C_{t}}}=tanh{({W_{yC}}\cdot {y_{t}}+{W_{hC}}\cdot {h_{t-1}}+{b_{C}})} \)
\( {C_{t}}={f_{t}}×{C_{t-1}}+{i_{t}}×\widetilde{{C_{t}}} \)
\( {h_{t}}={o_{t}}×tanh{({C_{t}})} \) (5)
In the equations, \( {W_{yf}},{W_{yi}},{W_{yC}},{W_{yo}} \) connect the input \( {y_{t}} \) to the LSTM gates and cell. Similarly, \( {W_{hf}},{W_{hi}},{W_{hC}},{W_{ho}} \) link the short-term state \( {h_{t-1}} \) to them. The biases are \( {b_{f}},{b_{i}},{b_{C}} \) and \( {b_{o}} \) respectively. The \( \) sigmoid activation function is denoted as \( σ. \)
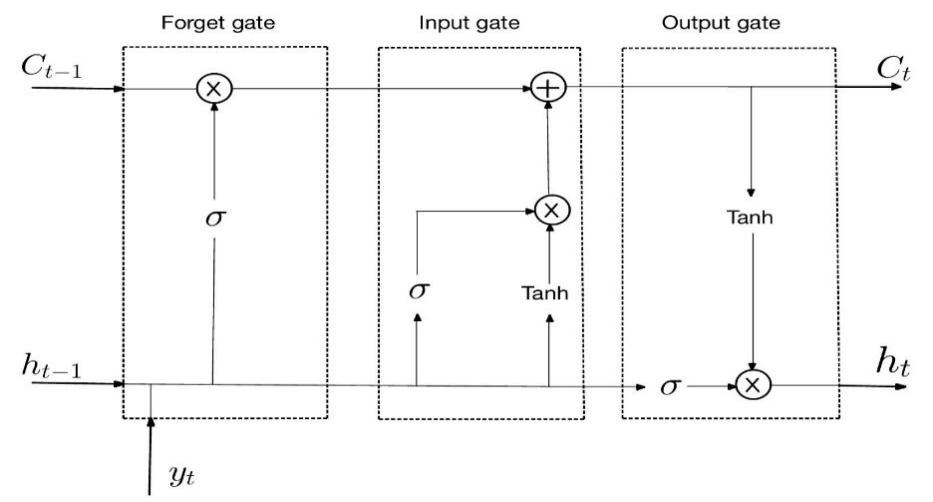
Figure 2: LSTM memory cell architecture
The LSTM model is implemented with the Keras library in Python. Throughout the training process, the Adam optimization algorithm was employed to minimize the loss function. We conducted a hyperparameter grid search, emphasizing the number of units in the LSTM layer, the Dropout rate, the Dense layer, and the number of epochs. The optimal model configuration consists of 24 memory units in the LSTM layer and a dropout rate of 0.11, and is trained with 1000 epoch. To prevent overfitting, early stopping was applied with a patience level of 10. We constructed the LSTM model with the Keras library in Python.
2.2.4. LSTM-SARIMA
Real-world time series data frequently exhibit a combination of both linear and nonlinear patterns [7]. Neither linear nor nonlinear predictions can ensure optimal results in every situation. Stock and Watson evaluated nonlinear models like ANNs and autoregressive approaches by forecasting 215 macroeconomic series [3]. They discovered that ANNs excel primarily in short-term forecasts for a limited number of series, such as wages, employment, and exchange rates.
In the literature, several studies present a hybrid approach that combines linear and nonlinear forecasting methods to enhance prediction accuracy. Zhang proposed hybrid methodology that combines ANN and ARIMA to forecast both nonlinear and linear patterns. In Zhang’s model [7], it is assumed a time series \( {y_{t}} \) could be decomposed into a linear autoregressive component and a nonlinear component: \( {y_{t}}={N_{t}}+{L_{t}} \) . In Zhang’s hybrid method, ARIMA is first applied to capture and the linear pattern \( {L_{t}} \) , then the residual \( {e_{t}} \) of the ARIMA forecast is subsequently fitted by ANN to capture the nonlinearity in the data structure. The ANN model for can be represented as:
\( {e_{t}}=f({e_{t-1}},{e_{t-2}},…,{e_{t-n}})+{ϵ_{t}} \) (7)
where is \( f \) a nonlinear function determined by the neural network and \( {ϵ_{t}} \) is the white noise. Finally, the ANN forecast \( {\hat{N}_{t}} \) is combined with \( {\hat{L}_{t}} \) from ARIMA model to produce the final forecast.To adapt Zhang’s hybrid method for inflation forecasting, we consider using SARIMA given that U.S. inflation is recognized for its seasonal patterns. Additionally, for the nonlinear prediction component, we consider using LSTM. The LSTM and SARIMA will be configured with the same hyperparameters.
2.2.5. DWT-LSTM-SARIMA
In this study, we consider a hybrid of LSTM-SARIMA model based on discrete wavelet transform. In the first phase, we apply the first order Daubechies wavelet(db1) [15] to decompose the CPI into approximate coefficients ( \( cA \) ) and detail coefficients ( \( cD \) ) executed using the PyWavelets library in Python. This decomposition aids in isolating the inherent information in the time series. The decomposition process could be represented as follows
\( cA[k]=\sum _{t}{y_{t}}\cdot g[2k-t] \)
\( cD[k]=\sum _{t}{y_{t}}\cdot h[2k-t] \) (8)
where \( g \) and \( h \) are the low-pass and high-pass filters of db1. In the next phase, the Inverse Discrete Wavelet Transform (IDWT) is applied to obtain the reconstructed approximation and detailed coefficients: \( y_{t}^{approx},y_{t}^{detail} \) . Note that
\( {y_{t}}=y_{t}^{approx}+y_{t}^{detail} \) (9)
In the established literature, it is often assumed that approximation and detailed component obtained by DWT corresponds to the nonlinear and linear patterns in the data e.g, [7-8]. Based on the Augmented Dickey-Fuller (ADF) test, the reconstructed approximation and detail components have p-values of 0.0225, respectively. These results suggest that neither component is stationary. Following [16], We assume they contain both linear and nonlinear components.
With decomposed series, we use the hyrbid LSTM-SARIMA method to forecast each component. For reconstructed detailed coefficients, SARIMA (4,0,1)(0,0,2)12 is applied to capture the linear patterns, and LSTM is subsequently fitted to gain information on the non-linearity pattern. Then, the forecast are combined to obtain predicted reconstructed approximation. Simultaneously, we use the same hyrbid LSTM-SARIMA model to obtain approximation coefficients forecast with SARIMA (2,1,2)(1,0,1)12. The LSTM model uses the configuration. Finally, these combined forecasts are aggregated to produce the final forecast.
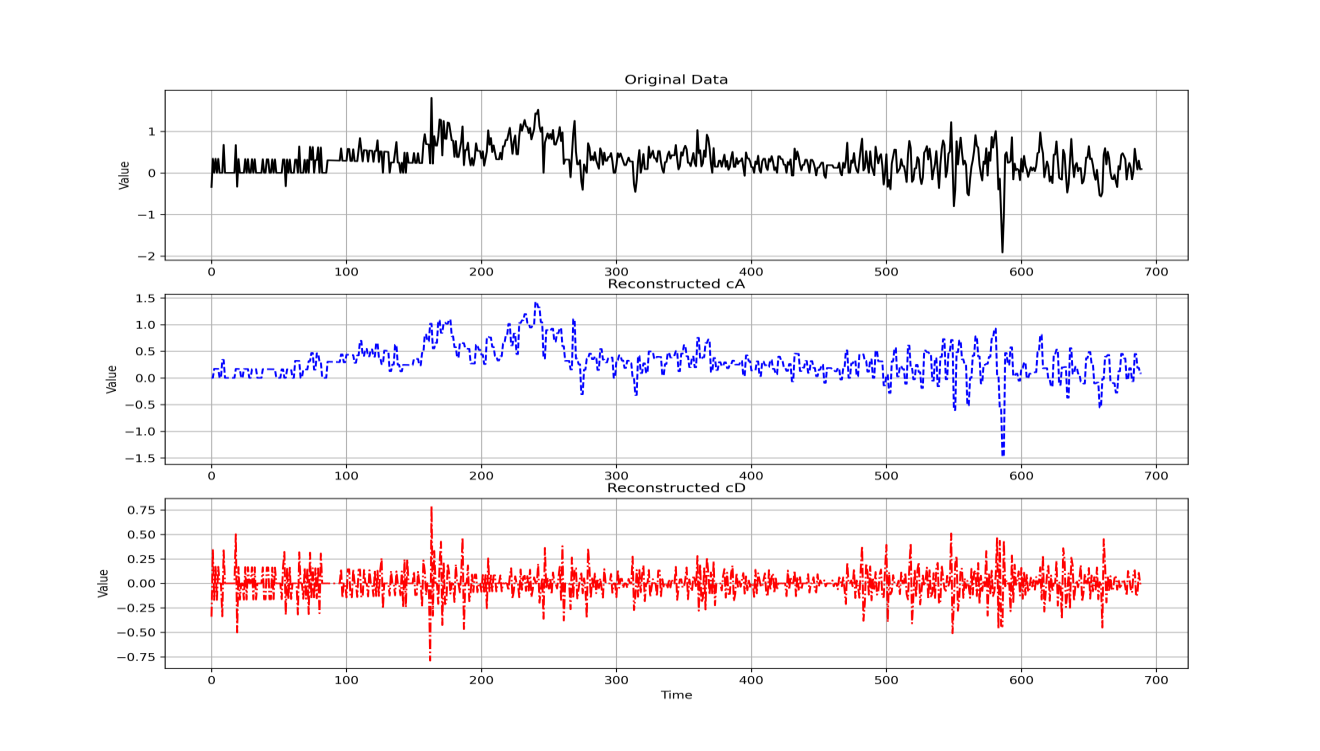
Figure 3: Plots of original input series, reconstructed approximation and reconstructed details
After segmenting the data (as shown in Figure 3), the SARIMA model, which is commonly used for time-series forecasting, is employed to provide initial forecasts for both the reconstructed detail and approximation components. In order to enhance the precision of these forecasts, the residuals, which represent the discrepancy between the SARIMA forecasts and the reconstructed data, are subjected to modeling using a recurrent neural network known as LSTM. This approach generates forecasts based on LSTM modeling. The LSTM forecasts are subsequently integrated with the initial SARIMA forecasts to provide a composite forecast for both the detail and approximation components.
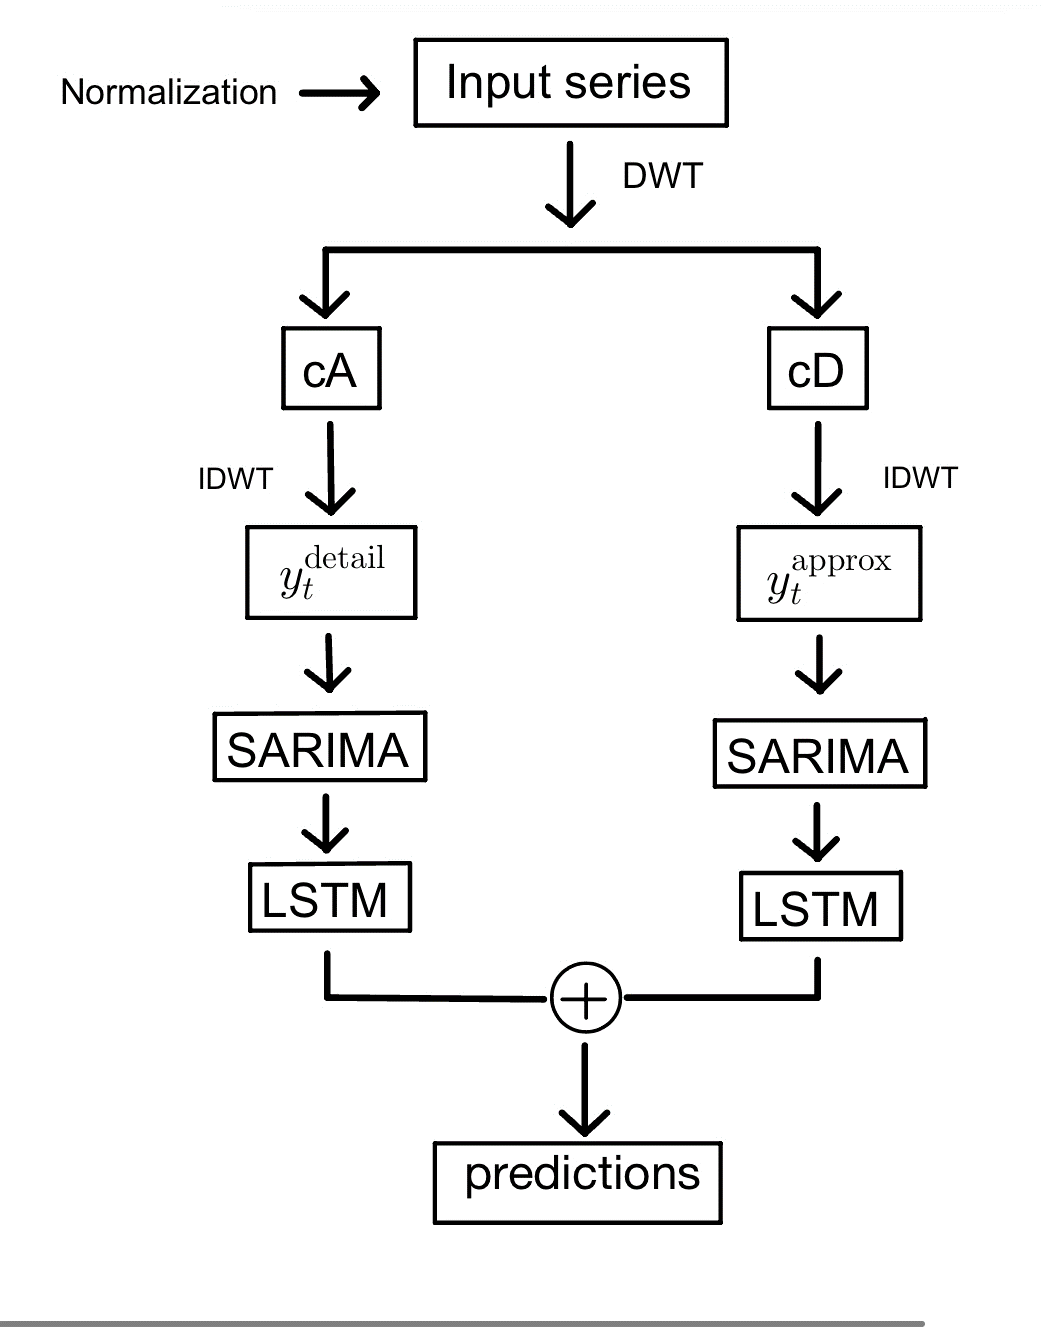
Figure 4: Flow chart of the proposed hybrid method
3. Results and analysis
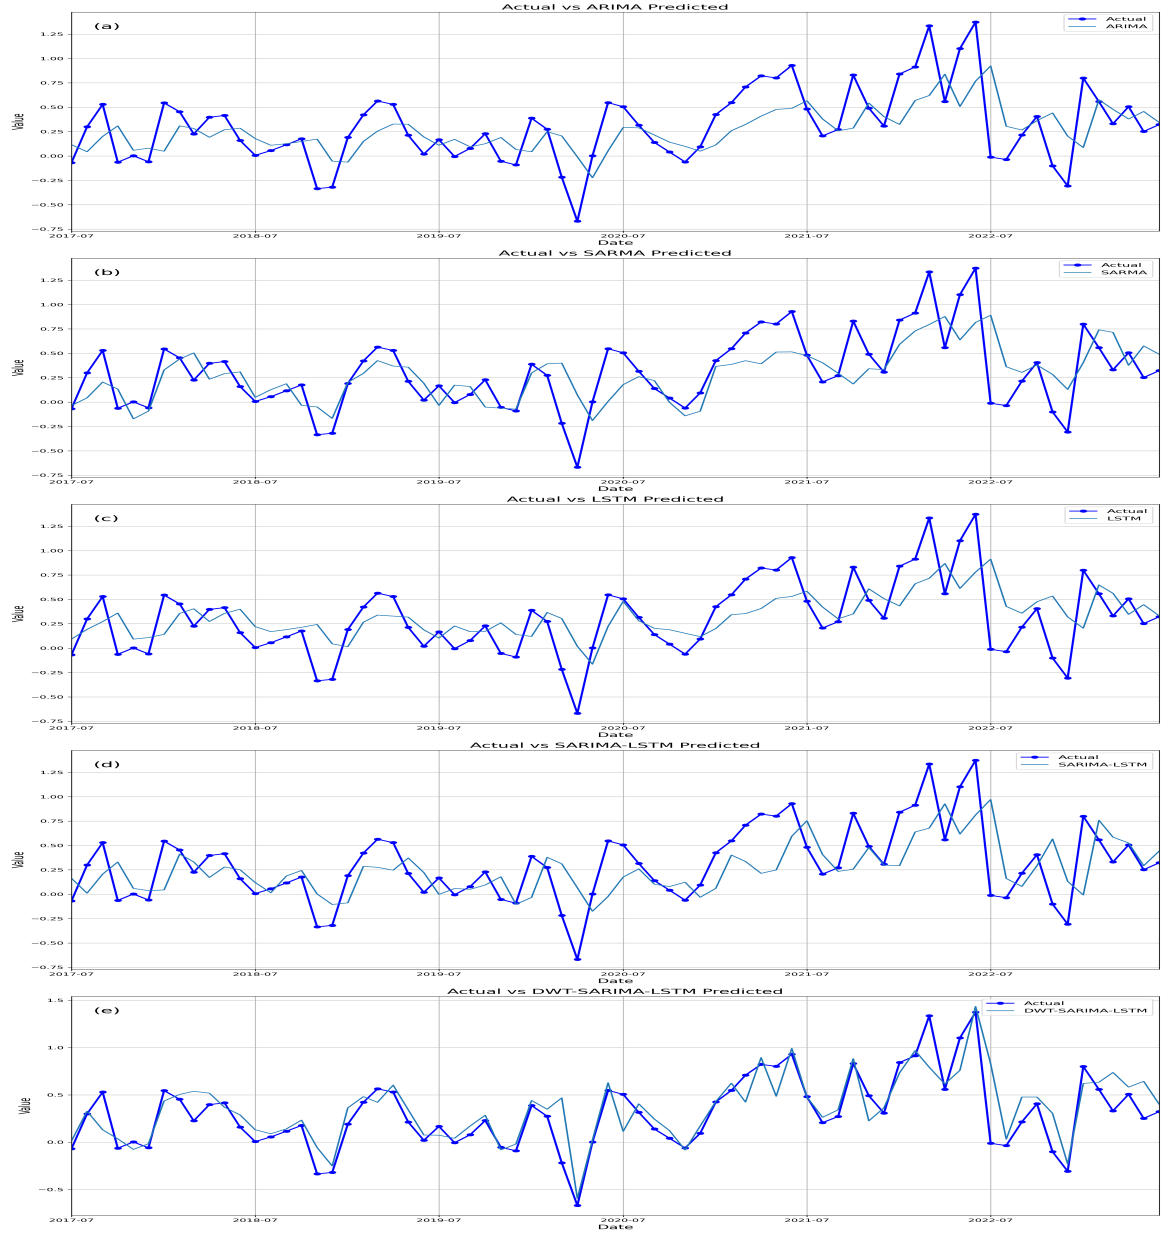
Figure 5: Actual CPI of the test period (01/07/2017-01/06/2023) verses one of step ahead forecast (a)ARIMA, (b) SARIMA, (c) SARIMA-LSTM, (d) DWT-SARIMA-LSTM
The present work has undertaken experiments to forecast actual Consumer Price Index (CPI) data using a one-step rolling window technique. The results are presented in Table I. All of the models exhibit superior performance compared to the benchmark AO random walk model, as evidenced by lower values in both the mean squared error (MSE) and mean absolute error (MAE) metrics. The findings of a prior study support the notion that SARIMA has superior performance compared to LSTM in the context of one-step rolling forecast [5]. The hybrid LSTM-SARIMA technique exhibits a marginally superior performance compared to LSTM, while falling short of the performance achieved by SARIMA. The hybrid model based on the discrete wavelet transform (DWT) has superior performance compared to all other models in the context of one-step rolling window forecasting. It achieves the lowest mean squared error (MSE) of 0.045 and mean absolute error (MAE) of 0.14. Figure 5 displays the observed Consumer Price Index (CPI) in comparison to the predicted CPI generated by several univariate models, with the exception of the AO random walk model. Moreover, the hybrid model utilizing the discrete wavelet transform (DWT) exhibits robust efficacy in predicting exceptional values, particularly the Consumer Price Index (CPI) in June 2022, which witnessed a record high in U.S. inflation during the past four decades.
Table 1: Forecasting results of non-seasonally adjusted CPI for the last 5 years
RW | ARIMA | SRIMA | LSTM | Hybrid | Hybrid(DWT) | |
MSE | 0.1274 | 0.1060 | 0.0855 | 0.1003 | 0.0854 | 0.0452 |
MAE | 0.2814 | 0.2537 | 0.2251 | 0.2518 | 0.2245 | 0.1428 |
4. Conclusion
Accurate forecasting of inflation holds significant importance in providing guidance for both policy formulation and private sector decision-making. Previous studies have employed both linear and nonlinear forecasting models in order to make predictions about inflation. Over the course of time, a multitude of research endeavors in the field of time series forecasting have formulated hybrid methodologies that amalgamate several linear and nonlinear forecasting techniques in order to augment the accuracy of forecasts. The aim of this study is to assess the suitability of a hybrid methodology for predicting inflation. Furthermore, we utilize decomposition techniques, such as the Discrete Wavelet Transform (DWT), to enhance the precision of our forecasts. The present work employs a hybrid LSTM-SARIMA approach based on the discrete wavelet transform (DWT) for the purpose of forecasting inflation. The hybrid model demonstrated superior accuracy in the one-step rolling forecast of the last 72 months of CPI when compared to each separate model. One potential constraint of this investigation is the only utilization of the db1 wavelet. Future study should investigate the potential application of db2 and db4 wavelets in order to achieve a more extensive decomposition. One potential constraint of this research is the only utilization of the db1 wavelet. Future research should investigate the potential application of various types of wavelets for Discrete Wavelet Transform (DWT) or alternative decomposition approaches, as suggested by previous studies [10].
References
[1]. J. H. Stock and M. W. Watson, "Why has US inflation become harder to forecast?," Journal of Money, Credit and Banking, vol. 39, pp. 3-33, 2007.
[2]. A. Atkeson and L. E. Ohanian, "Are Phillips curves useful for forecasting inflation?," Federal Reserve Bank of Minneapolis Quarterly Review, vol. 25, no. 1, pp. 2-11, 2001.
[3]. J. H. Stock and M. W. Watson, "A comparison of linear and nonlinear univariate models for forecasting macroeconomic time series," 1998.
[4]. E. Nakamura, "Inflation forecasting using a neural network," Economics Letters, vol. 86, no. 3, pp. 373-378, 2005.
[5]. A. Almosova and N. Andresen, "Nonlinear inflation forecasting with recurrent neural networks," Journal of Forecasting, vol. 42, no. 2, pp. 240-259, 2023.
[6]. G. E. Box and G. M. Jenkins, "Time Series Analysis: Forecasting and Control," San Francisco: Holdan-Day, 1970.
[7]. G. P. Zhang, "Time series forecasting using a hybrid ARIMA and neural network model," Neurocomputing, vol. 50, pp. 159-175, 2003.
[8]. Babu, C. Narendra, and B. Eswara Reddy. "A moving-average filter based hybrid ARIMA–ANN model for forecasting time series data." Applied Soft Computing 23 (2014): 27-38.
[9]. I. Khandelwal, R. Adhikari, and G. Verma, "Time series forecasting using hybrid ARIMA and ANN models based on DWT decomposition," Procedia Computer Science, vol. 48, pp. 173-179, 2015.
[10]. M. Khashei and M. Bijari, "A novel hybridization of artificial neural networks and ARIMA models for time series forecasting," Applied Soft Computing, vol. 11, no. 2, pp. 2664-2675, 2011.
[11]. S. Kim and F. In, "The relationship between stock returns and inflation: new evidence from wavelet analysis," Journal of Empirical Finance, vol. 12, no. 3, pp. 435-444, 2005.
[12]. G. E. P. Box, G. M. Jenkins, and G. C. Reinsel, Time Series Analysis: Forecasting and Control, vol. 734, John Wiley & Sons, 2011.
[13]. S. Hochreiter and J. Schmidhuber, "Long short-term memory," Neural Computation, vol. 9, no. 8, pp. 1735-1780, 1997.
[14]. A. Géron, Hands-on Machine Learning with Scikit-Learn, Keras, and TensorFlow, O'Reilly Media, Inc., 2022.
[15]. I. Daubechies, Ten Lectures on Wavelets, Society for Industrial and Applied Mathematics, 1992.
[16]. W. Zhang, Z. Lin, and X. Liu, "Short-term offshore wind power forecasting-A hybrid model based on Discrete Wavelet Transform (DWT), Seasonal Autoregressive Integrated Moving Average (SARIMA), and deep-learning-based Long Short-Term Memory (LSTM)," Renewable Energy, vol. 185, pp. 611-628, 2022.
Cite this article
Li,S. (2024). Inflation Forecasting Using a Hybrid LSTM-SARIMA Model Based on Discrete Wavelet Transform. Advances in Economics, Management and Political Sciences,73,100-108.
Data availability
The datasets used and/or analyzed during the current study will be available from the authors upon reasonable request.
Disclaimer/Publisher's Note
The statements, opinions and data contained in all publications are solely those of the individual author(s) and contributor(s) and not of EWA Publishing and/or the editor(s). EWA Publishing and/or the editor(s) disclaim responsibility for any injury to people or property resulting from any ideas, methods, instructions or products referred to in the content.
About volume
Volume title: Proceedings of the 2nd International Conference on Financial Technology and Business Analysis
© 2024 by the author(s). Licensee EWA Publishing, Oxford, UK. This article is an open access article distributed under the terms and
conditions of the Creative Commons Attribution (CC BY) license. Authors who
publish this series agree to the following terms:
1. Authors retain copyright and grant the series right of first publication with the work simultaneously licensed under a Creative Commons
Attribution License that allows others to share the work with an acknowledgment of the work's authorship and initial publication in this
series.
2. Authors are able to enter into separate, additional contractual arrangements for the non-exclusive distribution of the series's published
version of the work (e.g., post it to an institutional repository or publish it in a book), with an acknowledgment of its initial
publication in this series.
3. Authors are permitted and encouraged to post their work online (e.g., in institutional repositories or on their website) prior to and
during the submission process, as it can lead to productive exchanges, as well as earlier and greater citation of published work (See
Open access policy for details).
References
[1]. J. H. Stock and M. W. Watson, "Why has US inflation become harder to forecast?," Journal of Money, Credit and Banking, vol. 39, pp. 3-33, 2007.
[2]. A. Atkeson and L. E. Ohanian, "Are Phillips curves useful for forecasting inflation?," Federal Reserve Bank of Minneapolis Quarterly Review, vol. 25, no. 1, pp. 2-11, 2001.
[3]. J. H. Stock and M. W. Watson, "A comparison of linear and nonlinear univariate models for forecasting macroeconomic time series," 1998.
[4]. E. Nakamura, "Inflation forecasting using a neural network," Economics Letters, vol. 86, no. 3, pp. 373-378, 2005.
[5]. A. Almosova and N. Andresen, "Nonlinear inflation forecasting with recurrent neural networks," Journal of Forecasting, vol. 42, no. 2, pp. 240-259, 2023.
[6]. G. E. Box and G. M. Jenkins, "Time Series Analysis: Forecasting and Control," San Francisco: Holdan-Day, 1970.
[7]. G. P. Zhang, "Time series forecasting using a hybrid ARIMA and neural network model," Neurocomputing, vol. 50, pp. 159-175, 2003.
[8]. Babu, C. Narendra, and B. Eswara Reddy. "A moving-average filter based hybrid ARIMA–ANN model for forecasting time series data." Applied Soft Computing 23 (2014): 27-38.
[9]. I. Khandelwal, R. Adhikari, and G. Verma, "Time series forecasting using hybrid ARIMA and ANN models based on DWT decomposition," Procedia Computer Science, vol. 48, pp. 173-179, 2015.
[10]. M. Khashei and M. Bijari, "A novel hybridization of artificial neural networks and ARIMA models for time series forecasting," Applied Soft Computing, vol. 11, no. 2, pp. 2664-2675, 2011.
[11]. S. Kim and F. In, "The relationship between stock returns and inflation: new evidence from wavelet analysis," Journal of Empirical Finance, vol. 12, no. 3, pp. 435-444, 2005.
[12]. G. E. P. Box, G. M. Jenkins, and G. C. Reinsel, Time Series Analysis: Forecasting and Control, vol. 734, John Wiley & Sons, 2011.
[13]. S. Hochreiter and J. Schmidhuber, "Long short-term memory," Neural Computation, vol. 9, no. 8, pp. 1735-1780, 1997.
[14]. A. Géron, Hands-on Machine Learning with Scikit-Learn, Keras, and TensorFlow, O'Reilly Media, Inc., 2022.
[15]. I. Daubechies, Ten Lectures on Wavelets, Society for Industrial and Applied Mathematics, 1992.
[16]. W. Zhang, Z. Lin, and X. Liu, "Short-term offshore wind power forecasting-A hybrid model based on Discrete Wavelet Transform (DWT), Seasonal Autoregressive Integrated Moving Average (SARIMA), and deep-learning-based Long Short-Term Memory (LSTM)," Renewable Energy, vol. 185, pp. 611-628, 2022.