


1. Introduction
In today's society with an ever-changing economic and financial system, most people do not have a deep understanding of investment. For the purpose of providing investors with basic investment framework, this paper will hence transform the understanding about industries and companies into specific investment suggestions by deeply understanding the correlation between the variables that affect market value of company.
Throughout history, financial returns have been one of the most important considerations for investors, and in today's world with diverse companies, the in-depth financial analysis of the target company will be necessary as regard to earn profit from investment. In China, high-tech enterprises in the early stage were adopting free business model to promote the development of enterprises and improve the economic benefits of enterprises through attracting the attention of the audiences and advertising [1]. Before writing this paper, the relevant analysis about Tencent Company, as an example, found that the company's market cap and ROE has a negative linear relationship, which means that the higher the company's market value, the lower profits the investors can earn from it. However, the market value and the market sales ratio have a strong positive linear relationship. Therefore, this paper intends to study whether all industries are in the similar situation, and finally achieve the purpose to enable investors to make profits by analyzing relevant financial factors.
Initially, investors should consider the whole financial metrics in combination, rather than only one or two. Although return on equity (ROE) is a relatively accurate valuating index for companies, but it has the disadvantage that it cannot judge risk factors, is not tested by cash flow, and is not the only factor that determines investment decisions for investors. Therefore, when conducting in-depth financial analysis in the target company, it should be combined with other indicators such as Price-to-Sales Ratio, P/E Ratio and etc. to form a holistic financial report.
Secondly, investors should also pay attention into the company fundamentals and the industry prospect. The success of a company depends on not only its financial situation, but also on the prospects of the industry. Investors need to have a comprehensive understanding of the competitive landscape, market demand, technology and etc. of the target companies in order to assess their future profitability more accurately. In enterprises, investors tend to pay more attention to long-term economic returns rather than short-term profits, so they should be cautious and make final and rational investment decisions to avoid blindly pursuing high market value or low Price-to-Sales Ratio [1]. The unpredictable changes of the market can bring risks to investment, so investors should fully consider their risk-tolerance before making any investment decisions, and choose the appropriate investment strategy according to their personal background and circumstances.
In general, return is one of the important indicators that investors pay attention to, but it is not the only one. In the investment process, deeply financial analysis is the only one part of it. At the same time, in order to obtain more stable investment returns, it is also necessary for investors to keep rational and prudent in combination with the company's basic system and industry prospects. In order to help investors establish a clearer and more accurate investment direction, this paper decides to conduct a rigorous correlation analysis from three industries fields, that are, New Energy, Technology and Clothing.
2. Investment Background
2.1. New Energy Field
With increasing global environmental pollution problems, majority of countries in the world implement sustainable strategies, and the new energy field has experienced disruptive breakthrough on their turnover. The "13th Five-Year Plan" aims to maintain China's energy security and improve the energy supply, and proposed to build and improve the contemporary energy system. During this period, many environmentally friendly substitutes appeared in the markets, and the application scale of new energy had expanded [2]. BYD, NIO, and Tesla as a foreign brand had seen their market values soared in recent years, especially between 2019 and 2022 (see Figure 1, 2, and 3). Each brand has its own competitive advantages, BYD became the industry leader in 2022 with sales of more than 1.8 million new energy vehicles, and the market share was as high as 27% which was the highest in the field of new energy in 2020, they not only have advanced blade batteries, but also DM-I super hybrid technology to enhance their competitive advantage. In January of 2023, BYD also launched its Yang Wang series: Yang Wang-U8 and Yang Wang-U9, the former one is the SUV with high-performance, in which only a turnaround is enough to surprise the majority of consumers, the latter one is high-performance pure electric super sport car, it also is one of the fewer domestic brands that can selling price can above one million CNY as a pure electric vehicles, the whole body is equipped with higher technology and beautiful streamlined body helped BYD to reach a higher place in the field. NIO and other companies also followed BYD, this trend can directly reflect the country's major breakthrough in new energy technology, so both investors and company operators are looking forward to make profit from it, thus the new energy industry is currently attracting more and more consumers and investors, and also becoming the focus in the investment world.
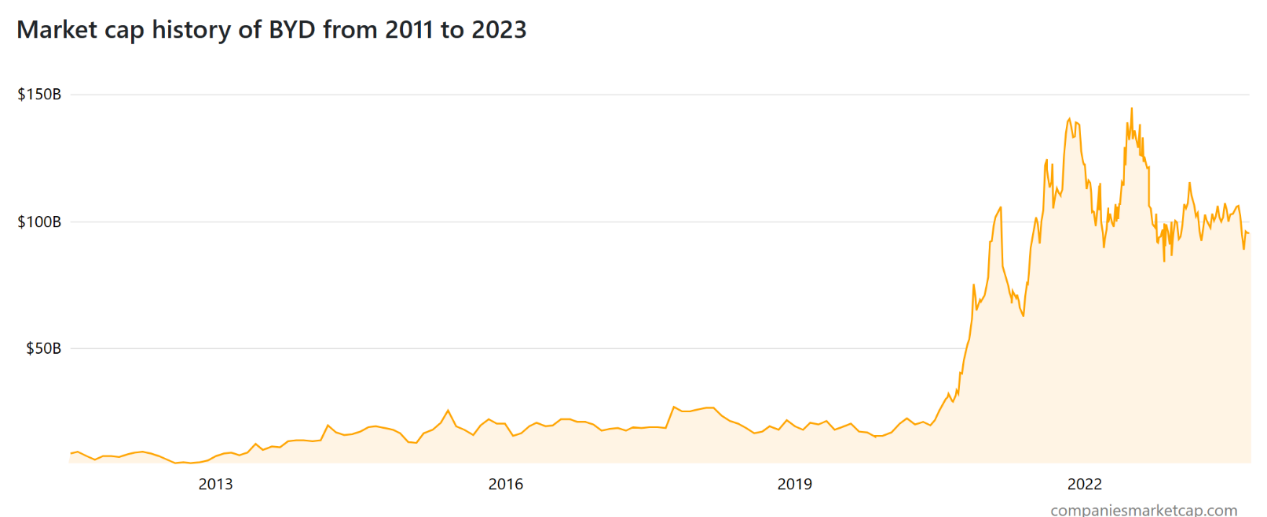
Figure 1: The changes on Market Cap. in BYD from 2011 to 2023.
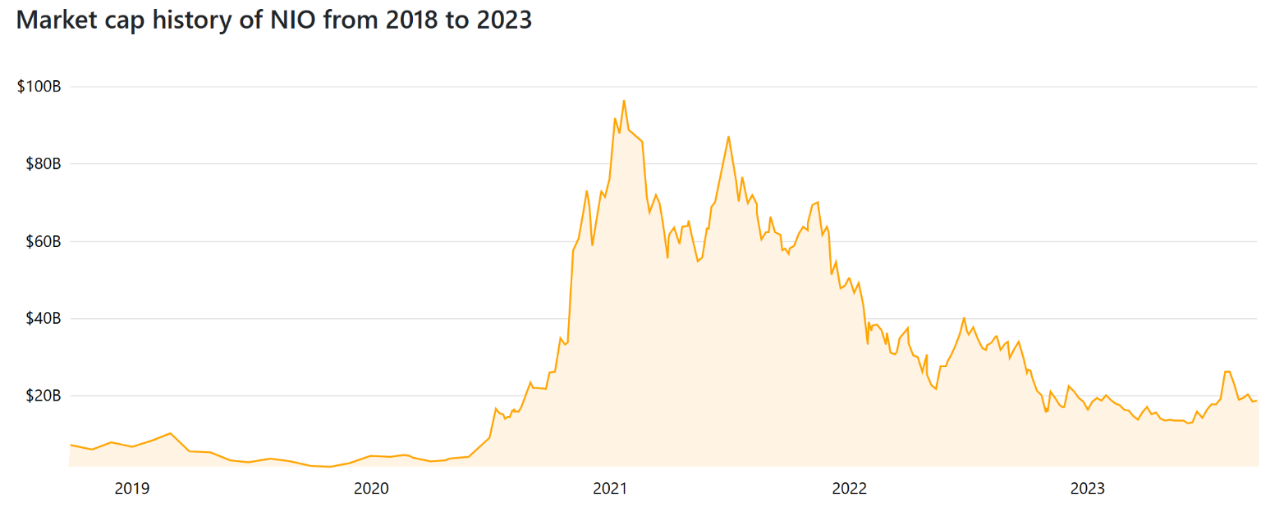
Figure 2: The changes on Market Cap. in NIO from 2018 to 2023.
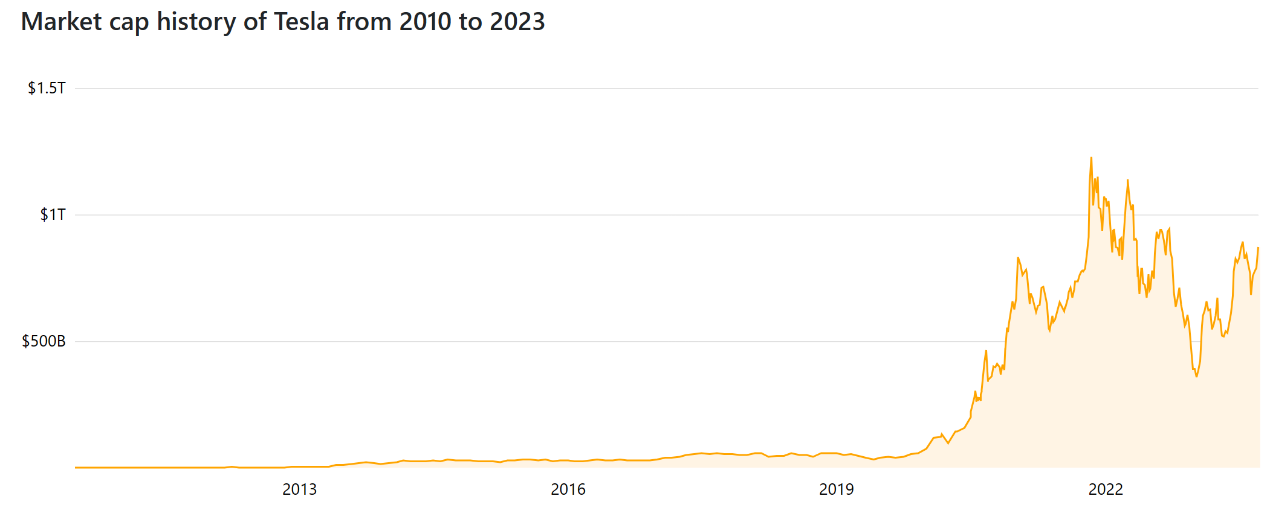
Figure 3: The changes on Market Cap. in Tesla from 2010 to 2023.
2.2. Technology Field
Technology is an indispensable power for a country’s development, and the development prospects of relevant companies have been naturally favored by the majority of investors. For example, Google, apart from its powerful Android operating system, it also has invested a lot of research in computer—the unit of storing information by the chips is Bit for ordinary computers, that will copy some of information into redundant "error-correcting" Bits. If an error occurs due to an accident caused by the disturbance of cosmic ray, the chip can find the problem and fix it with the help of "error correction" Bits [3]. However, human is not able to achieve this breakthrough based on the current technology. Under this situation, the relevant authorities had proposed a "Quantum Error Correction" scheme, and Google then reported two different sizes of logical qubits in the latest paper. One of them is to use 17 qubits and it is able to recover from one error at one time. Another larger version is to use 49 qubits that is able to recover from two simultaneous errors, and performs slightly better than the previous version [3]. Google thus achieved a further breakthrough, which brings great value to Google itself, and naturally investors will be willing to invest their money into such a promising company. As to Microsoft, it has a pivotal position in life as one of the most prominent software corporations, countless office workers had been facilitated after a series of Microsoft office software were invented like Microsoft Word, Microsoft PowerPoint and so on. The Microsoft cloud can supply unlimited technical resource, imagination or in other aspects are limited as a person, but technology will never become a bottleneck for further development [4]. Therefore, Microsoft does deserve to be considered to invest by investors for its strength and ambition alone. Apple also has many factors worth to be invested. For one thing, it is a world-renowned large corporation that famous for innovation. Apple became famous since the IPOD was invented in 2001, followed by the IPHONE has been released in 2007 with a higher sale, which facilitated Apple became one of the companies owning the highest profits in the market. Then the original structure of the smart phone market collapsed, and the market share of Apple, until to now, has been in a leading position [5]. For another thing, Apple sells its innovative products on a global scale to achieve its strategic goals, that covers a wide range of markets and full of industry prospects [5].
2.3. Clothing Field
Clothes are one of People's daily necessities. The consumer demand for individuation and customization in the garment industry has become increasingly obvious, and the reform of mass customization production has become a crucial form in terms of transformation and upgrading in the garment industry [6]. The pursuits in young generation for personalization and high requirements for dressing also illustrate the attitude of the future consumers against their life, they are growing up in the world with Internet and social media, happy to express themselves and refusing to dress the same cloth with others. Therefore, the era of mass customization of clothing is arriving [6]. Based on the consumer’s requirements on diversified types of costumes, companies in this field will definitely cater to consumers' aesthetic taste in the future to gain their recognition and thus earn profit from transactions.
3. Data Analysis
3.1. New Energy Field
Table 1: The relationship among Market Cap., Price-to-Sales Ratio, ROE, P/E Ratio, PEG index (2019-2023 in BYD).
BYD | B. | C. | D. | E. | F. |
1 | |||||
BC | 0.309953 | 1 | |||
BD/CD | -0.43833 | 0.171604 | 1 | ||
BE/BF/EF | 0.230316 | 0.934104 | 0.377493 | 1 | |
CE/CF/DE/DF | 0.708357 | 0.369712 | 0.288458 | 0.391578 | 1 |
*Note: B- Market Cap; C-Price-to-Sales Ratio; D-ROE; E: P/E Ratio; F: PEG Index.
Table 2: The relationship among Market Cap., Price-to-Sales Ratio, ROE, P/E Ratio, PEG index (2019-2023 in Tesla).
Tesla | B. | C. | D. | E. | F. |
1 | |||||
BC | 0.734666 | 1 | |||
BD/CD | 0.564745 | 0.075371 | 1 | ||
BE/BF/EF | 0.489241 | 0.056048 | 0.38197 | 1 | |
CE/CF/DE/DF | 0.047227 | 0.629937 | -0.46866 | -0.01242 | 1 |
*Note: B- Market Cap; C-Price-to-Sales Ratio; D-ROE; E: P/E Ratio; F: PEG Index.
Table 3: The relationship among Market Cap., Price-to-Sales Ratio, ROE, P/E Ratio, PEG index (2019-2023 in NIO).
NIO | B. | C. | D. | E. | F. |
1 | |||||
BC | 0.904452 | 1 | |||
BD/CD | -0.12488 | -0.45301 | 1 | ||
BE/BF/EF | 0.760641 | 0.710032 | -0.24155 | 1 | |
CE/CF/DE/DF | 0.781999 | 0.967112 | -0.64348 | 0.69679 | 1 |
*Note: B- Market Cap; C-Price-to-Sales Ratio; D-ROE; E: P/E Ratio; F: PEG Index.
Shown in Table 1, 2 and 3, the correlation analysis between ROE, market share ratio, P/E Ratio, PEG and their Market Cap. in the past five years of the three new energy listed enterprises illustrate that the R-square between Market Cap. and Price-to-Sales Ratio in BYD is less than 0.5, which proves that the correlation between the two companies is not strong. That is, only the Market Cap. is insufficient to reflect BYD's market sales ratio (stock value). On the other hand, its Market Cap. is negatively correlated with ROE and it’s close to 0.5, indicating that when the Market Cap. is high, the shareholders will get relatively less financial return. However, Tesla, especially NIO, has a relatively strong R-Square (0.9) in terms of Market Cap. and price-to-sales ratio, which means that the higher the price-to-sales ratio, the higher the Market Cap. of the company is, but in general, the value of stock investing is low when the Price-to-Sales Ratio is high. Meanwhile, the Price-to-Sales Ratio and ROE are negatively correlated, that is, the higher the Price-to-Sales Ratio, the lower stock value is, then fewer people made invest, whereas the company will offer a higher shareholder returns to encourage people to invest. In the data analysis of NIO, there is an obvious positive correlation between market value, P/E ratio and market earnings growth ratio, and the level of P/E ratio can reflect the ratio between stock price and earnings, so it can be judged that when the market value is high, the company's stock price and profitability are relatively high. The higher the P/E ratio, the lower the stock price, and the higher the P/E ratio, the lower the stock investment value for investors. During this period, the Price-to-Sale Ration and the growth rate of PEG Index have a very strong positive correlation, indicating that the lower the value of stock investment, the lower the growth rate of market earnings, and the lower the equity that can be received by shareholders. Because the correlation analysis showed a correlation of nearly 0.7. In terms of the nature of the company itself and its development strategy under China's current national conditions, the field of new energy is very consistent with the national sustainable development strategy. At present, global warming caused by air pollution is becoming more serious year by year, but vehicle exhaust is one of the largest sources of carbon dioxide emissions, and new energy vehicles solve this situation from the root. For example, BYD's CSR report for 2022 states that from the past to the future, they will try their best to minimize carbon dioxide emissions and energy consumption, which will help maintain BYD's stock price and market value at a relatively stable level in the future or increase the company's market value to a large extent [7]. NIO mainly focuses on carbon reduction in the whole life cycle of products and sets vehicle carbon emission targets. In the production process, we continue to increase investment in clean energy by purchasing green electricity and building photovoltaic charging stations, and strive to build a low-carbon logistics system in the park. These related strategies will extend the life of the company and increase its value.
3.2. Technology Field
Table 4: The relationship among Market Cap., Price-to-Sales Ratio, ROE, P/E Ratio, PEG index (2019-2023 in Apple).
APPLE | B. | C. | D. | E. | F. |
1 | |||||
BC | 0.820741 | 1 | |||
BD/CD | 0.634997 | 0.37838 | 1 | ||
BE/BF/EF | 0.570709 | 0.840211 | -0.16603 | 1 | |
CE/CF/DE/DF | -0.29285 | 0.119613 | -0.86421 | 0.597571 | 1 |
*Note: B- Market Cap; C-Price-to-Sales Ratio; D-ROE; E: P/E Ratio; F: PEG Index.
Table 5: The relationship among Market Cap., Price-to-Sales Ratio, ROE, P/E Ratio, PEG index (2019-2023 in Google).
B. | C. | D. | E. | F. | |
1 | |||||
BC | 0.611598 | 1 | |||
BD/CD | 0.840803 | 0.427207 | 1 | ||
BE/BF/EF | 0.189463 | 0.670064 | -0.28124 | 1 | |
CE/CF/DE/DF | -0.40331 | 0.407756 | -0.63627 | 0.767323 | 1 |
*Note: B- Market Cap; C-Price-to-Sales Ratio; D-ROE; E: P/E Ratio; F: PEG Index.
Table 6: The relationship among Market Cap., Price-to-Sales Ratio, ROE, P/E Ratio, PEG index (2019-2023 in Microsoft).
Microsoft | B. | C. | D. | E. | F. |
1 | |||||
BC | 0.715314 | 1 | |||
BD/CD | 0.192485 | 0.154278 | 1 | ||
BE/BF/EF | 0.898351 | 0.840633 | 0.08829 | 1 | |
CE/CF/DE/DF | 0.74265 | 0.46868 | -0.42049 | 0.803512 | 1 |
*Note: B- Market Cap; C-Price-to-Sales Ratio; D-ROE; E: P/E Ratio; F: PEG Index.
Shown in Table 4, 5 and 6, apart from Microsoft, there are strong correlation both between the market value with the Price-to-Sales Ratio and market Cap. with ROE of the other two companies, that is, the market value of the company can be reflected by the Price-to-Sales Ratio to a large extent, and the higher Market Cap., the higher the profit of shareholders can be earned. However, Microsoft, which belongs to the same technology field, cannot provide the corresponding high of shareholders return when the Market Cap. is high. The data analysis in Column 4 of Microsoft and APPLE demonstrates that there is a very strong correlation between the market capitalization at both P/E Ratio and PEG. That is, when the market capitalization is high, the higher the P/E Ratio is, the lower investing value of stock is at the same time. However, the market capitalization in Google cannot reflect the level of P/E Ratio. Also whit is worthy to pay attention is the relationship between ROE and P/E Ratio in APPLE, in which has a higher negative correlation, proving that the company will provide investors with relatively low returns when the value of the stock investment is low. Google released a comprehensive exceeded expectations in the second quarter of 2023 analyst conference call answer summary in the morning at 26 July of 2023 (Beijing time), Google suggested the concept of SGI, AI in the search field will be faster landing from the current market circumstance. Besides, the financial report shows Google's major investment in artificial intelligence computing, It has increased the value of the company's investment in the AI-Search, and Google also believes that security is an important AI application direction, which is as the same as Microsoft standpoint. APPLE, as a large-scale company, proposed that it would regard artificial intelligence and machine learning as the core basic technology, and also improved its potential in the field of AI investment. in the analyst answer summary of the Q3 earnings conference call in 2023. After the release of the mixed reality headset Vision Pro, Retail stores—an important means for the company won the market, and to display APPLE's new products better, and thus greatly improving customer experience and product sales. It can be concluded that each company in the field of science and technology has its own unique means to participate in competition. In the future, the market value of the three companies will rise steadily, but the increase in their market value will reduce the investable value of stocks.
3.3. Clothing Field
Table 7: The relationship among Market Cap., Price-to-Sales Ratio, ROE, P/E Ratio, PEG index (2019-2023 in Adidas).
Adidas | B. | C. | D. | E. | F. |
1 | |||||
BC | 0.987167 | 1 | |||
BD/CD | 0.456843 | 0.338482 | 1 | ||
BE/BF/EF | 0.533347 | 0.647597 | -0.37346 | 1 | |
CE/CF/DE/DF | -0.15639 | -0.05173 | -0.27267 | 0.535215 | 1 |
*Note: B- Market Cap; C-Price-to-Sales Ratio; D-ROE; E: P/E Ratio; F: PEG Index.
Table 8: The relationship among Market Cap., Price-to-Sales Ratio, ROE, P/E Ratio, PEG index (2019-2023 in Anta).
Anta | B. | C. | D. | E. | F. |
1 | |||||
BC | -0.59009 | 1 | |||
BD/CD | -0.78038 | 0.001949 | 1 | ||
BE/BF/EF | -0.41286 | 0.971324 | -0.22286 | 1 | |
CE/CF/DE/DF | -0.47245 | 0.954898 | -0.13454 | 0.954865 | 1 |
*Note: B- Market Cap; C-Price-to-Sales Ratio; D-ROE; E: P/E Ratio; F: PEG Index.
Table 9: The relationship among Market Cap., Price-to-Sales Ratio, ROE, P/E Ratio, PEG index (2019-2023 in Nike).
Nike | B. | C. | D. | E. | F. |
1 | |||||
BC | 0.953181 | 1 | |||
BD/CD | 0.538035 | 0.373979 | 1 | ||
BE/BF/EF | 0.507299 | 0.690024 | -0.38512 | 1 | |
CE/CF/DE/DF | 0.825296 | 0.948667 | 0.072019 | 0.873202 | 1 |
*Note: B- Market Cap; C-Price-to-Sales Ratio; D-ROE; E: P/E Ratio; F: PEG Index.
Shown in Table 7, 8 and 9, Adidas is an important brand in the field of sports equipment products, with brand culture as the core and product innovation to upgrade their marketing strategy. So, a slight rise in the company's market value will reduce its stock investment value because the relevance is up to 0.987. Adidas stated that in the future, the value chain will continue to develop in the direction of achieving the original material climate and direction, so that all the employees of the company will be sustainable in their development [8]. It indicates that Adidas' domestic and foreign development strategies are in line with the national sustainability strategy, will be favored by the government and consumers, and the future value market will stabilize or rise to a higher position. Finally, Adidas needs to constantly increase its sensitivity and predictability, pay attention to new changes in the industry and the market, and constantly adjust and change in order to succeed in the development of future economic markets [8]. According to a report by Nike, as an international company, this year, because global and regional economic and political factors have affected international trade and related protectionist measures have led to increased company costs, it can be judged that the environment in which Nike operates is relatively bad [9]. The increase in costs means an increase in sales prices, and from an economic point of view, the result is a decrease in sales and ultimately a fall in market value. In addition, the company’s commitment to actively use clean energy to improve overall energy efficiency and reduce carbon emissions in production [10]. Overall, it has a long-term and clear sustainability strategy that can effectively boost its reputation and market value in the future.
Table 10: The relationship among Market Cap., Price-to-Sales Ratio, ROE, P/E Ratio, PEG index (2019-2023 THREE companies in New Energy Field).
New Energy | B. | C. | D. | E. | F. |
1 | |||||
BC | 0.519254 | 1 | |||
BD/CD | -0.39946 | -0.10791 | 1 | ||
BE/BF/EF | 0.303276 | 0.061198 | -0.20808 | 1 | |
CE/CF/DE/DF | 0.136989 | 0.798722 | -0.18831 | 0.046684 | 1 |
*Note: B- Market Cap; C-Price-to-Sales Ratio; D-ROE; E: P/E Ratio; F: PEG Index.
Table 11: The relationship among Market Cap., Price-to-Sales Ratio, ROE, P/E Ratio, PEG index (2019-2023 THREE companies in Technology Field).
Technology | B. | C. | D. | E. | F. |
1 | |||||
BC | 0.409228 | 1 | |||
BD/CD | 0.640495 | 0.267908 | 1 | ||
BE/BF/EF | 0.562564 | 0.68348 | 0.125372 | 1 | |
CE/CF/DE/DF | 0.236836 | -0.03865 | 0.04322 | 0.428401 | 1 |
*Note: B- Market Cap; C-Price-to-Sales Ratio; D-ROE; E: P/E Ratio; F: PEG Index.
Table 12: The relationship among Market Cap., Price-to-Sales Ratio, ROE, P/E Ratio, PEG index (2019-2023 THREE companies in Clothing Field).
Clothing | B. | C. | D. | E. | F. |
1 | |||||
BC | 0.102111 | 1 | |||
BD/CD | 0.648446 | 0.451613 | 1 | ||
BE/BF/EF | 0.042519 | 0.102093 | -0.35608 | 1 | |
CE/CF/DE/DF | 0.590577 | -0.05057 | 0.079889 | 0.463427 | 1 |
*Note: B- Market Cap; C-Price-to-Sales Ratio; D-ROE; E: P/E Ratio; F: PEG Index.
Through comprehensive analysis from Table 10, 11 and 12, the PEG Index in the three popular companies in the new energy field is more likely to reflect their Price-to-Sales Ratio (stock value), because there is a stronger positive correlation between the two evaluating variables. Which represents that the higher PEG Index can cause the higher Price-to-Sales Ratio which indicating the lower investing value of its stock. The PEG Index can reflect the ratio between its P/E Ratio and its expected profit growth, and the lower PEG Index demonstrates that its share price may be underestimated, meaning that it has the higher investing value. In the Technology Field, it demonstrates that the higher Market Cap. can cause the higher Price-to-Sales Ratio, which demonstrates that the investing value of the stock will be lower and vice versa [11]. For companies in the Clothing Field, the P/E ratio is a better valuation indicator because there is a 0.6 of positive correlation between the Market Cap. and the Price-to-Sales Ratio. However, the P/E ratio can reflect the investment risk of the stock, and the lower the value of the P/E ratio, the lower investing risk, so in the Clothing Field, the higher risk of investment could be reflected by the higher stock price.
4. Conclusion
When it comes to company valuation, various indicators and metrics play a crucial role, but their effectiveness can vary due to factors such as corporate governance systems, economic differences, and operational strategies. Market rate and Return on Equity (ROE) are valuable indicators, but Price-to-Earnings (P/E) Ratio and Price/Earnings-to-Growth (PEG) Index can provide better insights in some cases. The Price-to-Sales Ratio is useful but may require customization based on individual company systems and management practices within the same industry. A company's alignment with a country's sustainable development strategy and government support can significantly boost its market value. However, predicting outcomes accurately can be challenging, especially in a dynamic economic environment. Investors must thoroughly analyze a company's financial data, market conditions, and potential factors influencing its valuation. Since 2023 data is not fully available and risk factors are uncertain, investment decisions should be made cautiously. Cash flows, historical data, and hysteresis should be considered. Moreover, if a company's products or business model no longer align with societal trends, it may consider an enterprise transformation, such as expanding into online sales or digital products. Yet, this transformation may lead to higher unemployment due to skill misalignment. Therefore, a comprehensive analysis and due diligence are essential before investing, given the changing economic environment and national policies. Continual exploration and enhancement of evaluation methods are crucial for successful investment in a rapidly evolving corporate landscape.
Authors Contribution
All the authors contributed equally and their names were listed in alphabetical order.
References
[1]. Zhuang, X. (2022). Exploring Factors Affecting Company Valuation. National Circulation Economy, (6), 85-87.
[2]. Jiang, M. Y. (2022). Investment Value Analysis of Listed Companies in the New Energy Industry. China Collective Economy, (29), 94-96.
[3]. Quantum Computing Reaches Another Milestone. (2023). Electronic Product Reliability and Environmental Testing, 41(2), 113.
[4]. Han, Y. (2012). Microsoft CIO: Focus on Value, Not Cost. Business Value, 2012(8), 138-140.
[5]. Lü, W. C., & Wang, R. H. (2012). Strategic Orientation Analysis of Global Competition for Multinational Companies: A Case Study of Apple Inc. Technology and Innovation Management, 2012(1), 32-34+40.
[6]. Bai, Y. Q., Hou, Q. Y., & Bao, J. P. (2022). Analysis of the Development Trends of the Mass Customization Market in the Clothing Industry Based on Big Data. Chinese Market, 2022(16), 65-67.
[7]. BYD PDF Viewer (bydglobal.com)ADIDAS. (2021). adidas - Our Targets. Adidas-Group.com. https://www.adidas- group.com/en/sustainability/focus- sustainability/ our-targets/ #/targets-for-2025-and-beyond- environmental- impacts/
[8]. FORM 10-K FORM 10-K. (2023). https://s1.q4cdn.com/806093406/files/doc_downloads/2023/414759-1-_ 5_Nike- NPS-Combo_Form-10-K_WR.pdf
[9]. Anta Sports Products Limited. (2023). https://manager.wisdomir.com/files/394/2023/0330/ 20230330183 001_ 42429205_en.pdf
[10]. Sina Finance. (2023). Google 2nd Quarter Earnings Report Analyst Conference Call Summary. https://finance.sina.com.cn/stock/usstock/c/2023- 07-26/doc- imzcymix7186233.shtml.
[11]. Sina Finance. (2023). Apple 3rd Quarter Earnings Report Analyst Q&A Summary. https://finance.sina.com.cn/stock/usstock/c/2023-08- 04/doc- imzeyvmf5896057.shtml.
Cite this article
Chen,Y. (2024). The Distinction of Evaluation on Companies in Different Fields. Advances in Economics, Management and Political Sciences,74,29-38.
Data availability
The datasets used and/or analyzed during the current study will be available from the authors upon reasonable request.
Disclaimer/Publisher's Note
The statements, opinions and data contained in all publications are solely those of the individual author(s) and contributor(s) and not of EWA Publishing and/or the editor(s). EWA Publishing and/or the editor(s) disclaim responsibility for any injury to people or property resulting from any ideas, methods, instructions or products referred to in the content.
About volume
Volume title: Proceedings of the 3rd International Conference on Business and Policy Studies
© 2024 by the author(s). Licensee EWA Publishing, Oxford, UK. This article is an open access article distributed under the terms and
conditions of the Creative Commons Attribution (CC BY) license. Authors who
publish this series agree to the following terms:
1. Authors retain copyright and grant the series right of first publication with the work simultaneously licensed under a Creative Commons
Attribution License that allows others to share the work with an acknowledgment of the work's authorship and initial publication in this
series.
2. Authors are able to enter into separate, additional contractual arrangements for the non-exclusive distribution of the series's published
version of the work (e.g., post it to an institutional repository or publish it in a book), with an acknowledgment of its initial
publication in this series.
3. Authors are permitted and encouraged to post their work online (e.g., in institutional repositories or on their website) prior to and
during the submission process, as it can lead to productive exchanges, as well as earlier and greater citation of published work (See
Open access policy for details).
References
[1]. Zhuang, X. (2022). Exploring Factors Affecting Company Valuation. National Circulation Economy, (6), 85-87.
[2]. Jiang, M. Y. (2022). Investment Value Analysis of Listed Companies in the New Energy Industry. China Collective Economy, (29), 94-96.
[3]. Quantum Computing Reaches Another Milestone. (2023). Electronic Product Reliability and Environmental Testing, 41(2), 113.
[4]. Han, Y. (2012). Microsoft CIO: Focus on Value, Not Cost. Business Value, 2012(8), 138-140.
[5]. Lü, W. C., & Wang, R. H. (2012). Strategic Orientation Analysis of Global Competition for Multinational Companies: A Case Study of Apple Inc. Technology and Innovation Management, 2012(1), 32-34+40.
[6]. Bai, Y. Q., Hou, Q. Y., & Bao, J. P. (2022). Analysis of the Development Trends of the Mass Customization Market in the Clothing Industry Based on Big Data. Chinese Market, 2022(16), 65-67.
[7]. BYD PDF Viewer (bydglobal.com)ADIDAS. (2021). adidas - Our Targets. Adidas-Group.com. https://www.adidas- group.com/en/sustainability/focus- sustainability/ our-targets/ #/targets-for-2025-and-beyond- environmental- impacts/
[8]. FORM 10-K FORM 10-K. (2023). https://s1.q4cdn.com/806093406/files/doc_downloads/2023/414759-1-_ 5_Nike- NPS-Combo_Form-10-K_WR.pdf
[9]. Anta Sports Products Limited. (2023). https://manager.wisdomir.com/files/394/2023/0330/ 20230330183 001_ 42429205_en.pdf
[10]. Sina Finance. (2023). Google 2nd Quarter Earnings Report Analyst Conference Call Summary. https://finance.sina.com.cn/stock/usstock/c/2023- 07-26/doc- imzcymix7186233.shtml.
[11]. Sina Finance. (2023). Apple 3rd Quarter Earnings Report Analyst Q&A Summary. https://finance.sina.com.cn/stock/usstock/c/2023-08- 04/doc- imzeyvmf5896057.shtml.