


1. Introduction
Stock data analysis and price forecasting is an important research area in the field of finance. As a highly complex, unstable and dynamically changing system, the stock market's price changes are affected by a variety of factors, such as political, economic, social, and technological [1]. Therefore, stock price prediction is a challenging problem but also a problem of great importance [2,3].
The research background of stock data analysis and price prediction can be traced back to the 1960s and 1970s [4]. At that time, with the development of computer technology, people began to try to use computers to predict stock prices [5]. The initial approach was mainly based on technical analysis, i.e. analysing charts and indicators of historical stock prices to predict future price movements [6]. However, this method has many shortcomings, such as only considering the price itself, not being able to take into account the influence of other factors, and being susceptible to the interference of market sentiment and noise [7].
With the increase in data volume and computational power, more sophisticated methods have been used to predict stock prices [8]. Among them, the application of machine learning and deep learning techniques has become a hot research topic. These techniques can use a large amount of historical data to train models to predict future price movements [9]. At the same time, these techniques can also take into account the influence of multiple factors, such as economic indicators, company financial conditions, political events, etc., so as to improve the accuracy of prediction.
The research significance of stock data analysis and price prediction is that it can help investors make more informed investment decisions. By predicting stock price movements, investors can better grasp market opportunities and avoid losses. Also, stock price forecasting can help companies and governments make more informed decisions. Companies can make more reasonable financing plans based on stock price forecasts, and governments can make more effective economic policies based on stock price forecasts [10].
In this paper, the latest stock market data set extracted by Yahoo Finance is selected to explore the law of stock price changes and forecast stock closing prices from the perspective of visualisation, correlation between data set indicator metrics and intrinsic law, which can provide investors with a more accurate and reliable method of predicting stock closing prices, help investors better formulate their investment strategy and decision making, reduce their investment risk, and Improvement of investment returns.
2. Introduction to the dataset
Comprehensive daily trading data from the 10 March 2021 initial public offering (IPO) date to 19 June 2023 for Roblox Corporation stock. The dataset used in this article was extracted from Yahoo Finance, a leading financial platform, and contains key stock market indicators such as opening price, closing price, high price, low price and trading volume for each trading day. The data is organised chronologically, allowing users to analyse stock performance, track trends and gain insight into Roblox Corporation's market capitalisation over a specified period. Researchers, investors, and analysts can use this dataset to perform a variety of quantitative analyses, evaluate investment strategies, and explore the historical performance of Roblox stock. By utilising this comprehensive dataset, valuable patterns, trends, and correlations can be identified to make informed decisions within the context of the dynamic and evolving Roblox Corporation and the overall stock market.
3. Data visualisation
This paper analyses Roblox's stock performance through visualisation, exploring key financial indicators such as historical price and market capitalisation. Calculated metrics such as moving averages of closing prices over time are visualised to explore the patterns of stock changes, as well as to help investors make the right decisions based on historical data and visualised patterns.
Firstly, a line graph of the change in roblox stock price from 2021-2023 is plotted according to the date, from which the trend of stock price change is observed, the line graph is shown in Figure 1.
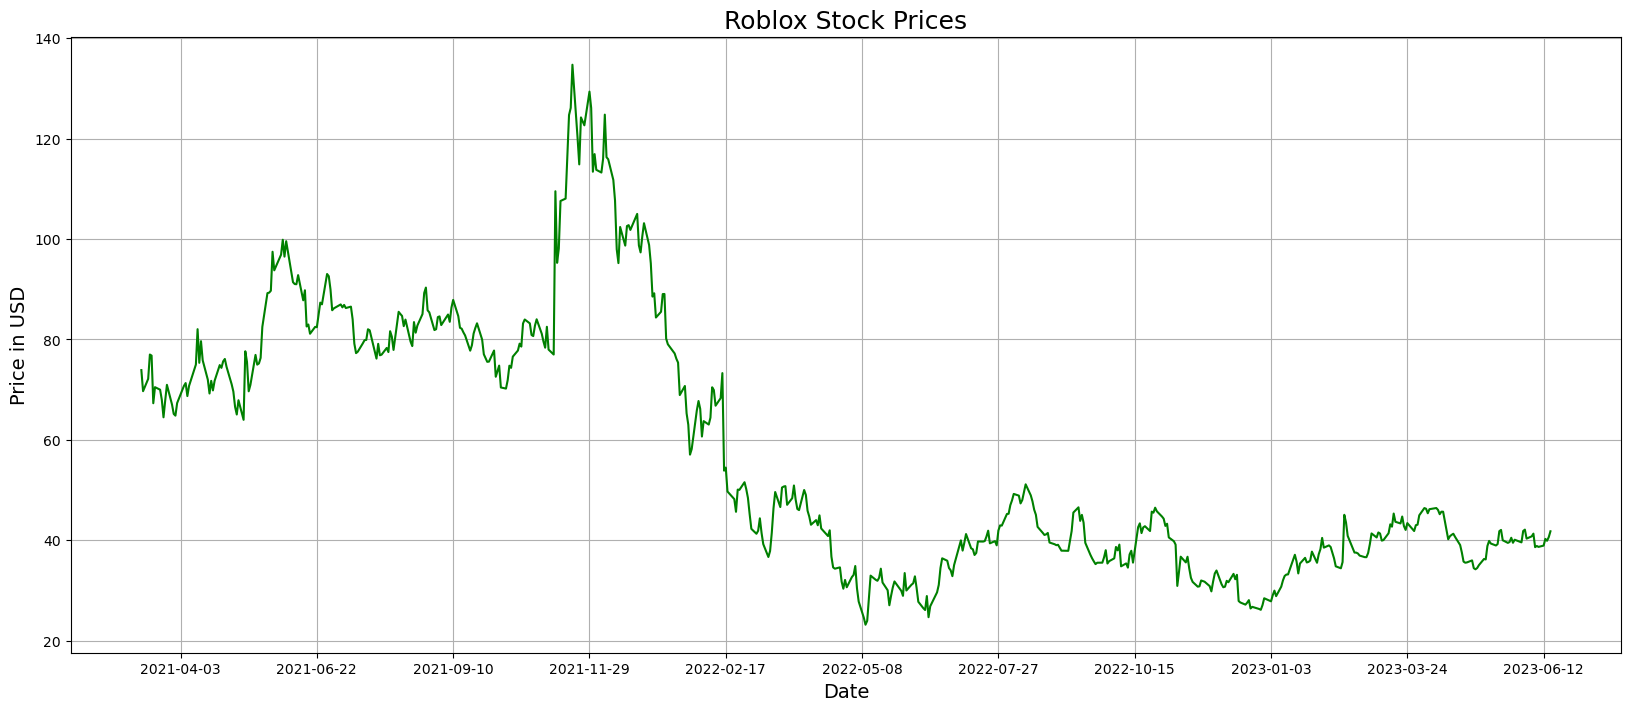
Figure 1: Roblox stock price change.
(Photo credit : Original)
Secondly, statistics by stock market capitalisation are plotted on a line graph of the change in stock market capitalisation from 2021-2023, as shown in Figure 2.
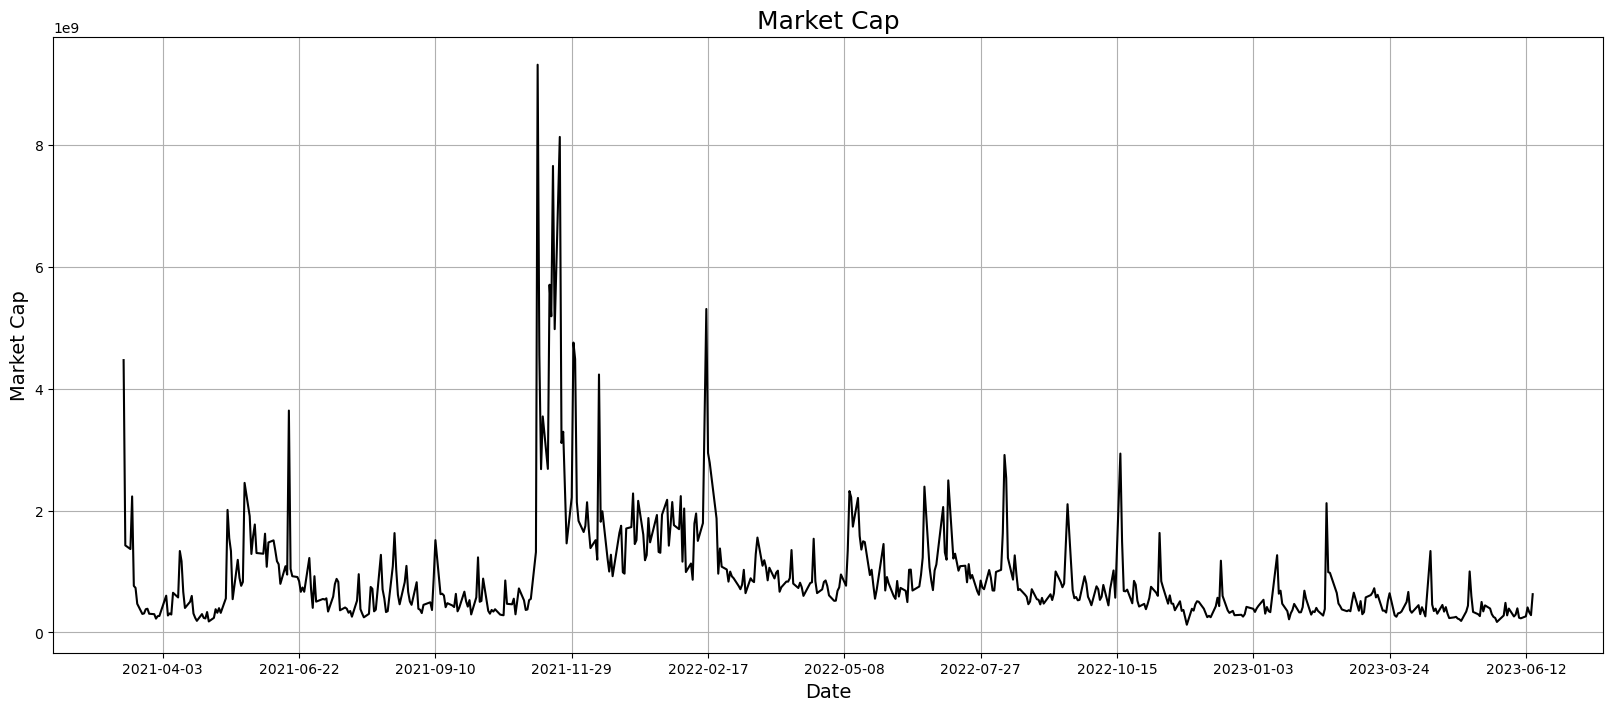
Figure 2: Changes in market value of shares.
(Photo credit : Original)
Then, the cumulative returns of the stocks for the years 2021-2023 are tallied using a line graph, as shown in Figure 3.
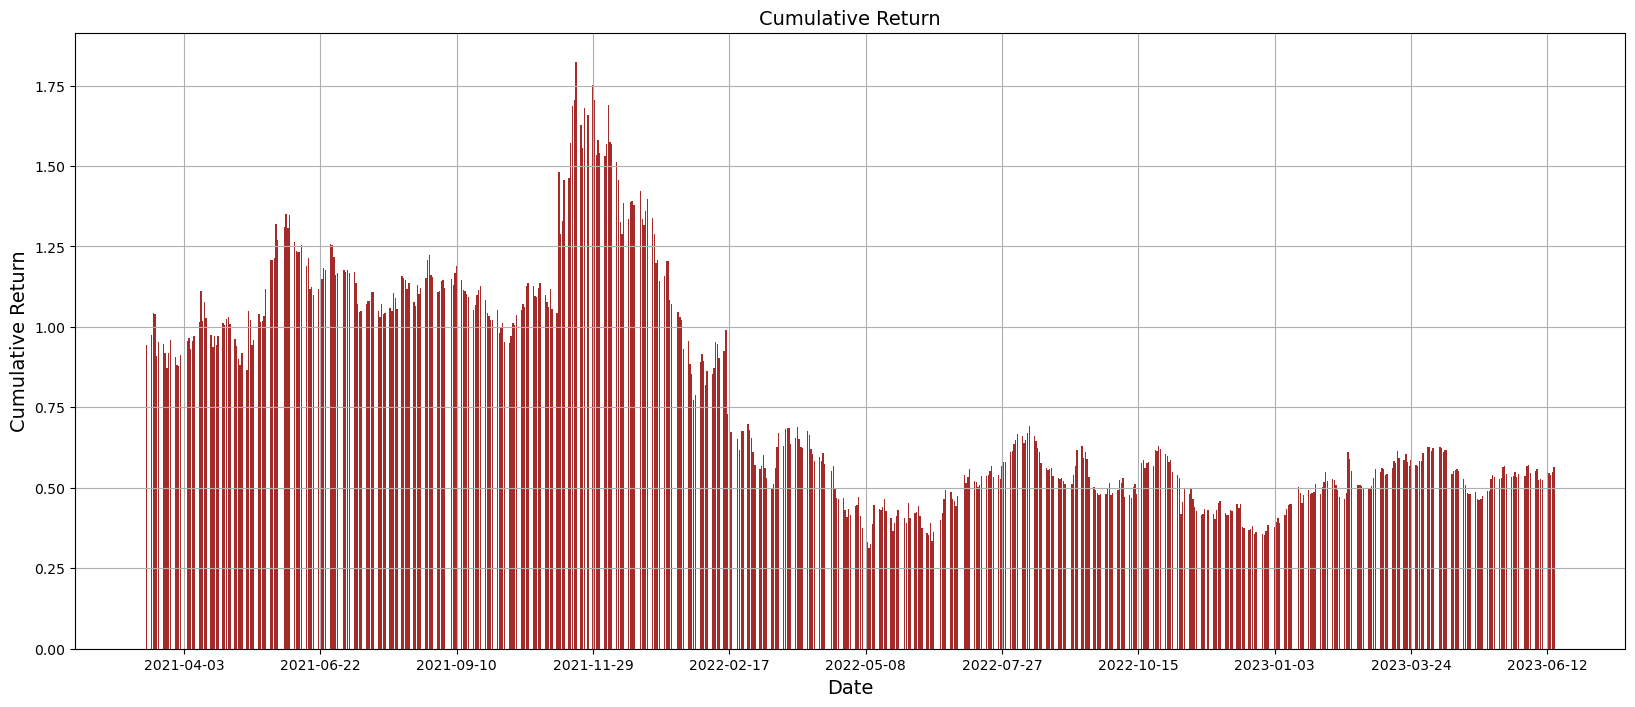
Figure 3: Cumulative return on equity.
(Photo credit : Original)
Moving average is one of the commonly used technical indicators in stock analysis. It is based on the average value of the stock price, and by constantly adding the latest stock price data, a smooth curve is calculated to show the trend of the stock price. Different moving averages can show the trend of the stock price over different time periods, which are plotted as 10-day moving average, 20-day moving average, 50-day moving average and 100-day moving average, as shown in Figure 4. When the stock price is above the moving average, we can consider an uptrend, while when the stock price is below the moving average, we can consider a downtrend.
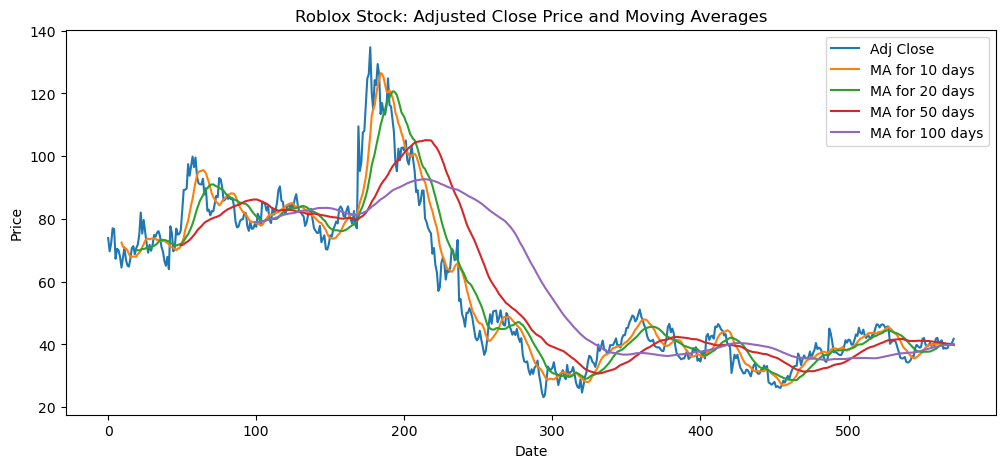
Figure 4: Moving average.
(Photo credit : Original)
4. Correlation analysis
After the statistics of the change rule of the stock indicators, in order to further explore the correlation relationship between the indicators, this paper carries out correlation analysis on the indicators of Open, High, Low, Close, Adj Close and Volume in the stock dataset, initially exploring the correlation relationship between the indicators and preparing for the next data modelling work. The correlation heat map results are shown in Figure 5.
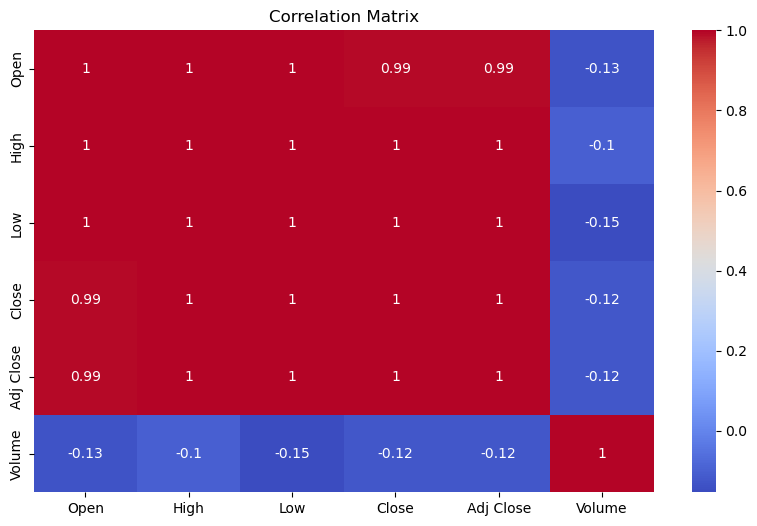
Figure 5: Correlation heat map
(Photo credit : Original)
From the correlation heat map, it can be seen that there is a very strong positive correlation between Open, High, Low, Close and Adj Close, and the degree of positive correlation between each indicator reaches more than 99%, and it can be initially determined that there is a significant correlation between the various parameters of the stock dataset.
5. Experiments and results
In order to further explore the laws that exist between Open, High, Low, Close and Adj Close, this paper takes Open, High, Low, and Adj Close as input parameters and Close as target parameter, aiming to determine the final closing price of the stock through various data of the stock. We first divide the dataset into training set, validation set and test set in the ratio of 6:2:2. The training set is used to train the model, validation set is used to validate the results of the training set and test set is used to test the model. Decision tree regression model, Random Forest Regression model, BP neural network regression model, XGBoost regression model and LightGBM regression model are used for training and testing respectively. The predictive effectiveness of the models was also evaluated using the parameters MSE, RMSE, MAE, MAPE and R2 and the results are shown in Table 1 and Figure 6.
Table 1: Model evaluation. | |||||
Model | MSE | RMSE | MAE | MAPE | R2 |
decision tree regression | 0.299 | 0.547 | 0.47 | 1.298 | 0.989 |
Random Forest Regression | 0.072 | 0.269 | 0.216 | 0.601 | 0.997 |
BP neural network regression | 0.362 | 0.602 | 0.48 | 1.278 | 0.987 |
XGBoost regression | 0.061 | 0.246 | 0.177 | 0.491 | 0.998 |
LightGBM regression | 0.113 | 0.337 | 0.208 | 0.621 | 0.996 |
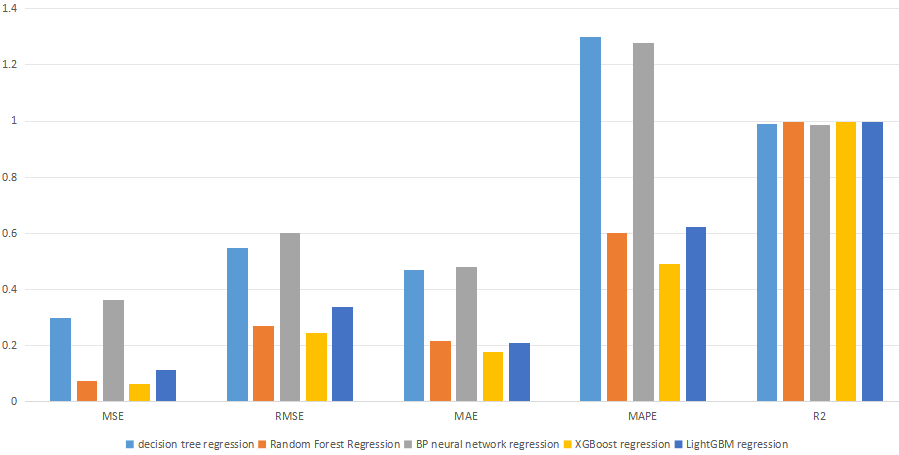
Figure 6: Model evaluation.
(Photo credit : Original)
XGBoost regression model and Random Forest Regression model are the best in the prediction of stock closing price, the MSE of the two is 0.061 and 0.072 respectively; followed by LightGBM regression model and decision tree regression model The prediction results of LightGBM regression model and decision tree regression model are also better, the MSE of the two are 0.113 and 0.299 respectively, but the prediction results of BP neural network regression are worse.
6. Conclusion
In this paper, we predicted the closing price of stocks by using different regression models and compared their predictive effectiveness. Through the experimental results, it can be found that XGBoost regression model and Random Forest Regression model are the best in predicting the closing price of the stock with MSE of 0.061 and 0.072 respectively. followed by LightGBM regression model and decision tree regression model are also better with MSEs of 0.113 and 0.299 respectively, but BP neural network regression has poorer prediction results.
In terms of the characteristics of each model, XGBoost is an integrated learning algorithm based on decision trees, which improves the accuracy of the model by combining multiple decision trees and uses gradient boosting to optimise the model step by step.Random Forest is also an integrated learning algorithm based on decision trees, which constructs multiple decision trees by randomly selecting features and samples and then predicts the results by voting or averaging. voting or averaging to predict the outcome.LightGBM is an algorithm based on Gradient Boosting Decision Tree (GBDT) which speeds up the training process through some optimisation techniques and also uses histogram algorithm to reduce the memory footprint.Decision tree is a classification and regression algorithm based on a tree structure which predicts the outcome of a dataset by recursively dividing the dataset into smaller subsets and constructing a decision tree to predict the outcome.BP neural network is a neural network based regression algorithm which predicts the outcome by combining multiple layers of neurons.
In terms of modelling principles, both XGBoost and Random Forest are integrated learning algorithms based on decision trees, and they are both able to handle nonlinear relationships and high-dimensional data well. At the same time, they both use some optimisation techniques to improve the accuracy and generalisation of the model. In contrast, LightGBM and decision tree are algorithms based on a single decision tree, and their prediction ability may be affected by the overfitting and underfitting problems of the decision tree.Although BP neural network can also deal with nonlinear relationships, but due to its complex training process, it is easy to fall into the local optimal solution, and thus the prediction effect may be be affected.
From the experimental results, XGBoost and Random Forest have the best prediction effect, which may be due to the fact that they can handle nonlinear relationships and high-dimensional data well, and at the same time use some optimisation techniques to improve the accuracy and generalisation ability of the model.The prediction effect of LightGBM and decision tree is also better, which may be due to the fact that they are both decision tree-based algorithms, which can be very good at handling nonlinear relationships and high-dimensional data. decision tree-based algorithms, which can handle nonlinear relationships well.The prediction effect of BP neural network is poorer, probably because its training process is more complicated and easy to fall into the local optimal solution, and it may be affected by problems such as data noise and sample imbalance.
In summary, by comparing the prediction effect of different regression models, this paper finds that XGBoost regression and Random Forest Regression have the best effect on the prediction of stock closing price, followed by LightGBM regression and decision tree regression, while BP neural network regression has poorer prediction results. Analysing the model principles, this may be due to the fact that XGBoost and Random Forest are able to handle non-linear relationships and high dimensional data well, while some optimisation techniques are used to improve the accuracy and generalisation of the model. Whereas other models may have suffered from problems such as overfitting, underfitting, data noise and sample imbalance. The stock market is a highly uncertain market and the volatility of stock prices is affected by a variety of factors, such as political, economic and social factors. By comparing the predictive effects of different regression models, investors can be provided with more accurate and reliable methods of stock closing price prediction, which can help investors to better formulate investment strategies and decisions, reduce investment risks and improve investment returns. This is of great significance to both individual and institutional investors.
References
[1]. Lin W ,Xie L ,Xu H .Deep-Reinforcement-Learning-Based Dynamic Ensemble Model for Stock Prediction[J].Electronics,2023,12(21):
[2]. Haodong H ,Liang X ,Shengshuang C , et al.Stock trend prediction based on industry relationships driven hypergraph attention networks[J].Applied Intelligence,2023,53(23): 29448-29464.
[3]. Jafar H S ,Akhtar S ,Chaarani E H , et al.Forecasting of NIFTY 50 Index Price by Using Backward Elimination with an LSTM Model[J].Journal of Risk and Financial Management,2023,16(10):
[4]. Fangzhao Z .RETRACTED: Extreme learning machine for stock price prediction[J].International Journal of Electrical Engineering Education,2023,60(1_suppl): 3972-3985.
[5]. Bhatta A ,Poudyal P ,Maharjan K D , et al.Assessing Machine Learning's Accuracy in Stock Price Prediction[J].International Journal of Computer (IJC),2023,49(1):46-63.
[6]. Haque S M ,Amin S M ,Miah J , et al.Boosting Stock Price Prediction with Anticipated Macro Policy Changes[J].Journal of Mathematics and Statistics Studies,2023,4(3):29-34.
[7]. Dongbo M ,Da Y ,Maojun H , et al.VGC-GAN: A multi-graph convolution adversarial network for stock price prediction[J].Expert Systems With Applications,2024,236.
[8]. Li C Y ,Huang Y H ,Yang P N , et al.Stock Market Forecasting Based on Spatiotemporal Deep Learning[J].Entropy,2023,25(9):
[9]. Sichong C .High-frequency stock return prediction using state-of-the-art deep learning models[J].International Journal of Financial Engineering,2023,10(03):
[10]. Barlybayev A ,Zhetkenbay L ,Karimov D , et al.Development neuro-fuzzy model to predict the stocks of companies in the electric vehicle industry[J].Eastern-European Journal of Enterprise Technologies,2023,4(4):72-87.
Cite this article
Wang,C.;Zhang,W. (2024). Data Visualization and Machine Learning Trend Analysis Forecasting Based on Roblox Stock Data. Advances in Economics, Management and Political Sciences,75,279-285.
Data availability
The datasets used and/or analyzed during the current study will be available from the authors upon reasonable request.
Disclaimer/Publisher's Note
The statements, opinions and data contained in all publications are solely those of the individual author(s) and contributor(s) and not of EWA Publishing and/or the editor(s). EWA Publishing and/or the editor(s) disclaim responsibility for any injury to people or property resulting from any ideas, methods, instructions or products referred to in the content.
About volume
Volume title: Proceedings of the 3rd International Conference on Business and Policy Studies
© 2024 by the author(s). Licensee EWA Publishing, Oxford, UK. This article is an open access article distributed under the terms and
conditions of the Creative Commons Attribution (CC BY) license. Authors who
publish this series agree to the following terms:
1. Authors retain copyright and grant the series right of first publication with the work simultaneously licensed under a Creative Commons
Attribution License that allows others to share the work with an acknowledgment of the work's authorship and initial publication in this
series.
2. Authors are able to enter into separate, additional contractual arrangements for the non-exclusive distribution of the series's published
version of the work (e.g., post it to an institutional repository or publish it in a book), with an acknowledgment of its initial
publication in this series.
3. Authors are permitted and encouraged to post their work online (e.g., in institutional repositories or on their website) prior to and
during the submission process, as it can lead to productive exchanges, as well as earlier and greater citation of published work (See
Open access policy for details).
References
[1]. Lin W ,Xie L ,Xu H .Deep-Reinforcement-Learning-Based Dynamic Ensemble Model for Stock Prediction[J].Electronics,2023,12(21):
[2]. Haodong H ,Liang X ,Shengshuang C , et al.Stock trend prediction based on industry relationships driven hypergraph attention networks[J].Applied Intelligence,2023,53(23): 29448-29464.
[3]. Jafar H S ,Akhtar S ,Chaarani E H , et al.Forecasting of NIFTY 50 Index Price by Using Backward Elimination with an LSTM Model[J].Journal of Risk and Financial Management,2023,16(10):
[4]. Fangzhao Z .RETRACTED: Extreme learning machine for stock price prediction[J].International Journal of Electrical Engineering Education,2023,60(1_suppl): 3972-3985.
[5]. Bhatta A ,Poudyal P ,Maharjan K D , et al.Assessing Machine Learning's Accuracy in Stock Price Prediction[J].International Journal of Computer (IJC),2023,49(1):46-63.
[6]. Haque S M ,Amin S M ,Miah J , et al.Boosting Stock Price Prediction with Anticipated Macro Policy Changes[J].Journal of Mathematics and Statistics Studies,2023,4(3):29-34.
[7]. Dongbo M ,Da Y ,Maojun H , et al.VGC-GAN: A multi-graph convolution adversarial network for stock price prediction[J].Expert Systems With Applications,2024,236.
[8]. Li C Y ,Huang Y H ,Yang P N , et al.Stock Market Forecasting Based on Spatiotemporal Deep Learning[J].Entropy,2023,25(9):
[9]. Sichong C .High-frequency stock return prediction using state-of-the-art deep learning models[J].International Journal of Financial Engineering,2023,10(03):
[10]. Barlybayev A ,Zhetkenbay L ,Karimov D , et al.Development neuro-fuzzy model to predict the stocks of companies in the electric vehicle industry[J].Eastern-European Journal of Enterprise Technologies,2023,4(4):72-87.