


1. Introduction
The tech and pharmaceutical sectors, though distinct in their nature, have both significantly impacted modern economies. While these sectors can exhibit significant financial growth, there exists a discrepancy in the correlation between their revenues and EPS. This research places into comparative focus industry titans—Apple (AAPL) and Microsoft (MSFT) from the tech industry, and Pfizer (PFE) and Merck (MRK) from the pharmaceutical sphere—probing into their financial narratives from 2019 to 2022. A congruence in revenue and EPS trajectories is depicted by AAPL and MSFT, while PFE and MRK manifest incongruent patterns. The thesis posits that these disparities are intricately woven into the fabric of each industry’s distinctive R&D expenditure paradigms and regulatory frameworks, thereby sculpting their unique financial portraits. By unfurling this financial comparison and analysis, this research seeks to not only decode the underlying mechanisms driving these differences but also to scaffold a platform upon which future research and financial strategies might be built.
2. Data Analysis
2.1. Apple
Apple's total revenue increased steadily from $260,174 million in 2019 to $394,328 million in 2022. Apple's EPS also experienced growth from $2.97 in 2019 to $6.11 in 2022. [1]. This represents a substantial increase in profitability over the same period. As shown Figure 1, the lines representing growth in revenue and EPS are almost exactly parallel, illustrating a high correlation, indicative of an adept management in not only generating higher net income but also effectively maneuvering its outstanding shares and operational costs.
Moreover, Apple's strategic scalability and continual innovation in technology, along with a capital-light model, underscore the fundamental elements that enable a positive correlation between its revenue and EPS.
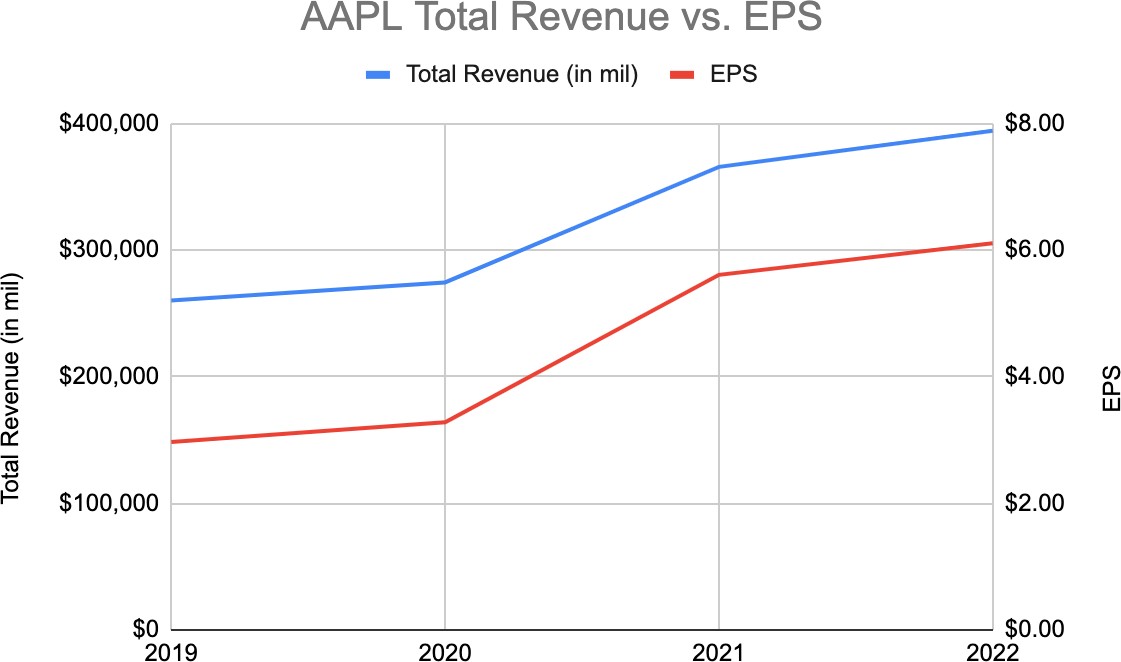
Figure 1: Trend of Apple’s total revenue and EPS between 2019 and 2022
2.2. Microsoft
From 2019 to 2022, Microsoft's revenue and EPS have shown a generally positive trend, as shown in the graph below, indicating the company's growth and profitability during this period. Microsoft's total revenue and EPS increased steadily from $125,843 million to $198,270 and from $5.06 to $9.65, respectively.[2]. Microsoft’s consistent growth in revenue and EPS (Figure 2) demonstrates the inherent scalability and high margin characteristic of tech industries.
Notably, the company’s emphasis on innovations in cloud computing and Artificial Intelligence (AI) could potentially explain the consistent upward trajectory of both financial metrics, reflecting not only an increase in revenue but also proficient expense management and strategy adaptation to uphold the EPS.
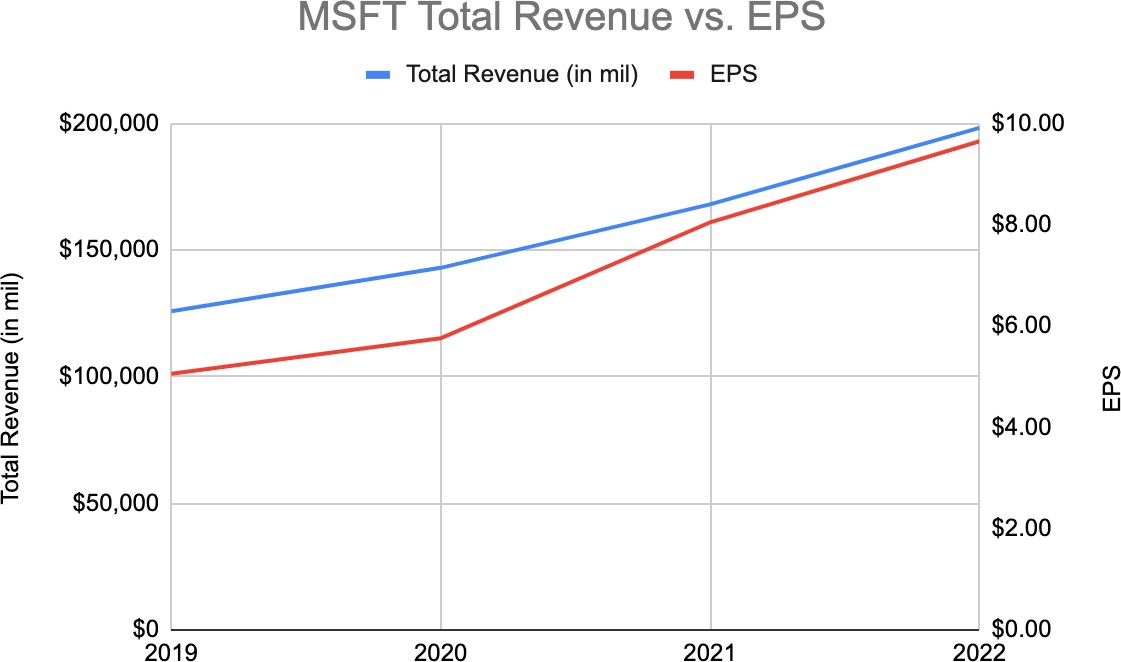
Figure 2: Trend of Microsoft’s total revenue and EPS between 2019 and 2022
2.3. Pfizer
Pfizer's total revenue remained relatively stable from 2019 to 2020, with a slight increase from $40,905 million to $41,651 million. However, there was a significant jump in revenue from 2020 to 2021, increasing to $81,288 million, and another notable increase in 2022 to $100,330 million. In contrast, Pfizer's EPS declined from $2.82 in 2019 to $1.63 in 2020 but then increased significantly to $3.85 in 2021 and further to $5.47 in 2022. [3]. Pfizer’s inconsistent patterns in total revenue and EPS (Figure 3) can be attributed to the substantial investment in R&D and the dynamic regulatory landscape inherent in the pharmaceutical industry. In 2020 and 2021, Pfizer's involvement in the development and global distribution of a COVID-19 vaccine implicates the intensive R&D expenditures and regulatory navigation, affirming the thesis that the pharmaceutical industry’s financial patterns, particularly in EPS, are substantially influenced by R&D investments and regulatory adherence.
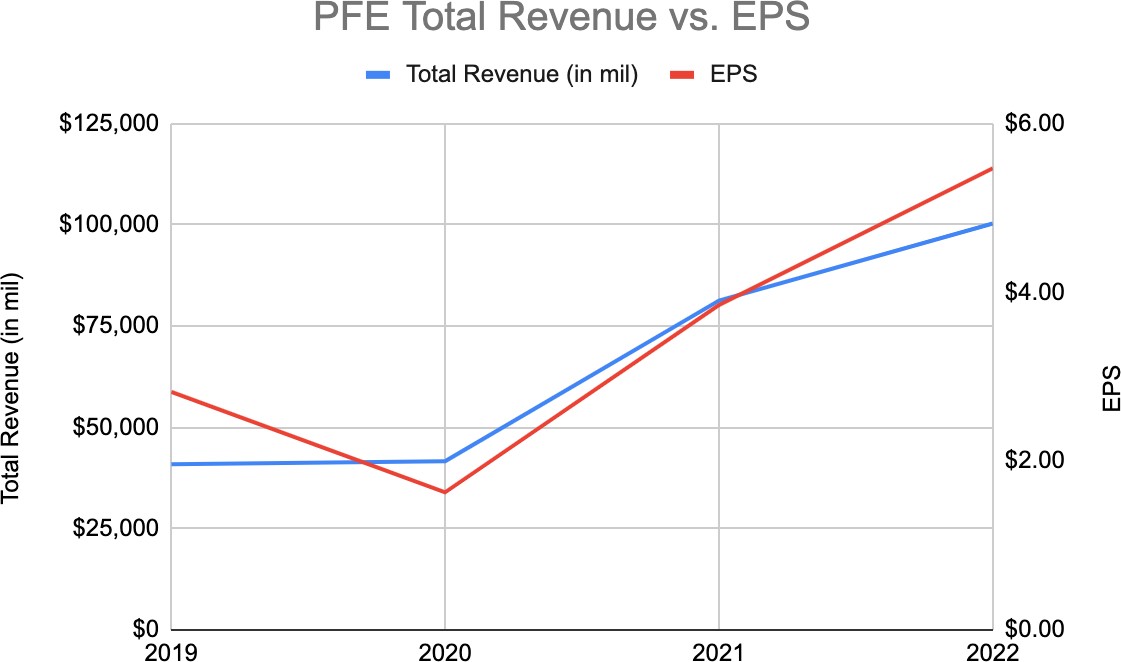
Figure 3: Trend of Pfizer’s total revenue and EPS between 2019 and 2022
2.4. Merck
Merck's total revenue showed steady growth from $39,121 million in 2019 to $59,283 million in 2022. However, Merck's EPS declined from $3.81 in 2019 to $2.78 in 2020 but then increased to $5.14 in 2021 and further to $5.71 in 2022. [4]. Merck’s incongruity in total revenue and EPS trends from 2019 to 2022 (Figure 4) demonstrates the impacts of substantial R&D costs and the looming threat of patent expirations on the company’s financial metrics. The observed variances in the correlation between revenue and EPS could be substantially tied to their intensive investments in drug development and the associated regulatory hurdles, substantiating the thesis regarding the impact of R&D and regulatory factors on financial correlations in the pharmaceutical industry.
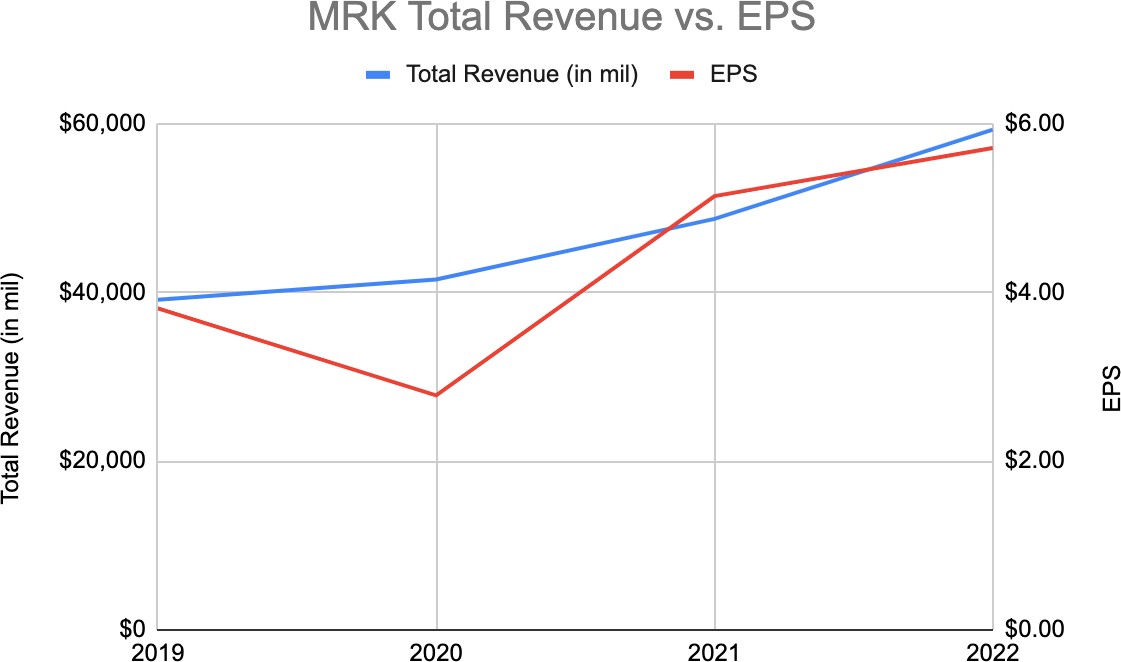
Figure 4: Trend of Merck’s total revenue and EPS between 2019 and 2022
3. R&D Investment Strategies
3.1. Tech Industry
Tech companies like Apple and Microsoft often reinvest their revenues into R&D but also diversify into other products or services. Their vast product lineups and service ecosystems can result in diversified revenue streams, potentially explaining the observed correlation disparities.
Apple's R&D strategy traditionally focuses on iterative improvements in their product lines like the iPhone, iPad, and Mac. Over the years, Apple has also made considerable R&D investments in developing new technologies such as augmented reality, machine learning, and even rumored initiatives like the "Apple Car". For instance, in the transition from iPhone 11 to iPhone 12, Apple introduced 5G technology, which would have necessitated significant R&D investment.
Microsoft’s R&D strategy revolves around its legacy software products and emerging technologies. The company has continually reinvested to improve its flagship product, Windows, while also focusing on cloud computing with Azure. In recent years, Microsoft has delved deep into AI research and quantum computing, demonstrating its diverse approach to R&D.
3.2. Pharmaceutical Industry
For pharmaceutical companies, the nature of R&D is inherently riskier. High costs of drug development, coupled with the uncertainty of drug approvals, can lead to fluctuating EPS, even with steady revenues.
Pfizer's R&D strategy is multifaceted. They not only focus on developing new drugs but also on improving their existing ones. A significant example is the development of their COVID-19 vaccine in collaboration with BioNTech. [5]. Such initiatives demand heavy R&D investment, but the returns, as seen in subsequent years, can be monumental if successful.
Merck's R&D strategy is quite diversified, encompassing various therapeutic areas, from oncology to vaccines. For instance, their drug Keytruda, used to treat various types of cancer, has undergone extensive R&D to expand its approved uses across different cancer types.
4. Regulatory Environments
4.1. Tech Industry
Tech companies, although subjected to regulatory scrutiny, often face less stringent regulations compared to pharmaceuticals, especially concerning product launches.
Regulatory challenges for Apple often revolve around antitrust concerns and intellectual property disputes. For example, Apple's App Store policies have been under scrutiny in multiple countries for potentially monopolistic practices, which can impact their revenue streams.[6]. However, these challenges are less direct than the regulatory hurdles faced in the pharmaceutical sector.
Similar to Apple, Microsoft has faced regulatory scrutiny, especially concerning its software bundling practices in the past. Their acquisition strategies, such as the attempt to acquire TikTok's US operations, often come under the lens of regulatory authorities which can impact their financial dynamics.
4.2. Pharmaceutical Industry
Pharmaceuticals undergo rigorous testing and approvals. Even after high R&D expenses, not all drugs make it to the market. Regulatory hurdles can thus lead to discrepancies in the correlation between revenues and EPS.
Beyond the typical regulatory hurdles of drug approvals, Pfizer has faced specific challenges. Their COVID-19 vaccine, though developed at an unprecedented speed, had to undergo rigorous testing and meet the stringent criteria set by health authorities worldwide before receiving emergency use authorization and then full approval.
Merck's Regulatory challenges often revolve around approving new drugs and therapies. Their drug Keytruda, as effective as it has proven to be, had to undergo multiple phases of clinical trials and face the scrutiny of agencies like the FDA before it could be commercialized. Such processes are time-consuming and costly, potentially impacting the correlation between revenue and EPS.
5. Conclusion
This paper underscores the substantial impact of industry-intrinsic factors – notably R&D investment strategies and regulatory environments – on the correlation between total revenue and EPS in the tech and pharmaceutical industries. The explicit contrasts in financial patterns between tech giants, Apple and Microsoft, and pharmaceutical leaders, Pfizer and Merck, illuminate the fundamental divergences in these industries’ operational and financial landscapes. This comprehension not only demystifies the observed financial trajectories but also provides a foundational framework for stakeholders in navigating investment and strategic planning amidst the unique dynamics inherent in these industries.
References
[1]. R&D Investment Strategies, Regulatory Environments,Data Analysis
[2]. Microsoft Corp. (2019-2022). Annual Reports, 2019-2022. https://www.microsoft.com/investor/reports/ar22/index.html
[3]. Pfizer Inc. (2019-2022). Annual Reports, 2019-2022. https://www.pfizer.com/sites/default/files/investors/financial_reports/annual_reports/2022/
[4]. Merck & Co. (2019-2022). Annual Reports, 2019-2022. https://www.merckgroup.com/en/annualreport/2022/
[5]. “Shot of a Lifetime: How Pfizer and BioNTech Developed and Manufactured a COVID-19 Vaccine in Record Time .” Pfizer, https://www.pfizer.com/news/articles/shot_of_a_lifetime_how_pfizer_and_biontech_developed_and_manufactured_a_covid_19_vaccine_in_record_time Accessed 26 Sep. 2023
[6]. Satariano, Adam, and Jack Nicas. “Apple’s App Store Draws Antitrust Scrutiny in European Union.” The New York Times, The New York Times, 16 June 2020. https://www.nytimes.com/2020/06/16/business/apple-app-store-european-union-antitrust.html Accessed 27 Sep. 2023
Cite this article
Wang,F. (2024). Disparities in Correlation Between Total Revenue and EPS: The Influence of R&D and Regulatory Environments in Tech and Pharmaceutical Industries. Advances in Economics, Management and Political Sciences,79,1-6.
Data availability
The datasets used and/or analyzed during the current study will be available from the authors upon reasonable request.
Disclaimer/Publisher's Note
The statements, opinions and data contained in all publications are solely those of the individual author(s) and contributor(s) and not of EWA Publishing and/or the editor(s). EWA Publishing and/or the editor(s) disclaim responsibility for any injury to people or property resulting from any ideas, methods, instructions or products referred to in the content.
About volume
Volume title: Proceedings of the 3rd International Conference on Business and Policy Studies
© 2024 by the author(s). Licensee EWA Publishing, Oxford, UK. This article is an open access article distributed under the terms and
conditions of the Creative Commons Attribution (CC BY) license. Authors who
publish this series agree to the following terms:
1. Authors retain copyright and grant the series right of first publication with the work simultaneously licensed under a Creative Commons
Attribution License that allows others to share the work with an acknowledgment of the work's authorship and initial publication in this
series.
2. Authors are able to enter into separate, additional contractual arrangements for the non-exclusive distribution of the series's published
version of the work (e.g., post it to an institutional repository or publish it in a book), with an acknowledgment of its initial
publication in this series.
3. Authors are permitted and encouraged to post their work online (e.g., in institutional repositories or on their website) prior to and
during the submission process, as it can lead to productive exchanges, as well as earlier and greater citation of published work (See
Open access policy for details).
References
[1]. R&D Investment Strategies, Regulatory Environments,Data Analysis
[2]. Microsoft Corp. (2019-2022). Annual Reports, 2019-2022. https://www.microsoft.com/investor/reports/ar22/index.html
[3]. Pfizer Inc. (2019-2022). Annual Reports, 2019-2022. https://www.pfizer.com/sites/default/files/investors/financial_reports/annual_reports/2022/
[4]. Merck & Co. (2019-2022). Annual Reports, 2019-2022. https://www.merckgroup.com/en/annualreport/2022/
[5]. “Shot of a Lifetime: How Pfizer and BioNTech Developed and Manufactured a COVID-19 Vaccine in Record Time .” Pfizer, https://www.pfizer.com/news/articles/shot_of_a_lifetime_how_pfizer_and_biontech_developed_and_manufactured_a_covid_19_vaccine_in_record_time Accessed 26 Sep. 2023
[6]. Satariano, Adam, and Jack Nicas. “Apple’s App Store Draws Antitrust Scrutiny in European Union.” The New York Times, The New York Times, 16 June 2020. https://www.nytimes.com/2020/06/16/business/apple-app-store-european-union-antitrust.html Accessed 27 Sep. 2023