


1. Introduction
Singapore and Hong Kong have both been heralded as the hearts of the worldwide financial industry, and the ongoing shift of gravity in global financial activities from North America and Europe to Asia would only further contribute to their success. This is no small part due to their banking systems, which are known for their stability, efficiency, and transparency, and are both popular destinations for international businesses and investors looking for a safe and secure place to store their assets. Within the two, DBS and HSBC respectively are the largest domestic banks with significant local influence and are thus representative of the banking system[1-3]. In our study, we would like to make a quantitative comparison between the strengths of the two banking systems through an analysis of how they have responded to the 2008 financial crisis, the COVID-19 pandemic, and the Russia-Ukraine war [4,5]. Through this, we wish to gain insight into which of the two banking systems is the superior one in terms of stability and risk-mitigating power and contribute to the ongoing discourse of which one to choose between the two institutions.
We selected these 3 events as the 2008 financial crisis, the COVID-19 pandemic, and the ongoing Russia–Ukraine war are all significant global events that would have impacted the respective banking sectors of Singapore and Hong Kong similarly. This is because both are extensively invested in foreign markets and share a similar geographical, and cultural context. Thus, how they perform during such crises would be indicative of their strength and reliability. The 2008 financial crisis was one of the most severe economic downturns in history and began with a housing bubble in the United States, which eventually burst and caused widespread panic in the global financial system. As a result, the Dow Jones Industrial Average fell by 777.68 points, or 6.98%, on September 29, 2008, marking the largest one-day drop in its history at that time. In the United States, the unemployment rate rose from 4.7% in November 2007 to a peak of 10.0% in October 2009. In 2008, several major financial institutions filed for bankruptcy or were acquired, including Lehman Brothers, Washington Mutual, and Wachovia.
COVID-19, also known as the corona virus disease, is a highly infectious respiratory illness caused by the SARS-CoV-2 virus. It was first identified in December 2019 in Wuhan, China, and quickly spread globally, becoming a pandemic in March 2020. Since the start of the pandemic, there have been over 400 million confirmed cases and 6 million deaths worldwide. The pandemic has had a significant impact on global health, the economy, and daily life for people around the world. In March 2020, global stock markets experienced their worst month since the 2008 financial crisis, with the S&P 500 falling by 12.5%, the Dow Jones Industrial Average falling by 13.7%, and the Nikkei 225 falling by 10.5%. The pandemic has led to significant job losses, with the International Labour Organization estimating that the equivalent of 255 million full-time jobs were lost globally in 2020[6]. In the US, the unemployment rate reached a peak of 14.8% in April 2020, before declining to 6.2% in February 2021.
The conflict between Russia and Ukraine has been ongoing since 2014, when Russia annexed Crimea from Ukraine. A recent escalation began in early 2021, when Russia massed troops near the Ukrainian border and in Crimea. In April, fighting broke out in eastern Ukraine between Ukrainian government forces and Russian-backed separatists. In November 2021, Russia began a new military offensive, launching a massive attack on Ukraine’s eastern border. The attack was quickly repelled by Ukrainian forces, but fighting has continued in various parts of the conflict zone. The conflict has had a number of significant financial impacts globally. Russia is one of the world’s largest oil producers, and any instability in the region can cause oil prices to rise. The conflict has caused oil prices to increase, which can have a ripple effect on the global economy, as many industries rely on oil. Moreover, the conflict has caused uncertainty in the global stock markets, and investors have become more cautious. As a result, stock markets have experienced volatility, and some stocks have declined in value.
Our major direction of research is to use mathematical models and models to evaluate the effects of each global event on the stock prices of DBS and HSBC. A brief description of our methodology is as follows. We calculated the daily returns of each stock through closing prices, then regressed it with respect to a significant local index to calculate expected returns. Next, we subtracted expected returns from actual returns for abnormal returns, and plotted cumulative abnormal returns against the confidence band to see if there was any statistically significant impact. So far, our paper is amongst the first to attempt at making a quantitative analysis and comparison between the Singapore and Hong Kong banking system. By regression analysis with respect to significant local indices, we can isolate the impact the various crises have had on the banking industries alone, minimizing the effect of differences in market wide impact [7]. The remainder of this paper is structured as follows: in Section 2, we detail our methodology for the study, Sections 3 demonstrates the empirical results for the 2008 financial crisis, COVID-19 pandemic and Russia-Ukraine war respectively, with the conclusion following in Section 4.
2. Methodology
Event study is a widely used methodology in finance and economics to measure the impact of a specific event, on the value of a firm or the performance of a financial asset. Our current study focuses on the performances of Singapore and Hong Kong banking stocks under the impacts of three different events, which are the 2008 economic crisis, COVID-19, and the Russia-Ukraine war, as banking stocks are a significant component of the financial industry. One of the main advantages of using event study is that it allows researchers to isolate the impacts of a particular event on stock prices, providing valuable insights. Furthermore, event studies are relatively flexible and can be conducted quickly, compared to other research methods [1]. However, it is crucial to note that there are also some limitations to event study, such as the quality of the data and the statistical model used, as well as other factors that influence stock prices that may not be accounted for in the model. We will then outline the steps involving conducting an event study:
Step 1: Identify the Events and Samples.
We define the event as the impacts of the 2008 financial crisis, COVID-19, and the Russia-Ukraine War on Singapore and Hong Kong’s banking stocks. For Singapore, we chose the bank DBS – The Development Bank of Singapore Limited as the target sample, compared with nature market-STI-Market-Straits times index. For Hong Kong, we chose the bank HSBC – The Hongkong and Shanghai Banking Corporation Limited as the target sample, comparing with natural market-his-Hang Seng Index.
Step 2: Windows Selection.
As shown in Figure 1, we define the start and end date of each event first and chose the period between as our event windows. Then leave 10 days of quarantine time before the event started, setting estimation windows till the quarantine time started. We prefer a relatively long estimation window because it provides a more accurate estimate of the expected return.

Figure 1: Windows References [Owner-draw]
Step 3: Collect Data and Set Initial Calculations.
We collect the historical data for STI, DBS, HSI, and HSBC, and used the closing price to calculate daily return rates, by using Formula 1:
\( {R_{t:t+s}}=\frac{{P_{t+s}}-{P_{t}}}{{P_{t}}}=\frac{{P_{t+s}}}{{P_{t}}}-1… \) (1)
By drawing a scatter chart using sample return against market return. We got equations in the form as shown in Formula 2:
\( N{R_{t}}=α+β{R_{mt}}, t=1,…,E… \) (2)
Then we calculate epsilon by substituting market return into Formula 2, which represents the expected return. Then we got the abnormal return by, using the actual sample bank return, and take away the expected sample bank return. Refers to Formula 3 below:
\( A{R_{t}}=\overset{treated}{\overbrace{{R_{t}}}}-\overset{control}{\overbrace{(α+β{R_{mt}})}}, t=1,…, E… \) (3)
Step 4: Calculate Cumulative Abnormal Returns Compared to the Confidence Interval.
We then calculate the confidence interval, which indicates the probability that the true abnormal return falls within the specified range of values.
\( (-1.96×\sqrt[]{2T}{σ_{ϵ}},-1.96×\sqrt[]{2T}{σ_{ϵ}} )… \) (4)
We also got CAR (cumulative abnormal return) [8], by summing up the abnormal returns over the event window, and it provided a measure of the total impact of the event on the value of the company or financial asset.
\( CAR(t)=\sum _{s=1}^{t}A{R_{s}}= \sum _{s=1}^{t}{ε_{s}} ~ N(0,t{σ^{2}})… \) (5)
We finally graphed the Confidence interval and CAR over time.
Step 5: Interpret Results
As the graph set could provide a visual representation of the impact of the event, statistical analysis can be then conducted to determine whether there is a significant difference between the returns during the pre-event period and the event period. Finally, we established a specific conclusion.
3. Analysis of Results
3.1. Empirical Result 1 (2008 Financial Crisis)
Window selection for 2008 financial crisis: We have decided on our event window for the 2008 financial crisis to be from September 16th to December 31st of 2008, with the endpoint being the date Lehman Brothers declared bankruptcy. The quarantine period we have chosen is from August 30th to September 15th of 2008 for the separation of ten data points between the event window and estimation period. Our estimation period will be from January 1st, 2007 to August 29th, 2008 for it to be adequately long. In terms of the performance of HSBC as shown in Figure 2, the Cumulative Abnormal Return of HSBC increased steadily to the edge of the critical region at the beginning of the crisis. However, as time went on, the Cumulative Abnormal Return of HSBC exceeded the negative confidence interval 27 days after the bankruptcy of Lehman Brothers and displayed a considerable bearish pattern afterward.
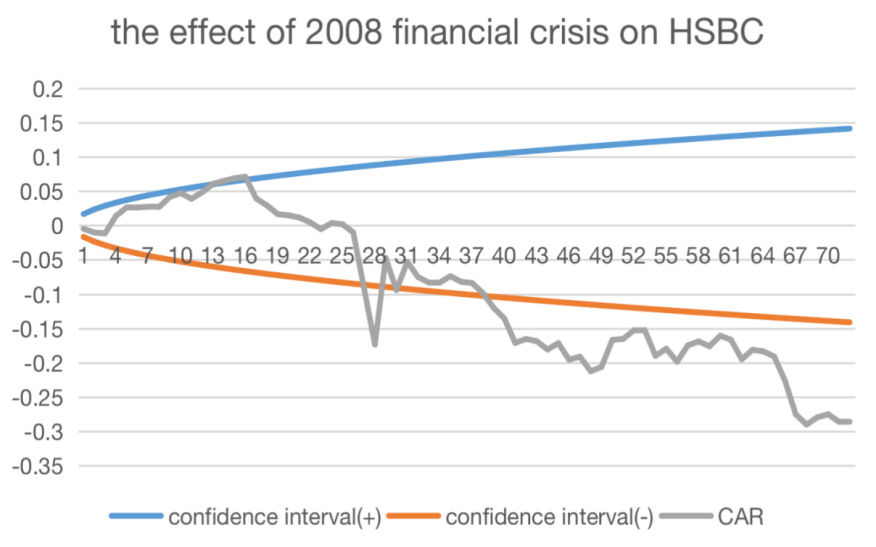
Figure 2: HSBC Performance Under 2008 Financial Crisis [Owner-draw]
As for the performance of DBS as shown in Figure 3, only 2 days after the bankruptcy of Lehman Brother, the Cumulative Abnormal Return of DBS fell out of the negative confidence interval, which means it is statistically significant. In the next 70 days, the CAR of DBS primarily lied out of the negative confidence interval with only a two-day exception.
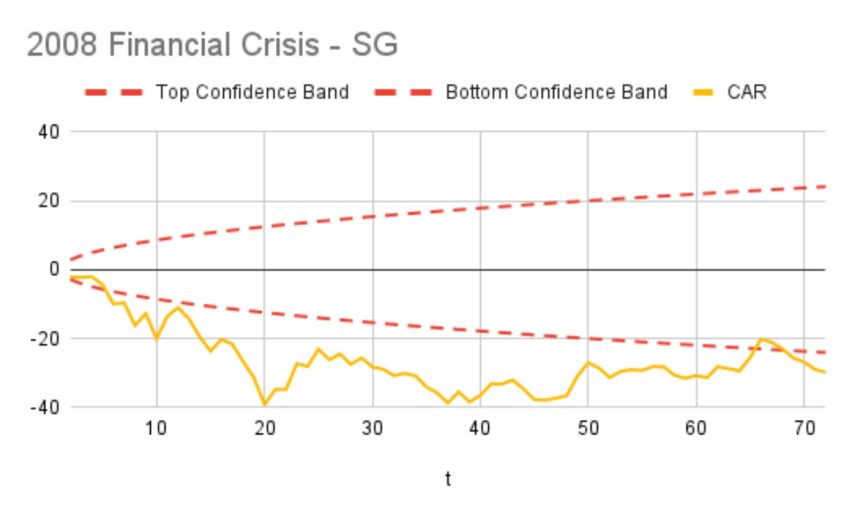
Figure 3: DBS Performance Under 2008 Financial Crisis [Owner-draw]
Next, we compare these two stocks. In the beginning, the trends displayed by the two banking stocks are completely opposite. While the Cumulative Abnormal Return for HSBC increased and stayed within the confidence interval, that for DBS decreased dramatically and exceeded the confidence interval. These patterns indicate that HSBC’s stock was resilient and less affected than DBS’s at the first stage of the financial crisis. Nevertheless, 27 days after the bankruptcy of Lehman Brothers, HSBC’s banking stock fell out of the negative confidence interval and showed a similar negative pattern to that of DBS. The negative pattern of the two banking stocks highlights they were both hit hard by the Financial Crisis as more American major financial institutions announced bankruptcy. The significant Cumulative Abnormal Return of both banking stocks accentuates the severe impact brought by the 2008 Financial Crisis.
When we looked at the 70-day event window, the Cumulative Abnormal Return of HSBC fell out of the confidence interval for 33 days, whereas that of DBS exceeded the confidence interval for 67 days which doubled the number of days of the former. This implies that HSBC is more stable and resilient against risk and shock, which may be interpreted by the fact that, at the beginning of the 21st century, Hong Kong was regarded as the Asian Financial Center rather than Singapore, which means that the strength and stability of its financial market were stronger, thus enabling it to confront the severe Financial Crisis better.
3.2. Empirical Result 2 (COVID-19)
The COVID-19 pandemic has had a significant impact on the global banking industry, disrupting the world economy and testing the resilience of the banking system. The pandemic has forced banks to adapt quickly to changing market conditions, including the sudden shift to remote work, a reduction in demand for loans, and an increase in loan defaults. Despite the challenges posed by the pandemic, the banking industry has demonstrated resilience and adaptability, and it is expected to continue to evolve in response to the changing environment. Banks have been forced to adopt new technologies and innovate their business models to stay competitive.
To conduct an accurate event study, several basic assumptions and information need to be outlined. The research question for event 2 is which banking industry performed better during the COVID-19 pandemic between Singapore's DBS and Hong Kong's HSBC. The data selected are historical stock prices of DBS and HSBC. The estimation window was set from 16/07/2018 to 13/01/2020, and the event window from 23/01/2020 to 01/04/2022. For the event window, the starting date was defined as the detection of the first case in two countries and the ending date as the announcement of the government reopening borders in the two countries. The benchmark selected for DBS is STI, and for HSBC is HSI. By calculating the CAR and confidence intervals, we got graph results for event 2 based on the data (see Figure 4).
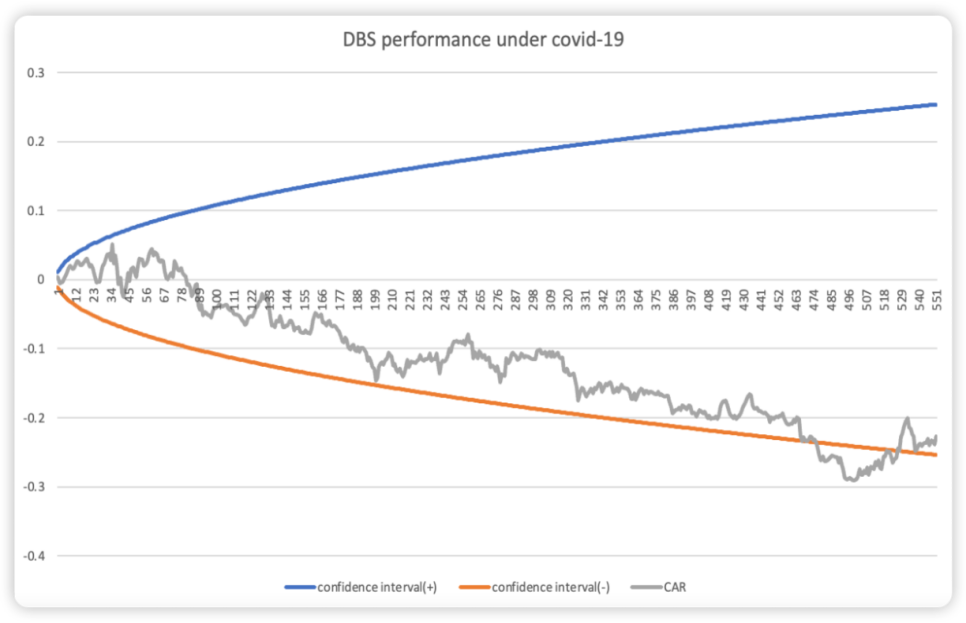
Figure 4: DBS Performance Under Covid-19 [Owner-draw]
In general, as shown in Figure 4, at the beginning of the COVID-19 outbreak, the target bank DBS was not immediately affected. This may be due to the lag resulting from the difference in time between European and Asian COVID-19 outbreaks. However, as indicated by the cumulative abnormal return (CAR), there was a general negative trend for DBS, which reflects the impacts of COVID-19. This negative trend may have been due to the shrinking aggregate demand, resulting in a decline in the banking company's profits, as well as employees’ absence due to illness, which decreased the company's productivity. Towards the end of the pandemic, the CAR of DBS showed a positive growing trend, indicating recovery. This may have been due to the Singapore government's announcement about reopening borders [9]. As shown in Figure 4, at the beginning of the COVID-19 outbreak, DBS was not immediately significantly affected. We speculate that this is because it takes time for the impact of the pandemic to spread out and for the market to react. However, as indicated by the cumulative abnormal return, there was a general negative trend and it eventually exceeded the bottom confidence band, which reflects the significant negative impact of COVID-19 on the Singapore banking system. This may have been due to the shrinking aggregate demand, resulting in a decline in the banking company's profits, as well as employee absences due to illness, which decreased the company's productivity. Towards the end of the pandemic, the CAR showed a positive growing trend, indicating recovery. We speculate that this may have been due to successful pandemic response measures by the Singapore government and their announcement about the reopening of borders.
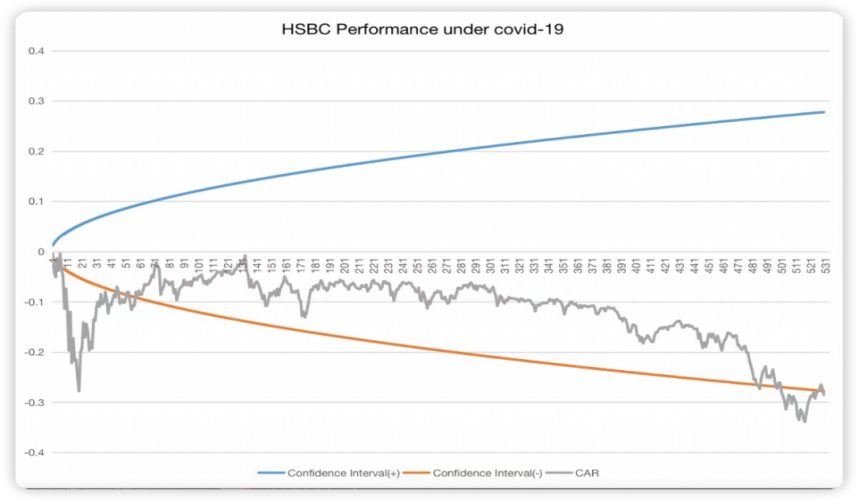
Figure 5: HSBC Performance Under Covid-19 [Owner-draw]
In general, as shown in Figure 5, at the beginning of the COVID-19 outbreak, the target bank HSBC was immediately affected, and the CAR dropped in a relatively short period. However, over time, the CAR of HSBC recovered, possibly due to the banking company's policies implemented to control the negative situation. As COVID-19 continued to exist for a long time, HSBC performed relatively stably, although the CAR remained negative. Towards the end of the event window, the CAR worsened, going further negative, possibly due to another round of the pandemic or some policy adjustments.
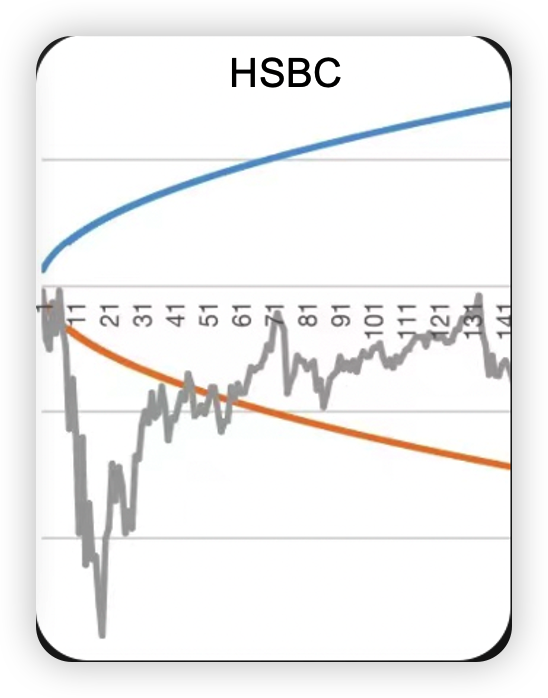
Figure 6: HSBC Performance at The Start of Covid-19 [Owner-draw]
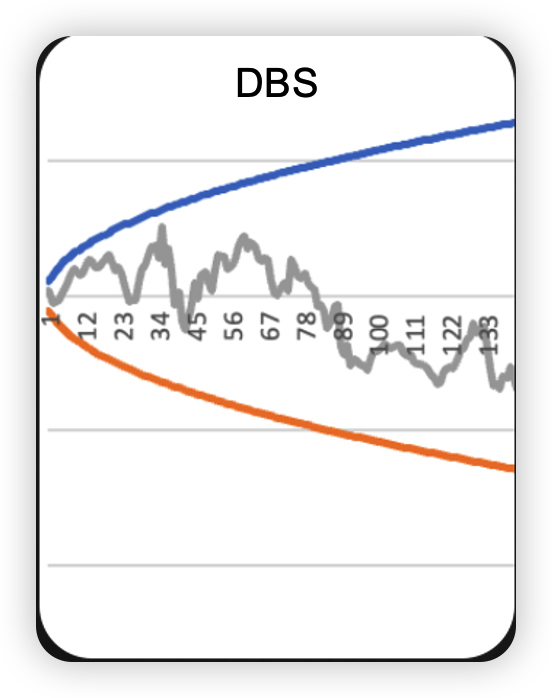
Figure 7: DBS Performance at The Start of Covid-19[Owner-draw]
Figure 6 and Figure 7 demonstrate the contrasting performance of DBS and HSBC at the onset of the COVID-19 pandemic. While both banks experienced a decline in their cumulative abnormal return (CAR), the decline was more gradual for DBS, indicating a more stable performance compared to HSBC's dramatic drop. This initial trend suggests that DBS may be better equipped to weather economic shocks due to its ability to adapt to changing market conditions. The difference in performance can be attributed to the fact that HSBC is more dependent on market factors, making it more susceptible to fluctuations in the global economy. In contrast, DBS's more measured response could be indicative of a more stable overall performance when facing future crises.
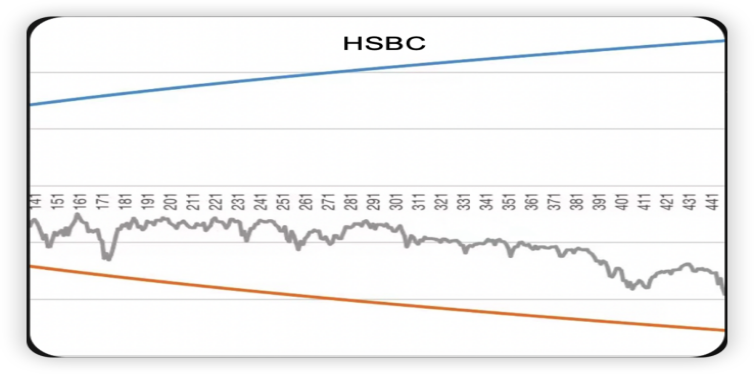
Figure 8: HSBC Performance During the Peak of Covid-19[Owner-draw]
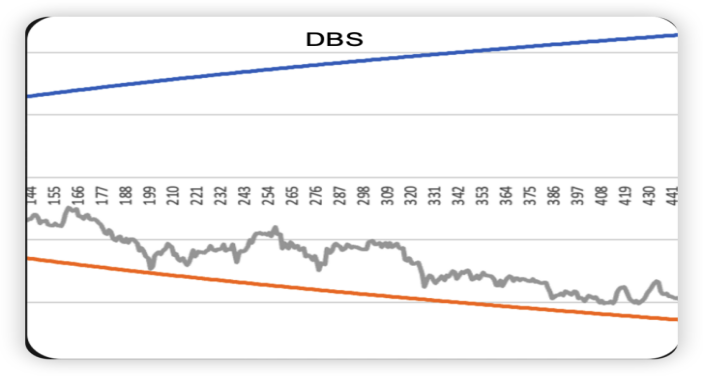
Figure 9: DBS Performance During the Peak of Covid-19[Owner-draw]
As depicted in Figure 8 and Figure 9, it is evident that right in the middle of the COVID-19 pandemic, HSBC exhibited more stability compared to DBS, whose CAR showed significant fluctuations, declining further into negativity. In contrast, HSBC's CAR remained relatively unchanged for a considerable period. This trend indicates that HSBC has a better ability to manage emergency situations like the COVID-19 pandemic. Despite the initial shock and decline, HSBC was adept at recovering and controlling the situation to minimize losses in the long run. In contrast, DBS struggled to stabilize its performance and suffered from fluctuating CAR values. Therefore, it is safe to conclude that HSBC performed better amid the pandemic.
3.3. Empirical Result 3 (Ukraine war)
The third event is the Russia-Ukraine War, which is the most recent event among the three events. Through the analysis of the performance of DBS and HSBC during the war, the two banks’ current ability to generate profits can be revealed.
Event Background. The Ukraine War has had a tremendous impact on the global financial sector. Particularly, the banking industry had been greatly influenced as the war reshuffled people’s preference for investment. Investments in countries that are involved in the war have been regarded as risky since the economies of those countries have been negatively impacted by the energy crisis and the nuclear war threat; as a result, many investors desperately need to find a safe place to invest in. Long regarded as relatively neutral in political stands, and mature in the development of financial services, Singapore and Hong Kong are among the top choices of investors as the harbor of investments. Of course, in recent times, the two regions have had their drawbacks on the macro level as well. For Hong Kong, signs that Hong Kong is diverging from its original goal of becoming a perfectly safe place for investment and business as well as its intention of serving as the bond between the East and the West have been questioned by many risk-averters, especially during political turbulences like the 2019-2020 riot. As for Singapore, many believe that the country’s price level is vulnerable to the inburst of foreign investment, especially the “hot money”, so the country’s investment capacity might be questionable.
Event Study (Description of Empirical Results) Research question: Which Bank has better performance so far during the Ukraine War?
• Data: DBS & HSBC historical stock prices from investing.com and yahoo.finance.com
• Estimation Window: 2021 Feb 9—2022 Feb 9
• Event Window: 2022 Feb 10—2023 Feb 11 (249 trading days in total with 14 days of quarantine)
• Benchmark: DBS-STI; HSBC-HIS
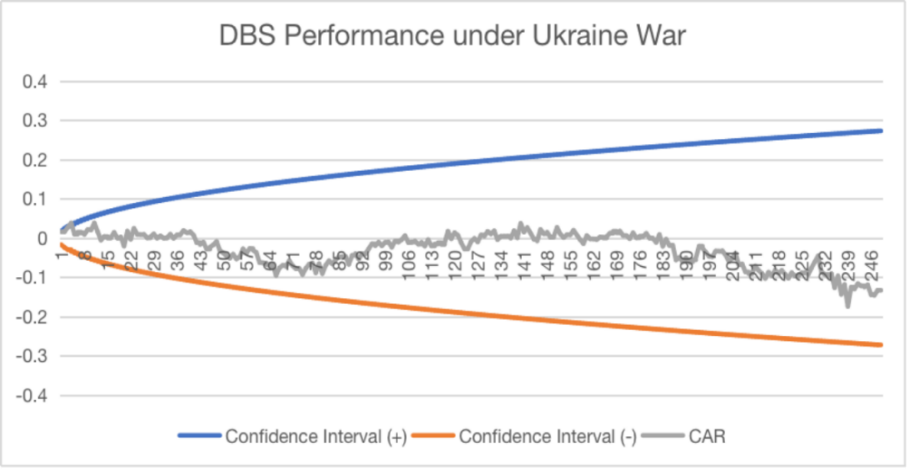
Figure 10: DBS Performance During the Ukraine War [Owner-draw]
As shown in Figure 10, DBS was not greatly influenced when the war initially broke out because the CAR fluctuated around 0.02—0.03 from the 1st day to the 41st day of the event. Nevertheless, as Russia started to launch large-scale attacks, DBS’s CAR dropped to -0.1 since the 46th day, temporarily maintained in the negative zone, and came back to fluctuate between 0 and 0.03 on the 106th day. However, the CAR dropped to the negative zone on the 186th day of the event and maintained a downward trend. Remarkably, the CAR remains in the confidence interval throughout the 249-day event window.
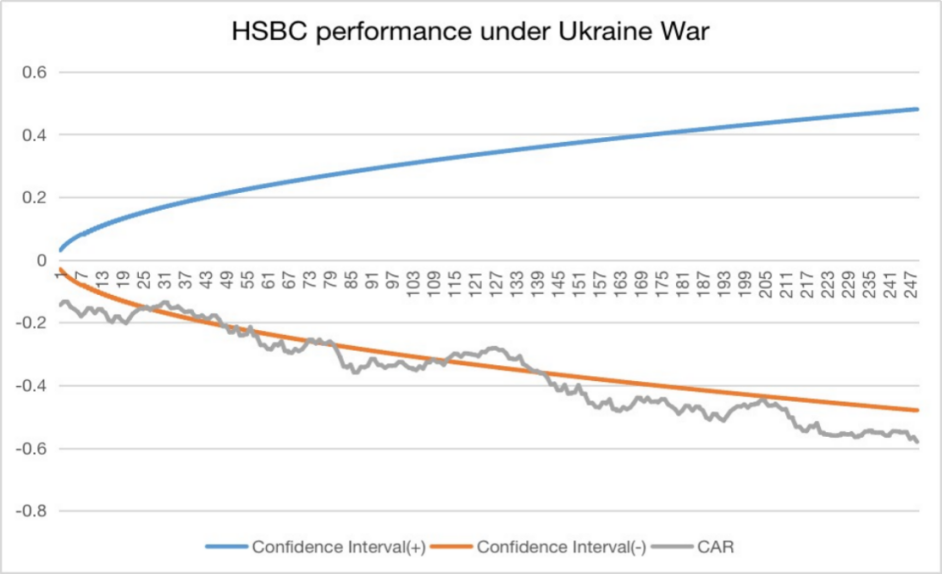
Figure 11: HSBC Performance During the Ukraine War [Owner-draw]
As shown in Figure 11, HSBC is likely to be significantly impacted by the Russian-Ukraine War throughout the event window because the CAR consistently shows an overall downward trend, despite the CAR having some minor temporary upward trend. This overall trend lasted from the 1st day to the 225th day of the event. However, the CAR started to remain stable at about -0.55 since the 225th day of the event, and this trend persists to the end of the window. During the 249-day event window, the CAR remained below the lower bound of the confidence interval for 182 days, while it fell within the confidence interval for only about 67 days throughout the event window.
Event Study. Overall, the CAR of HSBC showed a more negative trend throughout the event window and did not go above zero at all, while the CAR of DBS alternated between positive and negative trends and fluctuated around zero for 131 days out of 246 days. At the end of the event window, the CAR remained stable overall at -0.55 while the CAR of DBS displayed a strong negative trend and decreased 130% within the last 20 days of the event window. Overall, the CAR of HSBC fell into the confidence interval for only 67 days of the 249-day event window, while the CAR for DBS fell into the confidence interval throughout the event window.
Empirical Study. The result of this event study is shocking, as DBS and HSBC, the bank with the largest market cap in Singapore and Hong Kong respectively, have had completely different performances during the Russia-Ukraine War: DBS demonstrated excellent stability during such catastrophe when many industries have been destructively impacted, while HSBC continuously sustained loses during the 249-day event window. Usually, investors would expect that HSBC, the star of the Asian financial market, can generate profits during good times, and become the “last man standing” during bad times; therefore, under the coexistence of the opportunities and the challenges (the war causes many investors to invest in Hong Kong banks while dragging the sluggish Hong Kong economy to the further downturn), HSBC should outperform DBS. However, DBS, as a representative of Singapore Banking, shows that it can operate efficiently under harsh times, and can seize opportunities during the good times. But why is DBS having such an impressive performance during the Russia-Ukraine War? The answer is that DBS enjoys an excellent Macro environment that Singapore provides and operates effectively on the Micro level.
The stable and business-friendly macro environment in Singapore attracts tremendous foreign investments, especially during significant recessions. For example, according to the Department of Statistics Singapore [10], Foreign Direct Investment in Singapore increased by 11% from January 2022 to January 2023; additionally, Foreign Direct investment in Singapore increased by 8.6% from 2020 Q2 to 2021 Q2. In fact, the Singapore government’s laissez-faire in the capitalist market makes Singapore one of the best countries to do business and the role model for emerging economies like Rwanda. As a result of the increasing demand for investing in Singapore, DBS accordingly grows in profitability and popularity.
DBS itself is operating efficiently and effectively as well. The bank’s access to diverse and experienced financial specialists helps it to build a dedicated, connected, and stable workforce. The bank’s strong online influence on various social media sites has built a strong customer relationship, which helps to promote the long-term steady growth of the bank. Additionally, DBS bank is also proficient and experienced at managing its network throughout Asian financial markets. As the result, the company has ideal financial health according to its 2022 financial report: the bank has an optimal Loan-to-Deposit Ratio of 79%, a safe Debt-to-Equity Ratio of 0.87, a moderate Asset-to-Equity Ratio of around 13, an appropriate level of Loan-to-Asset Ratio of 56%, and a Price per Booking Ratio of 1.56 (meaning the bank is not greatly over-valued). Therefore, DBS becomes a favorable bank for investors.
All in all, it is concluded that DBS currently performs better than HSBC during the Russia-Ukraine War because DBS’s CAR conforms with the expectation (confidence interval), so DBS currently is the safer one to invest in. However, such a conclusion cannot serve as a prediction of the two banks’ future performance.
4. Conclusion
4.1. The Financial Crisis in 2008
Based on our empirical result, in the initial stage, CAR of HSBC increased to a large extent while DBS decreased and approached the negative confidence interval. Soon, DBS has exceeded the negative confidence interval and falls to the bottom rapidly. However, CAR of HSBC remains in an upward trend and even exceeded the positive confidence interval slightly at the peak. On the other hand, CAR of DBS has been declining all the time. After the peak, on the 16th day, CAR of HSBC started decreasing and descended linearly on the 26th. On the other hand, CAR of DBS remained exceeding the negative confidence interval all the time, nearly throughout the whole event window. It appears to see that the number of days exceeding the confidence interval of HSBC is shorter than DBS. Therefore, based on our results, HSBC is more stable and resilient against the event.
4.2. COVID-19
Based on our empirical result, during this stage of beginning, CAR of HSBC has been severely affected by COVID-19 and appeared to a huge decrease, exceeding the confidence interval directly, further reached to the lowest position on CAR graph throughout the whole event, while DBS has increased to a small extent in the first 80 days, and seemly haven't been negatively impacted. However, at the stage of 30-40 days, the CAR of HSBC started to recover positively and managed to reach back into the negative confidence interval afterward. On the other hand, DBS has only started a graduate trend of decreasing in CAR, however, it obtained a declining trend until the end of the event window. Reaching the end, both CAR of DBS and HSBC has once dropped out of the negative confidence interval. It appears to see that the number of days exceeding the confidence interval of DBS is less than DBS. Therefore, based on our results, DBS is more stable and resilient against the event.
4.3. Ukraine War
Based on our empirical result, during the stage of beginning, CAR of HSBC is already out of the negative confidence interval while DBS remains in the confidence interval positively. Afterwards, CAR of HSBC appears to be a declining trend, exceeding and returning to the confidence interval multiple times until the end of the event window. On the other hand, although the CAR of DBS started to decrease a little, it has still consistently remained in the confidence interval and recovered to positive CAR in the middle of the event window. It is obvious to see that DBS has fewer days exceeding the confidence interval than HSBC, Therefore, based on our results, DBS is more stable and resilient against the event.
HSBC performed well in the financial crisis in 2008, however, DBS has a better performance than HSBC in COVID-19 and Ukraine wars. This could be due to the HK banking stock being more resilient in the beginning stage (2008 financial crisis), but SG's stock has grown stronger through time and become more resilient in recent years (Ukraine War and COVID-19). To conclude, DBS banking stock is more resilient and stable than HSBC banking stock nowadays against three major events that have severe effects on the world economy. For further improvements, instead of choosing the top 1 bank in each region, we could match more pairs and compare more banking stocks in two regions to ensure accuracy. This could also apply when comparing other sectors in the financial market, e.g. Healthcare, Manufacturing, Real Estate, and Insurance. Cross-industries comparison could also be made, comparing the performance of the banking stocks with the stocks of other industries. We could then further evaluate to what extent an event may affect each region or industry differently. Through a series of events, e.g. the new policies released in Singapore which favored investors or the opening-up policy in China, sectors of the financial market across regions or industries will undoubtedly be affected differently. We are looking forward to doing more research into these aspects.
References
[1]. Sorescu, A., Warren, N.L. and Ertekin, L. (2017). Event study methodology in the marketing literature: an overview. Journal of the Academy of Marketing Science, [online] 45(2), pp.186–207.
[2]. DBS, (2023) The Development Bank of Singapore Limited, https://www.dbs.com.sg/
[3]. HSBC, (2023) The Hongkong and Shanghai Banking Corporation Limited, https://www.hsbc.com/
[4]. The 2008 Financial Crisis, Erkens, David H., Mingyi Hung, and Pedro Matos. (2012)"Corporate governance in the 2007–2008 financial crisis: Evidence from financial institutions worldwide." Journal of corporate finance18.2: 389-411.
[5]. Umar, Zaghum, et al. (2022) "The Impact of the Russia-Ukraine Conflict on the Connectedness of Financial Markets." Finance Research Letters 48: 102976.
[6]. The ILO. (2023) The International Labour Organization. https://www.ilo.org/
[7]. Seber, George AF, and Alan J. Lee. (2003) Linear regression analysis. Vol. 330. John Wiley & Sons.
[8]. Strong, Norman. (1992) "Modelling abnormal returns: A review article." Journal of Business Finance & Accounting 19.4 : 533-553.
[9]. Tan, J.B., Cook, M.J., Logan, P., Rozanova, L. and Wilder-Smith, A. (2020). Singapore’s Pandemic Preparedness: An Overview of the First Wave of COVID-19. International Journal of Environmental Research and Public Health, 18(1), p.252.
[10]. SingStat. (2023) Department of Statistics Singapore. https://www.singstat.gov.sg/
Cite this article
Xu,J.;Huang,Z.;Jiang,T. (2024). The Banking Stock Performance Singapore vs. Hong Kong. Advances in Economics, Management and Political Sciences,73,233-244.
Data availability
The datasets used and/or analyzed during the current study will be available from the authors upon reasonable request.
Disclaimer/Publisher's Note
The statements, opinions and data contained in all publications are solely those of the individual author(s) and contributor(s) and not of EWA Publishing and/or the editor(s). EWA Publishing and/or the editor(s) disclaim responsibility for any injury to people or property resulting from any ideas, methods, instructions or products referred to in the content.
About volume
Volume title: Proceedings of the 2nd International Conference on Financial Technology and Business Analysis
© 2024 by the author(s). Licensee EWA Publishing, Oxford, UK. This article is an open access article distributed under the terms and
conditions of the Creative Commons Attribution (CC BY) license. Authors who
publish this series agree to the following terms:
1. Authors retain copyright and grant the series right of first publication with the work simultaneously licensed under a Creative Commons
Attribution License that allows others to share the work with an acknowledgment of the work's authorship and initial publication in this
series.
2. Authors are able to enter into separate, additional contractual arrangements for the non-exclusive distribution of the series's published
version of the work (e.g., post it to an institutional repository or publish it in a book), with an acknowledgment of its initial
publication in this series.
3. Authors are permitted and encouraged to post their work online (e.g., in institutional repositories or on their website) prior to and
during the submission process, as it can lead to productive exchanges, as well as earlier and greater citation of published work (See
Open access policy for details).
References
[1]. Sorescu, A., Warren, N.L. and Ertekin, L. (2017). Event study methodology in the marketing literature: an overview. Journal of the Academy of Marketing Science, [online] 45(2), pp.186–207.
[2]. DBS, (2023) The Development Bank of Singapore Limited, https://www.dbs.com.sg/
[3]. HSBC, (2023) The Hongkong and Shanghai Banking Corporation Limited, https://www.hsbc.com/
[4]. The 2008 Financial Crisis, Erkens, David H., Mingyi Hung, and Pedro Matos. (2012)"Corporate governance in the 2007–2008 financial crisis: Evidence from financial institutions worldwide." Journal of corporate finance18.2: 389-411.
[5]. Umar, Zaghum, et al. (2022) "The Impact of the Russia-Ukraine Conflict on the Connectedness of Financial Markets." Finance Research Letters 48: 102976.
[6]. The ILO. (2023) The International Labour Organization. https://www.ilo.org/
[7]. Seber, George AF, and Alan J. Lee. (2003) Linear regression analysis. Vol. 330. John Wiley & Sons.
[8]. Strong, Norman. (1992) "Modelling abnormal returns: A review article." Journal of Business Finance & Accounting 19.4 : 533-553.
[9]. Tan, J.B., Cook, M.J., Logan, P., Rozanova, L. and Wilder-Smith, A. (2020). Singapore’s Pandemic Preparedness: An Overview of the First Wave of COVID-19. International Journal of Environmental Research and Public Health, 18(1), p.252.
[10]. SingStat. (2023) Department of Statistics Singapore. https://www.singstat.gov.sg/