


1. Introduction
In recent years, with the increasing maturity of China's stock market, more and more researchers and scholars have begun to study whether the CAPM model is effective in China's stock market. Most of the research shows that the model is partially applicable to certain industries in China's stock market. However, little research focused on whether the CAPM model applies to the pharmaceutical industry. In the past three years, different stock market sectors have changed significantly due to the impact of the COVID-19 pandemic. Most existing researches only focus on whether the CAPM model is effective during the pandemic, but do not compare whether the relationship between expected stock return and systematic risk changes before and after the pandemic. Therefore, in this paper, the BJS time series test and regression are conducted for the pharmaceutical industry before and after COVID-19 to compare and analyse the data. It also compares the relationship between expected stock returns and systematic risk in the market at the same time to summarize the impact of the market on the pharmaceutical industry. The first part of this paper briefly reviews the past scholars' research on CAPM; the second part briefly introduces the methodology used; the third part analyses the resulting data; and the fourth part draws conclusions based on the previous data analysis.
2. Literature Review
Markowitz proposed the Markowitz modern portfolio theory, whose main contributions include the use of the variance of stock returns as a measure of risk and the efficient frontier [1]. Sharpe, Lintner and Mossin then proposed and developed the CAPM, which mainly states that the expected excess return of any asset is directly proportional to its systematic risk [2-4]. In the CAPM model, β is used as a measure of systematic risk, which measures the price volatility of a stock relative to the stock market.
In the study of whether the CAPM model is valid or not, different views have been generated. The findings of Black et al and others are consistent with the model that there is a positive linear relationship between β and expected returns [5]. The most important point in their study was the creation of asset portfolios to eliminate the effects arising from firm-specific risks. However, Roll argued that the CAPM may not be testable [6]. This is because it cannot be proved that the market index portfolio is an efficient market portfolio. The reason is that as long as the approximate combination of market portfolios is mean-variance efficient, there exists a linear relationship between real returns and β.
During the research on CAPM for the Chinese market, most of the studies concluded that CAPM is not valid for the Chinese market. Jin Yunhui and others proved that stock returns are related to factors other than β and concluded that there is no linear relationship between stock returns and β [7]. Yuenan Wang failed to prove that there is a significant relationship between β coefficients and stock returns and argued that government intervention, irrational behaviours of individual investors and so on are the reasons for the lack of β effect in the market [8]. Xu, T.L. and Zhang, Y. found that the test results for the Shanghai stock market are partially the same as the CAPM model, i.e., there is a positive linear relationship between return and risk [9]. Zou Zhou et al. found after research that there is not only no positive but also no linear relationship between expected stock returns and systematic risk and argued that in addition to systematic risk, unsystematic risk also has a role in explaining stock returns [10]. Zhang Hu et al. argued that although China's stock market is maturing, the CAPM model is still not fully applicable to China's stock market because only a very low portion of portfolio returns can be explained by β [11]. Zhenyan Xiao et al. argued that although the CAPM has a certain degree of explanatory power for some industries, for the entire Shanghai stock market, the validity is far from enough [12].
During the epidemic, there were many studies on whether the pandemic would affect the validity of the CAPM. Mingke Zhang argues that the CAPM model is still not applicable to the Chinese stock market, which may be due to the fact that China's asset returns are still heavily influenced by non-systematic factors [13]. Qianqing Liu reconfirms that the CAPM model is not particularly suitable for the Chinese stock market [14]. The fundamental reason is that most of the preconditions assumed by the model do not hold in China.
Few researchers studied the validity of the CAPM model for the pharmaceutical industry and most of them believe that for the pharmaceutical industry, the CAPM model does not explain well the linear relationship between stock returns and β. Gong Zenan and others found that the CAPM is weak in explaining stock returns for the pharmaceutical industry, but it can be improved by dividing the period [15]. Fan Shicheng similarly demonstrated that CAPM is not applicable to the pharmaceutical industry [16].
3. Methodology
This paper conducts a comparative study of the market as a whole and the pharmaceutical industry separately over two time periods, the first from 1 January 2017 to 31 December 2019 (before the outbreak) and the second from 1 January 2020 to 31 December 2022 (during the outbreak). The study will analyse the daily closing prices of all listed pharmaceutical companies and all companies in the Chinese stock market in both periods. All companies listed in the Chinese stock market will be approximated as all companies listed on the Shanghai Stock Exchange (SSE), due to the good market representation of these companies listed on the SSE. There are 185 listed pharmaceutical stocks and 1,130 listed company stocks that existed during this six-year period and the data were obtained from the CSMAR database. The daily closing prices of the SSE index are used as an approximation for the market portfolio; thus, the market return can be calculated. Considering that the SSE index includes all stocks listed on the Shanghai Stock Exchange, is therefore well represented in the market. On the selection of risk-free rate, compared to developed countries like the UK, the Chinese government bond has long maturity. Moreover, most purchasers of government bonds are institutional investors. Thus, using the government bond rate as the risk-free rate is not in line with the situation of the Chinese stock market. On the other hand, savings are a large part of individual investors’ investments. Therefore, this study will use the interest rate of a one-year time deposit in China as the risk-free rate. And the annual rate will then be converted to a daily rate for consistency, which is 0.000041.
We used equation (1) to import historical data:
\( {R_{it}}-{R_{ft}}={α_{i}}+{β_{i}}({R_{mt}}-{R_{ft}})+{ε_{it}} \) (1)
Where:
\( {R_{it}} \) is the rate of return on asset i at time t
\( {R_{ft}} \) is the risk-free rate at time t
\( {R_{mt}} \) is the rate of return on the market portfolio at time t
\( {β_{i}} \) is the beta of stock i
\( {α_{i}} \) is the excess return on risk
\( {ε_{it}} \) is the random error term at time t
\( {R_{it}} \) = \( \frac{{P_{t}}-{P_{t-1}}}{{P_{t-1}}} \) , Pt is the current price of asset i, Pt-1 is the previous price of asset i
\( {R_{mt}} \) = \( \frac{{M_{t}}-{M_{t-1}}}{{M_{t-1}}} \) , Mt is the current price of SSE index, Mt-1 is the previous price of SSE index
The methodology of Black et al is used to test the validity of the CAPM model in the Chinese pharmaceutical industry market [5]. To apply the methodology, any three-year period will be divided into three phases (for example, to test the validity of the CAPM for the first three years in the pharmaceutical industry, we would divide the three years into three phases, each one year in length). In the first stage, βi for a single stock i will be estimated. Using equation (2), we estimate βi for this period using the Ordinary Least Squares (OLS) method. The βi we estimated is sorted from smallest to largest, then we divide these stocks into 20 portfolios. The first portfolio contains the stocks with the lowest beta and the last portfolio contains the stocks with the highest beta.
In the second stage, we calculate the average return of each portfolio and thus estimate the βp value for each portfolio using equation (2).
\( {R_{pt}}-{R_{ft}}={α_{p}}+{β_{p}}({R_{mt}}-{R_{ft}})+{ε_{pt}} \) (2)
\( {R_{pt}} \) is the average rate of return on portfolio p at time t
\( {β_{p}} \) is the beta of portfolio p
\( {α_{p}} \) is the excess return on risk
\( {ε_{pt}} \) is the random error term at time t
In the third stage, we test whether a linear relationship exists between βp values obtained in the second stage for each portfolio and the return for each portfolio through a regression.
\( {R_{p}}={γ_{0}}+{γ_{1}}{β_{p}}+{ε_{p}} \) (3)
\( {ε_{p}} \) is the random error term
\( {γ_{0}} \) and \( {γ_{1}} \) are estimated parameters, \( {γ_{0}} \) is \( {R_{f}} \) and \( { γ_{1}} \) is \( {R_{m}}-{R_{f}} \)
4. Result and Analyze
4.1. Estimation of β of Individual Stock
January 1, 2017 to December 31, 2017 is the first period of the first three years. January 1, 2020 to December 31, 2020 is the first period of the second three years.
4.1.1. Analysing the First Three Years
After performing the regression, the β values for 185 stocks in the pharmaceutical industry and 1130 stocks in the market are obtained, respectively, as shown in Table 1. Among these, more than half of the β values for both the market and the industry are greater than 1. There are stocks with negative β values for the market, which suggests that the direction of price change in these stocks is the opposite of the direction of price change in the market. However, all the β values for the industry are positive, which suggests that the direction of changes in security’s return is the same as the change in market return.
Table 1: Range of β (the first three years)
Industry β | Number | Percentage |
0<β<1 | 68 | 36.76% |
β>1 | 117 | 63.24% |
Market β | Number | Percentage |
β<0 | 2 | 0.18% |
β=0 | 1 | 0.09% |
0<β<1 | 299 | 26.46% |
β>1 | 828 | 73.27% |
4.1.2. Analysing the Second Three Years
Analysing the regression results of β for the latter three years (see Table 2), there is no significant commonality between the β values of the stocks in the pharmaceutical industry and the stocks in the market. However, except for one stock in the pharmaceutical industry whose β is less than 0, all the remaining stocks in the pharmaceutical industry and all the stocks in the market have β values greater than 0. Most of the β values of the stocks in the pharmaceutical industry are clustered in the range of 0 to 1, and more than half of the stocks in the market have β values greater than 1.
Table 2: Range of β (the second three years)
Industry β | Number | Percentage |
β<0 | 1 | 0.54% |
0<β<1 | 145 | 78.38% |
β>1 | 39 | 21.08% |
Market β | Number | Percentage |
0<β<1 | 547 | 48.41% |
β>1 | 583 | 51.59% |
4.1.3. Analysing the Significance of β
The p-value of β for every single stock in both periods of the market and the industry is zero, which proves that β is significant at a significance level of 1%, indicating the presence of systematic risk.
4.2. Estimation of portfolio β
4.2.1. Analysing the First Three Years
Table 3: Regression results of the industry (first three years)
Portfolio | β | α | R2 | p(α) | p(β) | ||
1 | 0.7095839 | -0.0012694 | 0.48 | 0.033 | 0.00 | ||
2 | 0.8963742 | -0.0005429 | 0.5185 | 0.433 | 0.00 | ||
3 | 0.7943589 | -0.0008697 | 0.4983 | 0.174 | 0.00 | ||
4 | 0.7248469 | -0.0002371 | 0.4871 | 0.691 | 0.00 | ||
5 | 0.9492549 | 0.0001096 | 0.5417 | 0.875 | 0.00 | ||
6 | 1.001221 | -0.0002073 | 0.4718 | 0.899 | 0.00 | ||
7 | 0.9421153 | -0.0003503 | 0.5294 | 0.623 | 0.00 | ||
8 | 0.983091 | -0.0000219 | 0.5788 | 0.974 | 0.00 | ||
9 | 1.157177 | 0.0005419 | 0.5745 | 0.497 | 0.00 | ||
10 | 1.019724 | -0.0001042 | 0.5357 | 0.891 | 0.00 | ||
11 | 0.996467 | -0.0001691 | 0.5158 | 0.827 | 0.00 | ||
12 | 0.9818438 | -0.0000329 | 0.5718 | 0.961 | 0.00 | ||
13 | 1.061808 | 0.0003687 | 0.5318 | 0.644 | 0.00 | ||
14 | 1.094914 | -0.0005647 | 0.6016 | 0.429 | 0.00 | ||
15 | 1.043556 | 0.0003357 | 0.5528 | 0.655 | 0.00 | ||
16 | 1.07391 | -2.19E-06 | 0.5722 | 0.998 | 0.00 | ||
17 | 1.141965 | 0.0001262 | 0.5767 | 0.872 | 0.00 | ||
18 | 1.18536 | -0.0002089 | 0.5789 | 0.797 | 0.00 | ||
19 | 1.154276 | 0.0003991 | 0.5684 | 0.62 | 0.00 | ||
20 | 1.214415 | -0.0001122 | 0.5202 | 0.904 | 0.00 |
Table 4: Regression results of the market (first three years)
Portfolio | β | α | R2 | p(α) | p(β) |
1 | 0.8292189 | -0.0005953 | 0.7883 | 0.085 | 0.00 |
2 | 0.874283 | -0.0003519 | 0.8242 | 0.277 | 0.00 |
3 | 0.9087113 | -0.0002746 | 0.8052 | 0.443 | 0.00 |
4 | 0.9571913 | -0.0001545 | 0.7858 | 0.7 | 0.00 |
5 | 0.9461618 | -0.0002273 | 0.8501 | 0.475 | 0.00 |
6 | 1.004606 | -0.0003003 | 0.7784 | 0.484 | 0.00 |
7 | 0.9690898 | 0.0001368 | 0.8107 | 0.715 | 0.00 |
8 | 1.061883 | -0.0001885 | 0.79 | 0.667 | 0.00 |
9 | 0.9959645 | -0.0000757 | 0.794 | 0.852 | 0.00 |
10 | 1.029507 | -0.0003285 | 0.7598 | 0.479 | 0.00 |
11 | 1.02355 | -0.0000204 | 0.7407 | 0.967 | 0.00 |
12 | 0.997379 | -0.0004203 | 0.7037 | 0.418 | 0.00 |
13 | 1.087454 | -0.0001076 | 0.752 | 0.83 | 0.00 |
14 | 1.099811 | -0.0001273 | 0.7142 | 0.819 | 0.00 |
15 | 1.013413 | -0.0001753 | 0.6999 | 0.742 | 0.00 |
16 | 1.067279 | -0.0000747 | 0.7223 | 0.888 | 0.00 |
17 | 1.116397 | -0.000048 | 0.7116 | 0.933 | 0.00 |
18 | 1.238909 | 0.0001836 | 0.7721 | 0.733 | 0.00 |
19 | 1.22146 | 0.000063 | 0.7563 | 0.91 | 0.00 |
20 | 1.279929 | 0.0003882 | 0.7452 | 0.518 | 0.00 |
January 1, 2018 to December 31, 2018 is the second period of the first three years. January 1, 2021 to December 31, 2021 is the second period of the second three years.
In both the first three years of the industry and the first three years of the market, more than half of the beta values were greater than 1 (see Table 3 and Table 4). This indicates that investors perceive pharmaceutical companies as having growth potential and are more likely to price the pharmaceutical industry for future growth. At the same time, when the market is experiencing a downward trend, investors are conservative and do not willing to wait for the companies to develop, and all these pharmaceutical stocks’ prices have fallen more than the market.
The p-values for β are all 0, proving that β is significant at a significance level of 1%, and these stocks are exposed to market risk.
Only one α in the first three years of the industry has a p-value less than 5%, and all α in the first three years of the market have a p-value greater than 5%. Hence the null hypothesis is not rejected. The result partially supports that there is no abnormal return.
Overall, the market’s R-square is larger than the industry’s, suggesting that the market’s explanatory power of β is stronger.
4.2.2. Analysing the Second Three Years
Table 5: Regression results of the industry (second three years)
Portfolio | β | α | R2 | p(α) | p(β) |
1 | 0.4076275 | 0.0011635 | 0.0656 | 0.183 | 0.00 |
2 | 0.4232174 | 0.0014013 | 0.078 | 0.091 | 0.00 |
3 | 0.4620949 | 0.000426 | 0.0888 | 0.612 | 0.00 |
4 | 0.3841589 | 0.0010722 | 0.0647 | 0.196 | 0.00 |
5 | 0.6283693 | 0.0008796 | 0.1894 | 0.234 | 0.00 |
6 | 0.5276795 | 0.0012965 | 0.1058 | 0.137 | 0.00 |
7 | 0.5178974 | 0.0010057 | 0.1366 | 0.174 | 0.00 |
8 | 0.6832174 | 0.0000277 | 0.1556 | 0.976 | 0.00 |
9 | 0.4966509 | 0.0006386 | 0.1203 | 0.402 | 0.00 |
10 | 0.5890657 | 0.0008197 | 0.1258 | 0.352 | 0.00 |
11 | 0.8622513 | 0.0006044 | 0.3074 | 0.411 | 0.00 |
12 | 0.6325312 | 0.0010279 | 0.1915 | 0.164 | 0.00 |
13 | 0.7197592 | 0.0003528 | 0.2091 | 0.657 | 0.00 |
14 | 0.5475663 | 0.0004277 | 0.1329 | 0.59 | 0.00 |
15 | 0.700285 | 0.0002998 | 0.1731 | 0.73 | 0.00 |
16 | 0.8020031 | 0.0017529 | 0.2066 | 0.05 | 0.00 |
17 | 0.9331737 | 0.0004492 | 0.2446 | 0.629 | 0.00 |
18 | 0.8373176 | 0.0010811 | 0.256 | 0.183 | 0.00 |
19 | 0.7730859 | 0.000545 | 0.2503 | 0.473 | 0.00 |
20 | 0.7162171 | 0.0007741 | 0.2173 | 0.316 | 0.00 |
Table 6: Regression results of the market (second three years)
Portfolio | β | α | R2 | p(α) | p(β) |
1 | 0.4050039 | 0.0008599 | 0.2168 | 0.050 | 0.00 |
2 | 0.5221359 | 0.0009436 | 0.3657 | 0.016 | 0.00 |
3 | 0.51827 | 0.0009565 | 0.3196 | 0.027 | 0.00 |
4 | 0.5794873 | 0.0010589 | 0.3152 | 0.030 | 0.00 |
5 | 0.608238 | 0.0012139 | 0.4115 | 0.004 | 0.00 |
6 | 0.6745999 | 0.0009736 | 0.34 | 0.069 | 0.00 |
7 | 0.6166104 | 0.0009685 | 0.2862 | 0.080 | 0.00 |
8 | 0.6676415 | 0.0006392 | 0.411 | 0.159 | 0.00 |
9 | 0.6763556 | 0.0006868 | 0.3601 | 0.180 | 0.00 |
10 | 0.7783173 | 0.0005595 | 0.4888 | 0.216 | 0.00 |
11 | 0.7837706 | 0.0009738 | 0.4694 | 0.040 | 0.00 |
12 | 0.7863867 | 0.0010184 | 0.4047 | 0.061 | 0.00 |
13 | 0.8241129 | 0.000778 | 0.5574 | 0.063 | 0.00 |
14 | 0.8681995 | 0.0009295 | 0.4922 | 0.064 | 0.00 |
15 | 0.8845478 | 0.0012331 | 0.4779 | 0.019 | 0.00 |
16 | 0.8675189 | 0.0009032 | 0.5179 | 0.058 | 0.00 |
17 | 0.8983843 | 0.0011066 | 0.5097 | 0.028 | 0.00 |
18 | 0.9350197 | 0.0007954 | 0.4778 | 0.152 | 0.00 |
19 | 1.068061 | 0.0007779 | 0.5795 | 0.133 | 0.00 |
20 | 1.138834 | 0.0003582 | 0.5873 | 0.508 | 0.00 |
As shown in Table 5 and Table 6, the market's β is greater than the industry’s, with two portfolios having a β greater than 1, suggesting that parts of the market are more active than the pharmaceutical industry.
The p-values for β are all 0, which implies that β is significant at a significance level of 1%, rejecting the null hypothesis of no exposure to market risk.
The p-values for α for the industry are all greater than or equal to 5%. Thus, the result partially supports that there is no abnormal return. Meanwhile, the p-values for α for the market are greater than 0.05 for 12 groups, equal to 0.05 for 1 group, and less than 0.05 for 7 groups, which is not informative.
In both the market and the industry, R2 is small, meaning that the actual explanatory power of the β is not as strong, and the equation does not fit as well. Compared to the market, the R2 is smaller in the industry, so the relative explanatory power of β is stronger in the market.
4.2.3. Comparison
Comparing the data for the first and second periods, we can conclude that in the second stage, the β of the portfolio is generally greater in the first three years than in the second three years, indicating that the market is more volatile in the first three years. Also, the fit is better in the first three years, suggesting that β explains the returns better in the first three years.
4.3. Testing the Relationship between Return and Risk
January 1, 2019 to December 31, 2019 is the third period of the first three years. January 1, 2022 to December 31, 2022 is the third period of the second three years.
We use β of the portfolios to explain the stock returns of each portfolio and find the relationship between the two through regression. The results obtained through regression are shown in Table 7 below:
Table 7: Regression results
Rm-Rf | Rf | R2 | p(Rm-Rf) | p(Rf) | ||
The First Three Years | Market | 0.0018827 | -0.0006862 | 0.3193 | 0.009 | 0.311 |
Industry | 0.0008516 | 0.000738 | 0.2090 | 0.074 | 0.117 | |
The Second Three Years | Market | -0.0013061 | 0.0001673 | 0.1671 | 0.043 | 0.686 |
Industry | -0.0009464 | 0.000632 | 0.3653 | 0.005 | 0.013 |
According to Figure 1 and Figure 2, we conclude that the slope of the lines of the industry and the market for the first three years are positive, indicating that the β and the stock return Rp show a positive correlation. The slope of the lines of the industry and the market in the last three years are both negative, suggesting that β and stock return Rp are negatively correlated (see Figure 3 and Figure 4). Meanwhile, the R2 of both the industry and the market in both periods are less than 0.5, indicating that the equations are not well fitted. In all four graphs, the fitted line and the theoretical line are plotted. A t-test is done for distance and the final p-value is less than 5%, so the null hypothesis that the actual return of the portfolio is equal to the theoretical return is rejected at a significant level of 5%.
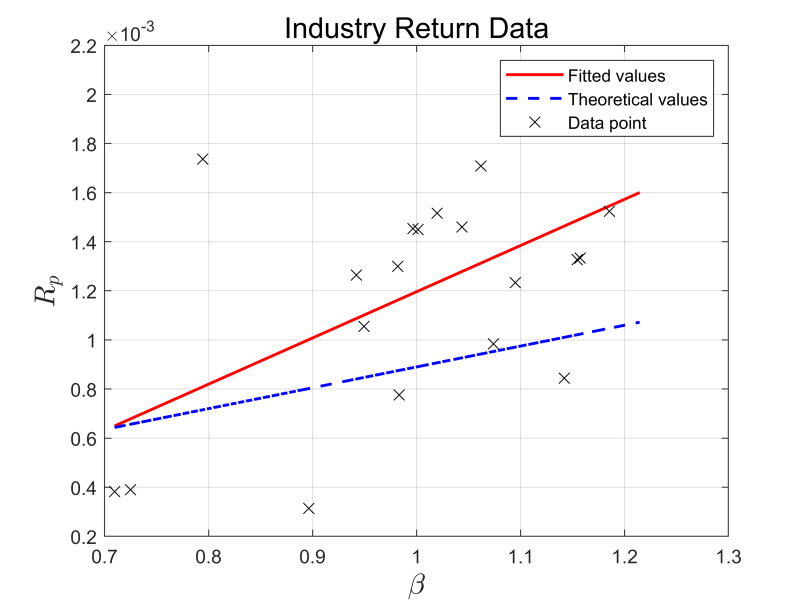
Figure 1: Industry return data (first three years)
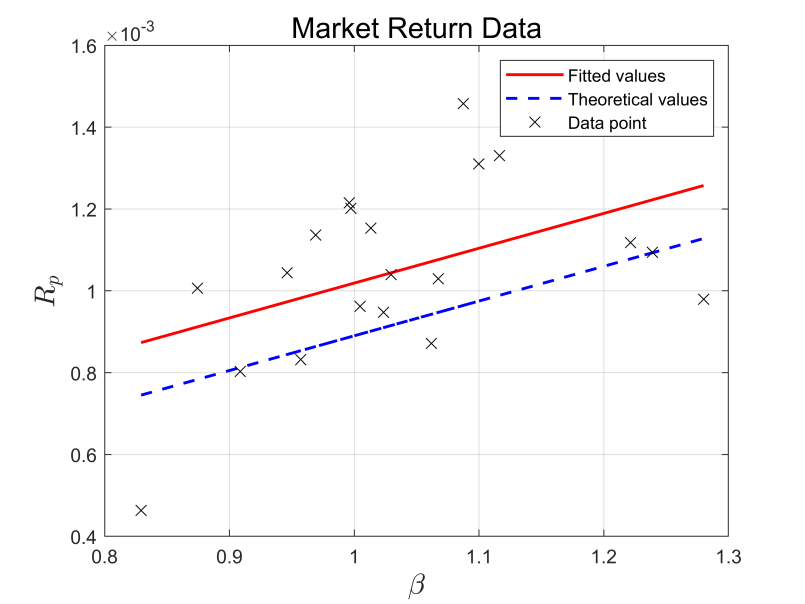
Figure 2: Market return data (first three years)
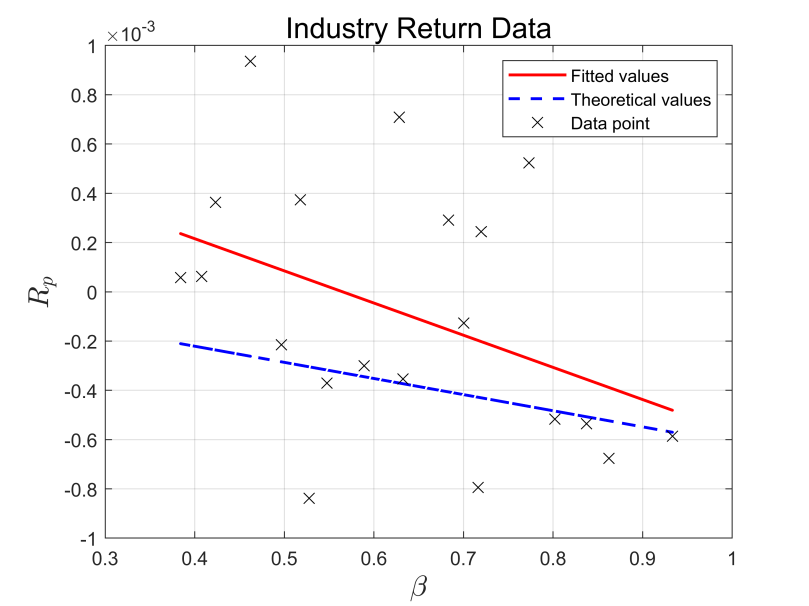
Figure 3: Industry return data (second three years)
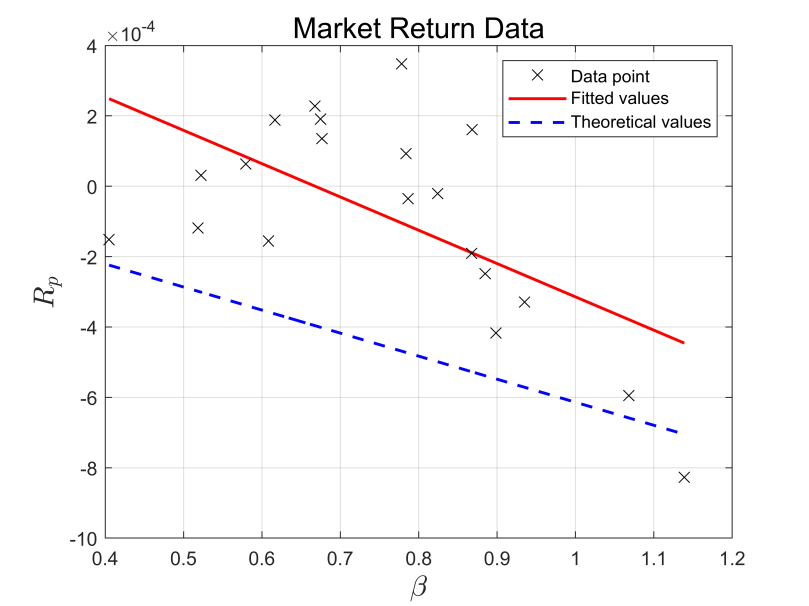
Figure 4: Market return data (second three years)
The commonality of these four graphs is that the fitted line is above the theoretical line, which implies that the actual return is higher than the expected one. This can be explained by two reasons: the first explanation is under the assumption that the market is efficient, but the model is not. This is because the model contains only one risk factor, β, but there are other possible risk factors in the market that may affect the return, thus causing the return to be underestimated. The second explanation is under the assumption that the market is not efficient, but the model is efficient. This is because the Chinese stock market is dominated by individual investors. They are easily affected by emotions and may fail to price stocks accurately due to the lack of professional knowledge, which may lead to the overvaluation of stocks.
In the comparison between the two time periods, we find that β and Rp in the market and pharmaceutical industry show a positive correlation in the first three years and a negative correlation in the second three years. This implies that the economy was experiencing a downward trend in the second period, i.e., Rm is less than Rf.
To sum up, our results show that the CAPM model is not valid in both the market and the pharmaceutical industry. Moreover, the CAPM model is even less applicable (i.e., less valid) in the latter period. We speculate that the following reasons may be responsible for the occurrence of the above differences:
The CAPM model is less applicable (i.e. less effective) in the latter three-year interval, and we suspect that the following may account for the above discrepancy.
1. For the supply side of the market, because of the COVID-19 pandemic, consumer demand declined, which ultimately affected the profits of businesses. During the pandemic, the economy was weak and a large number of companies were forced to shut down and lay off employees, causing incomes of consumers to fall, resulting in a significant drop in purchasing power. According to data from the CSMAR database, total retail sales of consumer goods fell month-on-month in the first six months of 2020. In March 2020, total retail sales of consumer goods fell by 15.8% year-on-year. This indicates that during the pandemic, consumer demand dropped, and purchasing power reduced too. The company, on the other hand, will resort to lower pricing in order to attract more consumers. The multiple influences result in lower profits for the companies and affect the stock market's estimation of the value of the companies. This ultimately leads to investors being reluctant to invest in firms in the market [17].
For the demand side of the market, there was an overall decline in market supply. After the start of the outbreak, if someone is infected, then all commercial activities and production activities are suspended. Therefore, companies were often faced with the inability to start work, resulting in an overall decline in market supply and lower profits. Investors are affected by the drop in profits and believe that companies are in financial trouble.
At the same time, the pharmaceutical industry was also negatively affected by the market. Not all companies in the pharmaceutical industry developed and made profits during the pandemic. Only those involved in the production of COVID-19-related medicines and vaccines and those producing masks made profits from it. Other companies, however, were affected by the pandemic, resulting in a decline in profits. For example, companies that produce chemical raw materials, medical devices and eye medicines were affected. Based on the data obtained from East Money, we have selected 13 companies among those producing chemicals, medical devices, and eye medicines. By comparing the profit growth rate in 2020 with other years, we can see that only three companies achieved a year-on-year increase in annual profit. Of these, Shapuais Pharmaceutical's annual profit growth rate was -2382.85%, and Harbin Pharmaceutical's annual profit growth rate was -957.69%, achieving a stunning decline.
2. During the pandemic, the stock market may be affected by investor sentiment. In the stock market, investors have limited attention and energy so they will focus their limited attention on specific stocks or specific things. As a result, investors will focus more on mainstream media coverage due to the impact of COVID-19. In 2020, when the pandemic began, investors in the market went into a panic. At the same time, the news and other media focused on news related to the pandemic, and investors' panic continued to increase, affecting investors' investments in the stock market. On the first trading day after the Chinese New Year break in 2020, a thousand stocks fell. At the same time, investor sentiment would have the same impact on the pharmaceutical industry [18].
3. During and after COVID-19, the Chinese government pursued a more restrained stimulus policy, probably because the government felt that current market liquidity was not low and corporate debt was not high. This resulted in the Chinese stock market not realizing a rapid rally. In contrast, the U.S. government offered subsidies to businesses and residents, which helped their stock market recover.
4. The policies introduced by the Chinese government also affect the pharmaceutical industry to some extent. Pharmaceutical companies are being asked to improve the quality of finished pharmaceutical products, which has led to an increase in production costs. At the same time, however, several policies have been introduced that require companies to lower their prices. The simultaneous effect of these two policies can lead to a fall in profits. Also, the policy of collective purchasing is a policy issued by the Chinese government, which makes medicines less expensive and helps people to reduce the burden of access to healthcare. The government acts as the purchaser and negotiates with the companies to entice them to tender by offering a large purchase volume. However, this is not necessarily good for the profitability of pharmaceutical companies, as it leads to a number of effects. Firstly, it will increase competition in the market. Secondly, centralised procurement of medicines usually requires higher quality standards and companies need to improve their product standards to ensure that they meet them. Finally, due to the large number of drugs to be procured, the government will require pharmaceutical companies to lower the price of drugs, which will put pressure on the companies.
5. During the pandemic, while more patients were using their health insurance to pay their bills, the National Healthcare Insurance Administration and hospitals might owe money to pharmaceutical companies. Consequently, the pharmaceutical companies were unable to recover the funds in the first place, so they included such revenues in accounts receivable, which increased their liabilities. When investors invest in stocks, they refer to the information disclosed by the company and its annual report. At the same time, too much debt can lead investment banks and other institutions to consider the company's current assets in poor condition when writing research reports, affecting the estimation of enterprise value. Between the two effects, it makes the stock price fall.
5. Conclusion
In this paper, we test the validity of the CAPM model in the pharmaceutical industry and the market using the methodology of Black et al [5]. In the second stage, β has good explanatory power in the first three years in the market and the pharmaceutical industry. Also, the market has better explanatory power when compared to the pharmaceutical industry. The portfolio β in the first period is generally greater than in the second period, suggesting that the market is more volatile in the first period than in the second period. Meanwhile, the market and the industry β in different periods are significant. Thus, we believe that these stocks are exposed to market risk. However, the results of the third stage show that, in general, we still believe that the CAPM model does not hold in the market and the industry. This is on the grounds that the null hypothesis that the portfolio's actual return is equal to the theoretical return is rejected through the t-test, and the equations are all poorly fitted. We found that β and Rp showed a positive correlation in the first three years, which is opposite to the results in the second three years. This thus suggests that in the second period, the country was experiencing an economic downturn, which resulted in the market return being less than the risk-free rate. Another conclusion is that the actual return is higher than predicted because the fitted line is all on top of the theoretical line. Finally, we have analysed the reasons why the CAPM model does not hold true in terms of the market, as well as reasons specific to the pharmaceutical industry, including policy implications and changes in demand and supply, among others.
Acknowledgments
Hanzhi Qin and Xinyi Yang contributed equally to this work and should be considered co-first authors.
References
[1]. Markowitz, H. (1952). Portfolio Selection. The Journal of Finance, 7(1), 77–91.
[2]. Sharpe, W. F. (1964). Capital asset prices: A theory of market equilibrium under conditions of risk. The journal of finance, 19(3), 425-442.
[3]. Lintner, J. (1965). The Valuation of Risk Assets and the Selection of Risky Investments in Stock Portfolios and Capital Budgets. Rev. Econ. Slat., 47, 13-37.
[4]. Mossin, J. (1966). Equilibrium in a capital asset market. Econometrica: Journal of the econometric society, 768-783.
[5]. Black, F., Jensen, M. C., & Scholes, M. (1972). The capital asset pricing model: Some empirical tests.
[6]. Roll, R. (1977). A critique of the asset pricing theory's tests Part I: On past and potential testability of the theory. Journal of financial economics, 4(2), 129-176.
[7]. Jin Yunhui, Liu Lin. (2001). An empirical study of CAPM in the Chinese stock market. Financial Research (07), 106-115.
[8]. Wang, Y., & Di Iorio, A. (2007). The cross section of expected stock returns in the Chinese A-share market. Global finance journal, 17(3), 335-349.
[9]. Xu, T.L., Zhang, Y.. (2005). An empirical analysis of the capital asset pricing model and the Shanghai stock market. Journal of Nanchang University (Science)(02),142-145+150.
[10]. Zou Zhou & Lou Baijun. (2013). The validity test of CAPM model in Shanghai stock market. Enterprise Economics (01), 173-175. doi:10.13529/j.cnki.enterprise.economy.2013.01.026.
[11]. Zhang, Hu & Zou, Yuanyuan. (2016). Adaptability test of Shanghai stock market based on CAPM model. Statistics and Decision Making (14), 164-166. doi:10.13546/j.cnki.tjyjc.2016.14.044.
[12]. Xiao, Z., Yang, Y., Li, L., & Zhong, Y. (2019, December). Empirical Test of the Effectiveness of CAPM for Shanghai Stock Market-Based on Industry Grouping. In Fourth International Conference on Economic and Business Management (FEBM 2019) (pp. 63-68). Atlantis Press.
[13]. Zhang, M. Effectiveness of CAPM Model for Funds Based on Margin Trading in Chinese Market under the COVID-19 Pandemic.
[14]. Liu, Q. Research on Chinese stock market based on CAPM: pre and post Covid-19 pandemic.
[15]. Kung, Zenan & Huang, Ruyue. 2011 A new species of the genus Lepidoptera (Lepidoptera, Lepidoptera). (2020). An empirical test and cyclical impact study of domestic market based on CAPM model - A case study of biomedical industry. Southern Agricultural Machinery (11), 43-44.
[16]. S. V. Fan. (2021). An empirical study based on CAPM model in Chinese medicine industry. China Collective Economy (17), 66-68.
[17]. Yao, Lu Shi, Zhang Yating & Wang Xiaojia. 2011 A new species of the genus Lepidoptera (Lepidoptera, Lepidoptera) from China. (2022). A study on the shock effect of the new coronary pneumonia epidemic on the capital market. Journal of Hefei University of Technology (Social Science Edition) (04), 43-50+101.
[18]. Gu, Hongmei & Zhang, Man-Ling. 2011 A new species of the genus Lepidoptera (Hymenoptera, Braconidae, Lepidoptera). (2023). Investor sentiment and stock market - based on COVID-19 epidemic outbreak. Shanghai Finance (03), 44-56. doi:10.13910/j.cnki.shjr.2023.03.004.
Cite this article
Qin,H.;Yang,X. (2024). The Impact of COVID-19 Pandemic on the Effectiveness of the CAPM Model: Evidence from the Chinese Market and Pharmaceutical Industry. Advances in Economics, Management and Political Sciences,73,253-265.
Data availability
The datasets used and/or analyzed during the current study will be available from the authors upon reasonable request.
Disclaimer/Publisher's Note
The statements, opinions and data contained in all publications are solely those of the individual author(s) and contributor(s) and not of EWA Publishing and/or the editor(s). EWA Publishing and/or the editor(s) disclaim responsibility for any injury to people or property resulting from any ideas, methods, instructions or products referred to in the content.
About volume
Volume title: Proceedings of the 2nd International Conference on Financial Technology and Business Analysis
© 2024 by the author(s). Licensee EWA Publishing, Oxford, UK. This article is an open access article distributed under the terms and
conditions of the Creative Commons Attribution (CC BY) license. Authors who
publish this series agree to the following terms:
1. Authors retain copyright and grant the series right of first publication with the work simultaneously licensed under a Creative Commons
Attribution License that allows others to share the work with an acknowledgment of the work's authorship and initial publication in this
series.
2. Authors are able to enter into separate, additional contractual arrangements for the non-exclusive distribution of the series's published
version of the work (e.g., post it to an institutional repository or publish it in a book), with an acknowledgment of its initial
publication in this series.
3. Authors are permitted and encouraged to post their work online (e.g., in institutional repositories or on their website) prior to and
during the submission process, as it can lead to productive exchanges, as well as earlier and greater citation of published work (See
Open access policy for details).
References
[1]. Markowitz, H. (1952). Portfolio Selection. The Journal of Finance, 7(1), 77–91.
[2]. Sharpe, W. F. (1964). Capital asset prices: A theory of market equilibrium under conditions of risk. The journal of finance, 19(3), 425-442.
[3]. Lintner, J. (1965). The Valuation of Risk Assets and the Selection of Risky Investments in Stock Portfolios and Capital Budgets. Rev. Econ. Slat., 47, 13-37.
[4]. Mossin, J. (1966). Equilibrium in a capital asset market. Econometrica: Journal of the econometric society, 768-783.
[5]. Black, F., Jensen, M. C., & Scholes, M. (1972). The capital asset pricing model: Some empirical tests.
[6]. Roll, R. (1977). A critique of the asset pricing theory's tests Part I: On past and potential testability of the theory. Journal of financial economics, 4(2), 129-176.
[7]. Jin Yunhui, Liu Lin. (2001). An empirical study of CAPM in the Chinese stock market. Financial Research (07), 106-115.
[8]. Wang, Y., & Di Iorio, A. (2007). The cross section of expected stock returns in the Chinese A-share market. Global finance journal, 17(3), 335-349.
[9]. Xu, T.L., Zhang, Y.. (2005). An empirical analysis of the capital asset pricing model and the Shanghai stock market. Journal of Nanchang University (Science)(02),142-145+150.
[10]. Zou Zhou & Lou Baijun. (2013). The validity test of CAPM model in Shanghai stock market. Enterprise Economics (01), 173-175. doi:10.13529/j.cnki.enterprise.economy.2013.01.026.
[11]. Zhang, Hu & Zou, Yuanyuan. (2016). Adaptability test of Shanghai stock market based on CAPM model. Statistics and Decision Making (14), 164-166. doi:10.13546/j.cnki.tjyjc.2016.14.044.
[12]. Xiao, Z., Yang, Y., Li, L., & Zhong, Y. (2019, December). Empirical Test of the Effectiveness of CAPM for Shanghai Stock Market-Based on Industry Grouping. In Fourth International Conference on Economic and Business Management (FEBM 2019) (pp. 63-68). Atlantis Press.
[13]. Zhang, M. Effectiveness of CAPM Model for Funds Based on Margin Trading in Chinese Market under the COVID-19 Pandemic.
[14]. Liu, Q. Research on Chinese stock market based on CAPM: pre and post Covid-19 pandemic.
[15]. Kung, Zenan & Huang, Ruyue. 2011 A new species of the genus Lepidoptera (Lepidoptera, Lepidoptera). (2020). An empirical test and cyclical impact study of domestic market based on CAPM model - A case study of biomedical industry. Southern Agricultural Machinery (11), 43-44.
[16]. S. V. Fan. (2021). An empirical study based on CAPM model in Chinese medicine industry. China Collective Economy (17), 66-68.
[17]. Yao, Lu Shi, Zhang Yating & Wang Xiaojia. 2011 A new species of the genus Lepidoptera (Lepidoptera, Lepidoptera) from China. (2022). A study on the shock effect of the new coronary pneumonia epidemic on the capital market. Journal of Hefei University of Technology (Social Science Edition) (04), 43-50+101.
[18]. Gu, Hongmei & Zhang, Man-Ling. 2011 A new species of the genus Lepidoptera (Hymenoptera, Braconidae, Lepidoptera). (2023). Investor sentiment and stock market - based on COVID-19 epidemic outbreak. Shanghai Finance (03), 44-56. doi:10.13910/j.cnki.shjr.2023.03.004.