


1. Introduction
The fact is the wealthiest 1% of the world's population holds more wealth than the entire bottom 50% combined. This dramatic fact reminds us of the global income inequality that we must confront.
The dynamic nature of our world has ushered in a plethora of global threats, each with the power to shape societies, economies, and our shared future. From the dramatic change caused by COVID-19 to the long going consequences made by climate change, to the impact from political conflicts. All of these threats cast a long shadow over our aspirations for global prosperity and stability. This article will firstly discuss different voices from academic field, discover key findings and illustrating the complex relationship between income inequality and global threats. This article will be contributed to academic filed due to following reasons: First, the universality and urgency of global threats require a comprehensive understanding of their impact beyond disciplinary boundaries. Second, the effects of income inequality ripple throughout society, affecting economic stability, social cohesion and political dynamics. Finally, by unraveling the threads of these issues, we can chart a course for effective policy, global cooperation and transformative action. The output of this paper, therefore, will contribute to the academic community in examining the relationship between global income inequality and global threats. Understanding and parsing global threats lays the foundation for future solutions to these century-old intractable problems.
2. Literature Review
2.1. COVID-19 and Global Income Inequality
This article focuses on the impact of the COVID-19 epidemic on global income inequality. The article points out that the epidemic posed a greater threat to the less educated and lower-income individuals, while the more educated and higher-income individuals were mostly able to safely stay home and continue to work. While domestic income inequality has increased, in the United States and many other countries, large-scale government income support programs have offset this increase. However, international income inequality may be different, and there is a widespread belief that the epidemic has or will increase income disparities between countries. The article also refers to the relationship between COVID-19 deaths and GDP per capita growth in 2020 and suggests that stopping deaths is the way to achieve economic growth and that there is no trade-off between life and the economy.
The main finding of this paper is that global inequality measures are different and if weighted by the population of each country, the COVID-19 epidemic has led to an increase in global income inequality mainly because of the poorer economic performance of India. However, when calculated on a per-country-as-a-unit basis, global inequality continued to decline during the epidemic, even more rapidly. In addition, this paper finds that the extent of the economic impact of the COVID-19 epidemic on different countries is strongly correlated with their COVID-19 death tolls, with richer countries growing more slowly than poorer ones. These findings are supported by data; for example, the authors use IMF and World Bank forecast data to show a negative correlation between COVID-19 deaths and economic growth rates.
The authors use IMF and World Bank projection data in the second and third paragraphs. An example of the negative correlation between COVID-19 deaths and economic growth rates can be found in Figure 1. Figure 1 shows the relationship between the IMF's projected GDP per capita growth rate from 2019 to 2020 and the number of COVID-19 deaths per million population. The number of COVID-19 deaths has a negative correlation with the economic growth rate, as the more deaths there are, the lower the economic growth rate. For example, China has a lower number of COVID-19 deaths and a positive GDP per capita growth rate, while the United States has a higher number of COVID-19 deaths and a negative GDP per capita growth rate.
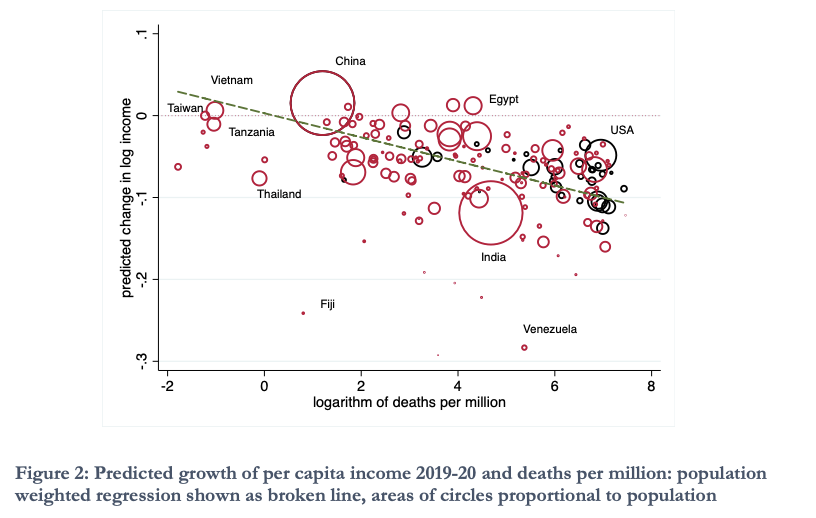
Figure 1: The predicted growth of per capita income 2019-20 and deaths per million: population-weighted regression shown as a broken line, areas of circles proportional to population. By Angus Deaton [1]
The limitations of this paper are mainly the following:
• Methodological problems: The paper points out that there are some serious methodological problems in calculating global inequality. There are some political problems with both the concepts of weighting by country and weighting by population. Measures that are not weighted by country are very sensitive to the inclusion or exclusion of small countries, while those that are weighted by population tend to rely heavily on the cases of India and China. Thus, whichever measure is chosen, there are limitations.
• The impact of small countries: The presence or absence of small countries has an impact on the results of unweighted measures. For example, Macau's GDP per capita is expected to drop by more than half due to the epidemic that hit its gambling, entertainment, and tourism industries. This causes Macau to fall from first to ninth in the global per capita income rankings, which has a large impact on unweighted global inequality. Thus, the presence of small countries can have a large impact on the measurements.
• Limitations of GDP: This paper points out that the problem with the richest countries goes far beyond their small size; the more important problem is that their Gross Domestic Product (GDP) is an extremely inaccurate measure of the material well-being of their residents. Many rich countries suffer from tax avoidance, and their GDP includes profits, including those earned by non-citizens, and therefore can be inaccurate.
2.2. Political Instability: Effects on Financial Development, Roots in the Severity of Economic Inequality
This article focuses on the impact of political instability on financial development and the relationship between the severity of economic inequality and political instability. The article points out that the political economy theory has some applicability in explaining financial development and backwardness in developed countries but is weak in explaining financial markets in developing countries. The article also mentions that political instability has an important hindering effect on economic development, while financial development has an important driving effect on economic development. Therefore, there is a close relationship between political stability and financial development. In addition, the article also mentions that there is a correlation between the severity of economic inequality and political instability, firstly, political instability leads to an increase in investors' uncertainty about the country, which reduces their confidence and willingness to invest in the financial market. This may lead to capital outflows and reduced investment, which in turn affects the development and growth of financial markets. In addition, political instability may lead to increased social unrest and conflict, which in turn may hurt economic activities and financial markets. Social unrest and conflict may lead to decreased productivity, loss of wealth, and destruction of infrastructure, all of which can adversely affect the development and stability of financial markets.
The limitation of this paper is the time limit of the data. The authors use Alesina and Perotti's index of political instability to predict financial development, but the data for this index is only collected up to 1982, so it has limited implications for political instability in more recent years. To compensate for this limitation, the authors use the government crisis variable from the Cross-National Time Series (CNTS) database and generate a moving political instability index. However, this database is also available only up to 2003. Therefore, the findings of this paper may have some limitations concerning the relationship between financial development and political instability in more recent years.
One of the solutions in terms of political conflict is to have a government that could not only effectively aim to help the domestic country to develop better but also to enable the world to become a united village. Therefore, the role of global governance become significant. The role of global governance is to facilitate cooperation, coordination, and decision-making among countries and international organizations to address shared challenges, promote global stability, and foster sustainable development. Under such circumstances, global governance could be beneficial to mitigate global income inequality, such as promoting fair trade and economic policies, tackling tax evasion and illicit financial flows, resolving conflicts, and maintaining peace.
However, according to a study, there is no “real global governance”. International organizations such as the UN, unlike a global government that has centralized decision-making and enforcement powers, the UN is a collection of member states with sovereignty over their affairs. The UN does not possess the authority to impose binding decisions on its member states.
2.3. For Whom the Bell Tolls: Climate Change and Income Inequality
This article focuses on the relationship between climate change and income inequality. Using large panel data for 158 countries for the period 1995 to 2019, the study finds that increased vulnerability to climate change is positively associated with rising income inequality. In particular, the impact of climate change vulnerability on income distribution is more pronounced in developing countries, largely due to their weaker capacity for climate change adaptation and mitigation. The study also points out that income inequality should be explicitly considered when designing climate change adaptation and mitigation policies to protect the most vulnerable and address disparities equitably [2].
The limitations of this paper include the following:
• Data limitation: The dataset used in this paper is based on the Standardized World Income Inequality Database (SWIID), which covers 177 countries but only has data from 1960 to the present. This may limit the analysis of earlier and more recent data.
• Indicator limitations: The climate change vulnerability and resilience index used in this paper is based on the ND-GAIN index, a composite measure of a country's vulnerability and adaptive capacity to climate change, which is calculated based on 45 indicators. However, these indicators may not fully capture the effects of climate change on income inequality because they may be correlated with macroeconomic variables.
• Regression model limitation: this paper uses regression models (Regression models can quantify the effects of climate change vulnerability and resilience on income distribution.) and the panel VAR method (Panel Vector Autoregression (PVAR) is a statistical method used to analyze the dynamic relationship between variables in panel data.) to analyze the relationship between climate change and income inequality. However, regression modeling can only provide correlation and cannot determine causation. In addition, the panel VAR approach has its limitations, such as the requirement for data stability and endogeneity.
• Limitations of the scope of the study: the scope of this paper covers 158 countries but does not represent all countries. Therefore, the findings may not apply to other countries not included in the sample.
2.4. After the financial crisis: the evolution of the global income distribution between 2008 and 2013
This article focuses on the evolution of global income distribution from 2008 to 2013. The article notes that global inequality continued to decline, largely attributable to China's economic growth, explaining the halving of the global Gini coefficient between 2008 and 2013. Income growth among the world's richest 1 percent slowed markedly, even as survey data corrected for the possible underestimation of top incomes. The article also discusses the impact of the financial crisis on the economy and mentions the possibility of a more severe crisis triggered by a pandemic in 2019-2020. The article also mentions the countries/percentiles in the global income distribution that were among the richest 1% in the world in 2008 and their real growth experience. The article also discusses the countries/percentiles in the 40% to 50% global percentile of the global income distribution from 2008 to 2013 (i.e., the "global middle class"), that experienced the fastest growth during this period. The article also mentions how to correct the underestimation of top incomes, as well as the data sources and types of surveys used.
The author points out that this study was completed before the outbreak of the COVID-19 pandemic, and due to the impact of the pandemic, the trends in global income distribution may undergo changes. The exact extent of the COVID-19 pandemic's impact cannot be accurately estimated at present, as the duration of the economic downturn depends on our ability to control the virus, and the spread of the pandemic and economic challenges is also difficult to predict. The author mentions that the growth disparity between China and the West may continue to exist, but the effects of the pandemic on other impoverished and middle-income countries such as India, Brazil, Nigeria, the Congo, and Indonesia are hard to foresee. If the growth rates of these countries slow down or even enter negative territory, the global trend toward convergence could be hindered or even reversed.
The "elephant diagram" is a graphical representation used in economics to depict changes in global income distribution over time, particularly focusing on the impact of globalization [3]. The diagram resembles the shape of an elephant, with its distinctive hump and elongated trunk. It was popularized by economist Branko Milanovic and gained attention for its ability to visually capture shifts in income distribution across various income percentiles. Figure 2 and 3 in the academic paper has some similarities with the elephant diagram. To be more specific, the overall trend of the diagram after the 20 percentile of global income distribution is quite similar. The curve was firstly increasing up to 75% of cumulative gain in real income (increase in purchasing power that an individual or household experiences over time due to inflation-adjusted wage increases, promotions, or other sources of income growth.) and the gradient of the curve experienced a sudden drop to around 0%. However, there was an increase after the 80 percentiles. Nevertheless, there are some differences in these two diagrams as well. The “tail” of the elephant diagram represents the income growth of the poorest 10% of the global population. The tail is often referred to as the "lost generation" because this group has seen little to no income growth over the past few decades.
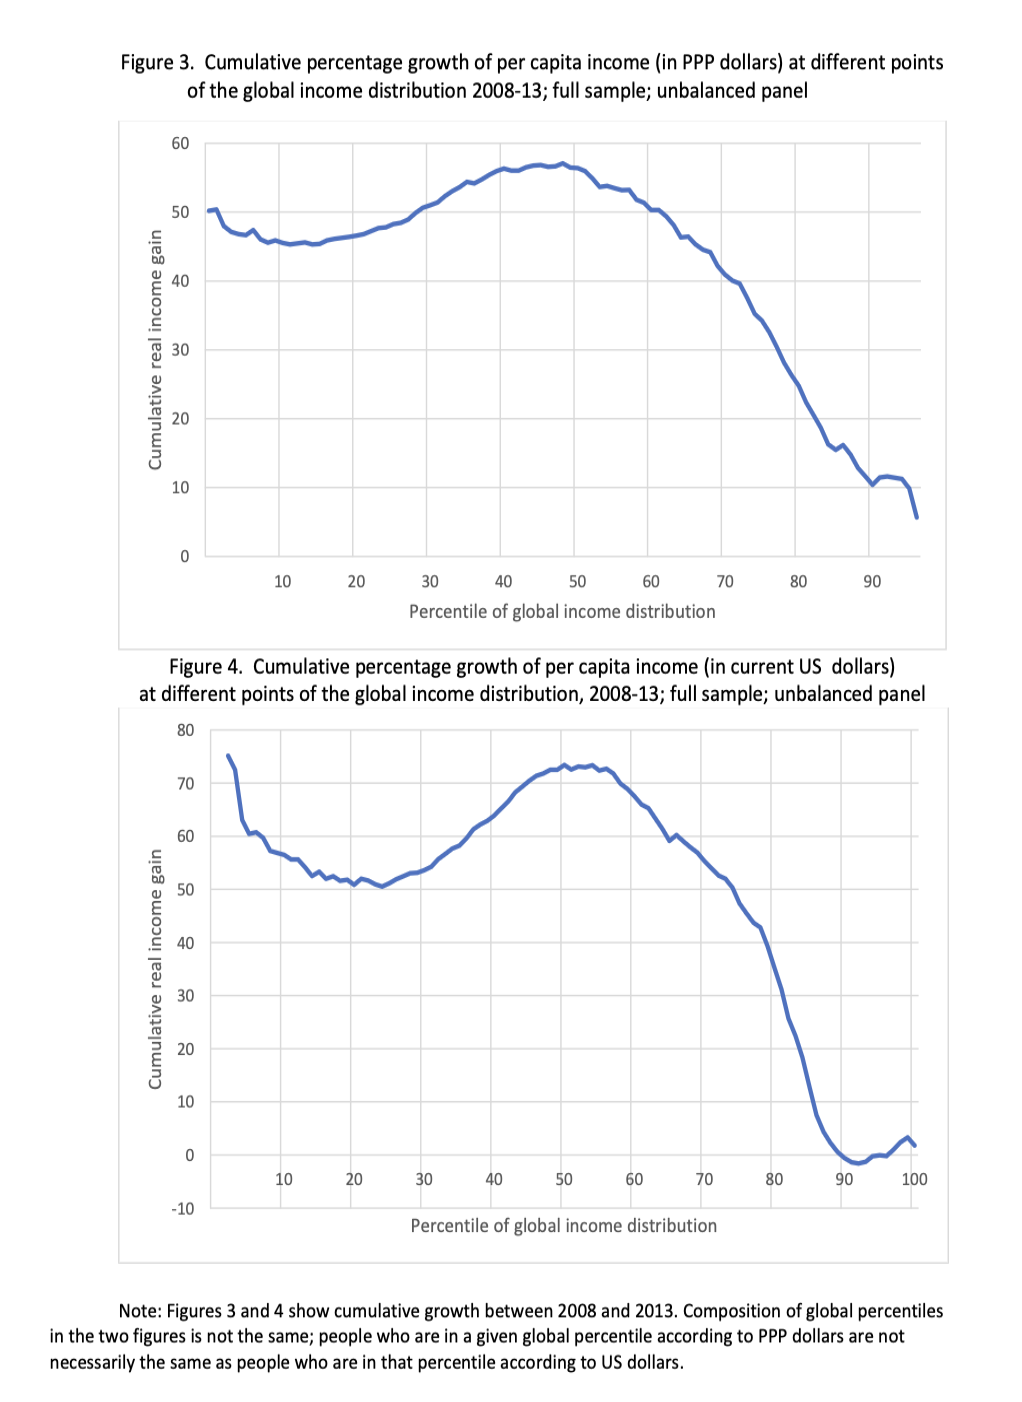
Figure 2: Cumulative percentage growth of per capita income at different points of the global income distribution 2008-13. By Milanovic, Branko [4]

Figure 3: Cumulative percentage growth of per capita income (in current US dollars) at different points of the global income distribution, 2008-13. By Milanovic, Branko [4]
While there has been significant growth in income for the middle class in developing countries (especially India and China), the middle class in developed countries has seen little to no growth, and the top 1% has seen a significant increase in income. This increase is often attributed to factors such as globalization, technological advancements, and changes in labor markets that have led to greater demand for highly skilled workers. However, figures 2 and 3 demonstrate that there was a decrease in cumulative real income gain in underdeveloped countries, and most importantly, the top one percent of the global income distribution had a lower growth rate, growing by only 2 to 3 percent. This suggests that the incomes of the world's richest people are growing more slowly. The reason behind this is due to the impact of the global financial crisis has been more severe in rich countries than in other countries, which has led to slower income growth among the richest During the crisis, economic growth has been slower in rich countries and income growth among the richest 1 percent of the population has lagged far behind the growth of the global median As a result, income growth has been slower for the world's richest people [5].

Figure 4: Relative gain in real per capita income by global income level, 1988-2008. By Branko Milanovic [3]
3. Personal perspective: The relationship between global threats and global governance: which one has the largest contribution?
The COVID-19 pandemic has had a significant impact on the exacerbation of income disparities globally. The rapid and far-reaching economic and social impact of the pandemic has exposed vulnerabilities within our systems, highlighting gaps in access to health care, education, and stable employment. The epidemic has disproportionately impacted low-income individuals who lack the privilege of telework and financial safety nets. And in a state of persistent isolation, consumers stop spending and start saving. Producers, especially those with brick-and-mortar stores, will lose money. In the long run, businesses will fail, such as Hertz Global Holdings. The crisis exposed the social infrastructure gaps that perpetuate inequality, and the ensuing recession has further exacerbated these gaps.
While climate change poses a long-term threat, its immediate impact on income inequality may be less pronounced. The impacts of climate change tend to be cumulative over time, especially in vulnerable areas that are heavily dependent on agriculture and are susceptible to extreme weather events. The impact of political conflict has not been very prominent relative to the former. Although there is an economic downturn and stagnation in Europe caused by the war between Russia and Ukraine starting in 2022, as well as shortages in, for example, oil. In this case, political conflict can discourage foreign investment and lead to capital flight, leading to income inequality. However, this is still much smaller than the impact of the New Crown epidemic on the global economy. This is mainly because the epidemic is global, that it is a global quarantine of all people, and the number of infected people and the death rate have been rising. With such a large-scale impact there is bound to be an economic impact.
Secondly, the outbreak has forced governments to impose embargoes, leading to a sharp decline in economic activity, unemployment, and loss of income in several sectors around the globe. Political conflict, while destructive, may not lead to such a widespread economic shutdown. However, it is critical to recognize that these global threats are interconnected and often exacerbate each other. For example, climate change, which exacerbates resource scarcity, can exacerbate political conflict, lead to large-scale migration, put pressure on the economy, and exacerbate social tensions.
4. Conclusion
Each of the global threats could have a dramatic impact on global income inequality. The COVID-19 pandemic underscored the vulnerability of marginalized populations, highlighting the inherent inequalities in access to healthcare, education, and economic opportunities. The disproportionate impact on lower-income individuals and the widening gap between the rich and the poor exposed the fragility of existing systems. Climate change, with its potential to reshape economies and displace communities, further deepens the rift between income groups, particularly in developing nations that lack robust adaptation measures.
Meanwhile, political conflicts and instability disrupt economic activities, undermining growth and leaving societies grappling with disparities. Global governance could potentially play a role that could alleviate this problem, and actively participate and act against these threats. However, what is obvious is that “real” global governance is still hard to archive, but what can not be underestimated is the significance to promote global corporations, solving global income inequality-related problems, and mitigating the consequences which global threats could bring to the world. Lastly, there was still a difference in terms of studying the income gain of the top 1 percentile. An examination of the "elephant diagram" and its description of changes in income distribution emphasizes the complexity of the economic forces at work. The rise of the richest 1 percent of the population in developed economies highlights the impact of globalization, technological progress, and financialization, among other factors.
All in all, this paper delves into the multifaceted relationship between global threats and income inequality. It examines the impact of pandemics, climate change, political conflicts, and economic downturns on income disparities, revealing their interconnectedness and potential cumulative effects through a literature review of papers that relate to these threats.
References
[1]. Deaton, A. (2021). COVID-19 and Global Income Inequality. https://doi.org/10.3386/w28392
[2]. Cevik, S. & Jalles, J T. (2022). For Whom the Bell Tolls: Climate Change and Inequality. IMF Working Papers, 2022 (103), 1-1. https://doi.org/10.5089/9798400208126.001.
[3]. Kharas, H. & Seidel, B. (2018). What’s Happening to the World Income Distribution? The Elephant Chart Revisited. Brookings. https://datama.click/world-inequality-report-elephant-graph.
[4]. Milanovic, B. (2008). After the financial crisis: the evolution of the global income distribution between 2008 and 2013. Munich Personal RePEc Archive. https://mpra.ub.uni-muenchen.de/101560/1/MPRA_paper_101560.pdf.
[5]. Roe, M. J. & Siegel, J. I. (2011). Political Instability: Effects on Financial Development, Roots in the Severity of Economic Inequality. Journal of Comparative Economics, 39 (3), 279–309, https://doi.org/10.1016/j.jce.2011.02.001.
Cite this article
Tian,Z. (2024). Unveiling the Shadows: Exploring the Nexus of Global Threats and Income Inequality. Advances in Economics, Management and Political Sciences,82,78-84.
Data availability
The datasets used and/or analyzed during the current study will be available from the authors upon reasonable request.
Disclaimer/Publisher's Note
The statements, opinions and data contained in all publications are solely those of the individual author(s) and contributor(s) and not of EWA Publishing and/or the editor(s). EWA Publishing and/or the editor(s) disclaim responsibility for any injury to people or property resulting from any ideas, methods, instructions or products referred to in the content.
About volume
Volume title: Proceedings of the 2nd International Conference on Financial Technology and Business Analysis
© 2024 by the author(s). Licensee EWA Publishing, Oxford, UK. This article is an open access article distributed under the terms and
conditions of the Creative Commons Attribution (CC BY) license. Authors who
publish this series agree to the following terms:
1. Authors retain copyright and grant the series right of first publication with the work simultaneously licensed under a Creative Commons
Attribution License that allows others to share the work with an acknowledgment of the work's authorship and initial publication in this
series.
2. Authors are able to enter into separate, additional contractual arrangements for the non-exclusive distribution of the series's published
version of the work (e.g., post it to an institutional repository or publish it in a book), with an acknowledgment of its initial
publication in this series.
3. Authors are permitted and encouraged to post their work online (e.g., in institutional repositories or on their website) prior to and
during the submission process, as it can lead to productive exchanges, as well as earlier and greater citation of published work (See
Open access policy for details).
References
[1]. Deaton, A. (2021). COVID-19 and Global Income Inequality. https://doi.org/10.3386/w28392
[2]. Cevik, S. & Jalles, J T. (2022). For Whom the Bell Tolls: Climate Change and Inequality. IMF Working Papers, 2022 (103), 1-1. https://doi.org/10.5089/9798400208126.001.
[3]. Kharas, H. & Seidel, B. (2018). What’s Happening to the World Income Distribution? The Elephant Chart Revisited. Brookings. https://datama.click/world-inequality-report-elephant-graph.
[4]. Milanovic, B. (2008). After the financial crisis: the evolution of the global income distribution between 2008 and 2013. Munich Personal RePEc Archive. https://mpra.ub.uni-muenchen.de/101560/1/MPRA_paper_101560.pdf.
[5]. Roe, M. J. & Siegel, J. I. (2011). Political Instability: Effects on Financial Development, Roots in the Severity of Economic Inequality. Journal of Comparative Economics, 39 (3), 279–309, https://doi.org/10.1016/j.jce.2011.02.001.