


1. Introduction
The stock market is a dynamic and complex system influenced by various factors, including economic indicators, investor sentiment, market news, etc. Market participants and researchers have long been interested in understanding whether there is a verifiable relationship between news and stock price movements. Therefore, this paper aims to explore the correlation between news and stock prices by leveraging stock market indices. Additionally, it seeks to investigate the potential of news classification as a tool for making better investment decisions.
Stock market indices, such as the S&P 500 or the Dow Jones Industrial Average, are widely recognized benchmarks for assessing overall market performance. These indices comprise a representative sample of stocks from various sectors and are considered indicators of market sentiment and investor confidence. Analyzing the relationship between news events and the corresponding movement of these indices can provide valuable insights into the impact of news on stock prices at a broader market level.
In recent years, advancements in natural language processing (NLP) and machine learning techniques have revolutionized the field of news analysis. It encompasses a range of techniques, such as text parsing, sentiment analysis, and topic modeling, that allow for extracting meaningful information from textual data. It can also biautomatically learn patterns and relationships from data. It can be applied to analyze vast amounts of news data, identify relevant features, and make predictions or classifications based on the extracted information.
By employing NLP techniques, researchers have been able to classify news articles into sentiment categories, such as positive, negative, or neutral, based on the underlying tone of the text. Sentiment analysis helps gauge the overall market sentiment and can provide insights into the potential impact of news on stock prices. One common approach in sentiment analysis is using lexicon-based methods, where a predefined set of words with sentiment scores is used to assess the sentiment of a given text. Ding, Liu, and Yu proposed a holistic lexicon-based approach that takes into account the context and syntactic structure of the text to improve sentiment classification accuracy.
Another approach involves training machine learning models, such as support vector machines (SVM), random forests, or recurrent neural networks (RNN), to classify news articles based on their sentiment. These models learn from labeled training data, where human experts manually label each article with its corresponding sentiment. The trained models can then classify new, unlabeled articles into sentiment categories.
Furthermore, researchers have explored using NLP techniques to extract key information from news articles, such as company names, financial figures, or event descriptions. This information can be used to identify specific news events that are likely to impact stock prices. Event-driven approaches analyze the effects of these news events on stock price movements, providing insights into the relationship between news and market dynamics [1, 2].
In this paper, the aim is to contribute to the growing body of research by examining the correlation between news and stock price movements based on stock market indices. We will leverage NLP techniques to classify news articles and analyze their impact on the corresponding movement of stock market indices. By exploring the potential of news classification as a tool for making better investment decisions, we hope to provide valuable insights for market participants and researchers alike.
2. Literature Review
The existing literature on the correlation between news and stock prices reveals a wealth of studies that have explored this relationship from different perspectives. To classify news for research, a common method is to use sentiment analysis techniques to classify news articles into positive, negative, or neutral sentiment categories based on the underlying tone of the text. This analysis aids in understanding the overall market sentiment and its potential influence on stock prices.
Bollen, Mao, and Zeng conducted a pioneering study using Twitter feeds to predict stock market movements [3]. By applying sentiment analysis techniques to tweets, they discovered a significant correlation between tweet sentiment and changes in the Dow Jones Industrial Average. This study highlighted the potential of NLP and sentiment analysis in leveraging social media data to gain insights into stock price trends. Similarly, Zhang, Fuehres, and Gloor utilized sentiment analysis of news articles and social media data to predict stock market trends [4]. They found that sentiment analysis of news articles can offer valuable information for predicting stock market movements. By incorporating machine learning algorithms and NLP techniques, they could identify sentiment trends that preceded changes in market conditions.
Similarly, Tetlock examined the relationship between news sentiment and stock price reactions using data from The Wall Street Journal [5]. The study found that positive news articles were associated with positive stock returns, while negative news articles were linked to negative stock returns. These expected results suggested that news sentiment can play a significant role in shaping market movements. Furthermore, the study highlighted that this relationship was particularly pronounced for smaller stocks, meaning that news sentiment might have a more substantial effect on less widely followed companies.
Beyond sentiment analysis, other studies have focused on the impact of specific types of news events on stock prices. For example, Easley, Hvidkjaer, and O’Hara explored the influence of company-specific news announcements on stock price volatility [6]. They found that news releases containing positive or negative information significantly affected subsequent stock price movements, increasing volatility. This research underscores the importance of analyzing company-specific news events for understanding stock price dynamics. Furthermore, Lamont and Thaler (2003) analyzed the effect of political news on stock market performance [7]. They found that political news has a significant impact on market returns and volatility, especially during election periods or major policy announcements. This research emphasizes the need to consider the broader economic and political context when examining the relationship between news and stock prices.
Researchers have also investigated the role of news events in causing stock market crashes or significant market downturns. Barun´ık and Kˇrehl´ık analyzed the relationship between news articles and stock market crashes using data from various financial news sources [8]. They identified a strong link between the occurrence of negative news events and subsequent market downturns, suggesting that news plays a pivotal role in shaping market crashes. Additionally, Dimpfl and Jank examined the impact of financial news on systemic risk. They found that news sentiment significantly influences systemic risk measures, indicating that news can be a crucial driver of market instability [9].
In terms of methodology, researchers have utilized a range of techniques to classify news articles and extract sentiment. Machine learning algorithms, such as support vector machines (SVM), neural networks, and natural language processing (NLP) techniques, have played a crucial role in news classification and sentiment analysis [10, 11]. These studies have significantly contributed to the research community by demonstrating the effectiveness of these techniques in automatically analyzing large volumes of textual data.
For example, Ding, Liu, and Yu proposed a holistic lexicon-based approach to opinion mining, which integrated the context and syntactic structure of text to improve sentiment classification accuracy [10]. Their work advanced the field by addressing the limitations of traditional lexicon-based methods and providing a more comprehensive approach to sentiment analysis.
Similarly, Cambria, Schuller, Xia, and Havasi explored new avenues in opinion mining and sentiment analysis by incorporating semantic analysis and cognitive modeling [11]. Their research expanded the scope of sentiment analysis techniques, enabling a deeper understanding of the nuanced sentiment expressed in news articles. This work has improved the accuracy and depth of sentiment analysis in the context of stock market news.
In addition to machine learning-based approaches, event-driven approaches have been employed to examine the impact of specific news events on stock prices [1]. Hogenboom et al. focused on identifying and analyzing news events using an event extraction framework [1]. Their contribution lies in developing a systematic approach to identify relevant news events and evaluate their impact on stock prices, providing a valuable methodology for event-driven analysis.
Da, Engelberg, and Gao investigated the attention-grabbing nature of news articles and its impact on stock market performance [2]. They found that stocks receiving more attention from news articles exhibited higher trading volumes and subsequent price reversals. This research shed light on the role of news attention in stock market dynamics and contributed to a better understanding of the relationship between news events and stock prices.
Overall, these studies have significantly advanced news classification and its application to stock market analysis. By leveraging machine learning algorithms and event-driven approaches, researchers have made substantial contributions to the research community by providing effective methodologies for analyzing news sentiment and identifying the impact of news events on stock prices.
In conclusion, the literature review demonstrates a growing body of research on understanding the correlation between news and stock price movements. Whether through sentiment analysis or analyzing specific news events, researchers have consistently identified a relationship between news and stock prices. Leveraging advancements in NLP techniques has provided researchers with powerful tools for extracting meaningful information from vast amounts of textual data. This paper aims to contribute to this body of knowledge by examining the correlation between news and stock price movements based on stock market indices and exploring the potential of news classification as a tool for making better investment decisions.
3. Data
In this research, the Reddit World News headlines were collected from the subreddit ”r/worldnews,” a prominent online community known for its active discussions on global news topics, in which several news articles were posted and discussed daily. The data collection process involved web crawling within the time range from June 8, 2008, to July 1, 2016 [12], yielding a total of 49725 news articles in total. The availability of a substantial volume of news articles allowed us to explore the correlation between news and stock market prices comprehensively.
To prepare the Reddit World News data for analysis, several preprocessing steps commonly employed in Natural Language Processing (NLP) tasks were performed. These steps included removing stop words, tokenizing the text, and applying stemming or lemmatization techniques. Stop words, such as common articles and pronouns, were removed to eliminate noise and focus on more meaningful words and phrases. Tokenization involves breaking down the text into individual words or tokens to facilitate further analysis. Additionally, stemming or lemmatization techniques were applied to reduce words to their root form, ensuring consistency in their representations.
From the original dataset containing 27 columns and 1990 rows, including 49725 samples, we specifically utilized the first column, which provided the date information for each set of news articles, and the second column, which contained the label on the stock market movements for each day. The remaining columns contained the top 25 headlines ranked by Reddit users’ votes for each date. These headline columns constituted the textual data that we analyzed in our research. By focusing on the headline text, we aimed to capture the essence of the news articles from which we would examine their potential impacts on stock market prices.
Regarding the labeling process, we assigned labels based on the changes observed in the DJIA Adj Close values. The choice of the DJIA as the stock market index for our analysis was based on several factors. The DJIA has a long-standing reputation as one of the oldest and most influential stock market indices globally. It encompasses 30 large publicly traded companies across diverse sectors, making it a representative and comprehensive indicator of the U.S. stock market. Furthermore, the DJIA serves as a widely recognized barometer of the overall health and direction of the stock market. Its inclusion of prominent companies from various industries ensures the consideration of diverse factors that can influence stock prices.
In terms of the DJIA dataset, it spans from June 8, 2008, to July 1, 2016 [12], aligning with the time range of the Reddit World News data. This dataset consists of 1989 distinct entries, reflecting the daily variations in the DJIA Adj Close values. The size of the dataset provides a robust foundation for analyzing the relationship between news and stock prices over an extended period.
In the labeling, specifically, we determined whether the DJIA Adj Close increased or decreased compared to the previous day. To define these labels, we employed a threshold or percentage change criteria. For instance, if the DJIA Adj Close value increased or remained the same as the previous day, we assigned a label of ”1” to indicate a positive or neutral trend. Conversely, if the DJIA Adj Close value decreased, we assigned a label of ”0” to indicate a negative trend. This labeling approach enabled us to frame the research problem as a binary classification task, aiming to predict the direction of stock market prices based on associated news.
The research problem involves investigating whether an increase or decrease in stock market prices can be predicted using textual news data, aiming to establish a correlation between news and stock prices. In the subsequent sections of this paper, we will introduce various models and methodologies to explore this relationship in detail. By leveraging NLP techniques and the stock market data, we will employ a comprehensive approach to address the research problem, leading to a deeper understanding of the impact of news on stock market prices.
4. Methodology
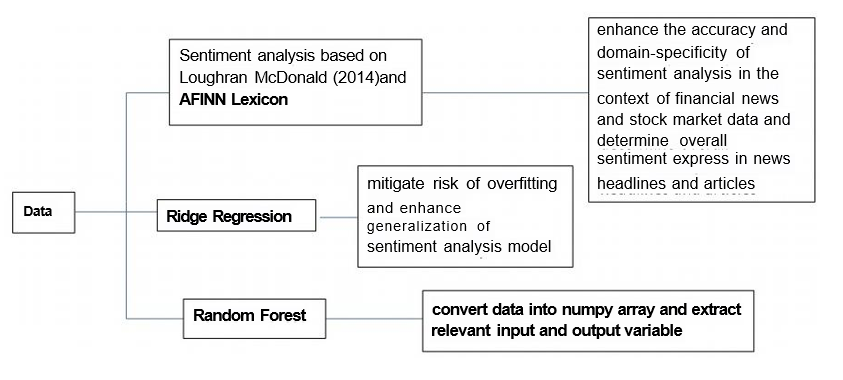
Figure 1: Illustration of the methodology.
In this research paper, the aim is to investigate the impact of financial news sentiment on stock market prices using three distinct methodologies: Sentiment analysis based on Loughran-McDonald (2014) and AFINN Lexicon, Ridge regression, and Random Forest. These three approaches provide diverse perspectives to analyze the relationship between news sentiment and stock market trends. Figure 1 shows the whole process we take in this research.
First of all, the Loughran-McDonald (2014) Financial Sentiment Word Lists (Extended) has been used, an extended version of the Loughran-McDonald lexicon specifically designed for financial sentiment analysis [13]. Incorporating this lexicon is essential to enhance the accuracy and domain-specificity of sentiment analysis in the context of financial news and stock market data. Using a lexicon tailored to the financial domain, we can capture sentiment nuances and expressions unique to the financial industry, which may not be adequately represented in general sentiment lexicons. This allows us to gain deeper insights into the impact of financial news on stock prices and make more informed decisions in our analysis. The Loughran-McDonald Financial Sentiment Word Lists (Extended) have been widely recognized and used in academic research and industry applications, ensuring the reliability and credibility of sentiment analysis results in our paper. Furthermore, in our paper, the utilization of the AFINN sentiment lexicon is paramount to achieving accurate and comprehensive sentiment analysis [14]. The AFINN lexicon provides sentiment scores for words, ranging from -5 (indicating negative sentiment) to +5(representing positive sentiment). By incorporating this widely used sentiment lexicon, the overall sentiment expressed in news headlines and articles related to the stock market can be efficiently determined. AFINN's established reputation and wide adoption in sentiment analysis research ensure the credibility and reliability of our sentiment analysis results. The lexicon's predefined sentiment scores offer a standardized and consistent approach to sentiment classification, allowing us to objectively evaluate the impact of news on stock prices.
With the AFINN lexicon, valuable insights into market sentiment can be uncovered, which enables us to make more informed decisions and draw meaningful conclusions in our research on the correlation between news and stock prices based on stock market indices. Secondly, in addition to the Loughran-McDonald Financial Sentiment Word Lists (Extended) and AFINN Lexicon methodologies, we also incorporate Ridge Regression as another powerful approach in our analysis. With the Ridge Regression method, we apply a regularization technique to mitigate the risk of overfitting and enhance the generalization of the sentiment analysis model. Like the other methods, we preprocess the textual data, ensuring its suitability for the Ridge Regression algorithm. By employing Ridge Regression, we aim to balance incorporating sentiment lexicons and controlling model complexity. The regularization parameter in Ridge Regression lets us fine-tune the model’s sensitivity to different sentiment features, ensuring a more robust and accurate analysis. The Ridge Regression approach complements the other methodologies, providing an additional perspective to investigate the relationship between financial news sentiment and stock market prices. The results from Ridge Regression, along with the findings from Random Forest and the lexicon-based approaches, contribute to a comprehensive and multifaceted understanding of the impact of financial news on stock market trends.
Thirdly, we employ the Random Forest classifier to investigate the correlation between news sentiment and stock market trends. To prepare the data for analysis, we converted it into a numpy array and extracted the relevant input and output variables. Next, the work applies several data preprocessing steps, including handling NaN values, removing leading ’b’ characters, and stripping quotes from sentences. Then, it constructs a frequency dictionary for the most common words in the news articles. To limit the vocabulary size and optimize processing efficiency, it crops the dictionary to include only the top 100 words for each article. Additionally, we map the words to integer values to convert the text data into numerical format suitable for the Random Forest model. To evaluate the model’s performance, the work split the data into training and testing sets using the ”train test split function” from scikit-learn. After training the Random Forest classifier on the training set, the algorithm makes predictions on the testing set and calculates various performance metrics. These metrics include accuracy, precision, recall, and F1-score, which offer insights into the model’s ability to predict positive and negative stock market trends based on news sentiment.
By applying these three methodologies to the same dataset, the work can comprehensively analyze the performance and effectiveness of each method in predicting stock market trends based on news sentiment. The results of our analysis will be presented through metrics such as accuracy, precision, recall, and F1-score, providing a holistic view of the relationship between financial news sentiment and stock market movements. Additionally, examining the feature importance in the Random Forest model will offer insights into which sentiment lexicon contributes most significantly to the predictions. The combination of these diverse methodologies will furnish a robust foundation for understanding the implications of financial news sentiment on stock market prices and assist investors, analysts, and researchers in making well-informed decisions.
5. Results
The research analysis employed three different methods for sentiment analysis: Loughran- McDonald Financial Sentiment Word Lists (Extended), AFINN Lexicon, and Ridge regression, along with the Random Forest classifier. Each method was evaluated based on accuracy, precision, recall, and F1-score, providing valuable insights into the relationship between financial news sentiment and stock market trends(see Table 1).
Table 1: Comparison of three different methods.
Loughran-McDonald List and AFINN lexicon | Label | Precision | Recall | F1-score | Support | ||
Accuracy: 0.53 | 0 | 0.44 | 0.39 | 0.41 | 171 | ||
1 | 0.58 | 0.63 | 0.61 | 227 | |||
Ridge regression | 0 | 0.41 | 0.51 | 0.46 | 171 | ||
Accuracy: 0.48 | 1 | 0.55 | 0.45 | 0.50 | 227 | ||
Random forest | 0 | 0.43 | 0.31 | 0.37 | 171 | ||
Accuracy: 0.56 | 1 | 0.59 | 0.71 | 0.65 | 227 | ||
First, utilizing Loughran-McDonald's (2014) Financial Sentiment Word Lists (Extended) and AFINN Lexicon, the sentiment analysis achieved an overall accuracy of 0.53. The Classification Report shows a precision of 0.44 and 0.58 for classes 0 and 1, respectively, indicating that the model better predicted positive stock market trends (class 1). However, the recall for class 0 is 0.39, suggesting that the model struggles to capture negative trends effectively. This is further highlighted by the F1-score of 0.41 for class 0, which reflects the balanced performance between precision and recall, indicating room for improvement. On the other hand, the F1-score of 0.61 for class 1 demonstrates a relatively better balance between precision and recall, implying a more robust performance in predicting positive trends.1
Secondly, when applying the Ridge regression method, the accuracy achieved was 0.48. The Classification Report reveals a precision of 0.41 for class 0 and 0.55 for class 1. The recall is 0.51 and 0.45 for classes 0 and 1, respectively. The F1 scores are 0.46 for class 0 and 0.50 for class 1. These metrics indicate that Ridge regression also faces challenges in effectively capturing negative trends (class 0), as evidenced by relatively lower precision and recall scores than class 1. Although the model performs better in predicting positive trends, there is still room for improvement in overall performance. The precision-recall curve for the Ridge regression model reveals some important insights into the model's trade-off between precision and recall. When the recall is low (close to 0), the model tends to be overly cautious and predicts almost all instances as negative (class 0). This results in high precision but low recall, as the model misses many true positive predictions.
As the recall increases, the model becomes more liberal in predicting positive instances, leading to higher recall but a decrease in precision due to the increased number of false positives. This indicates that the model is becoming more sensitive in detecting positive instances but at the cost of making more false positive predictions. Beyond a certain threshold of recall (around 0.48 in this case), the model seems to find a better balance between precision and recall, leading to a slight increase in precision. At this point, the model is making more accurate positive predictions while still maintaining a reasonable number of false positives. Overall, the precision-recall curve provides valuable insights into the performance of the Ridge(see Figure 2).
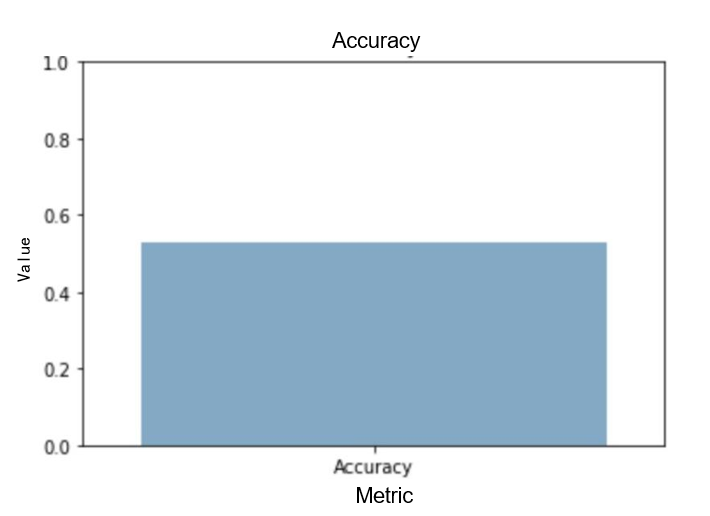
Figure 2: Visualization for accuracy of sentiment analysis based on Loughran-McDonald and AFINN Lexicon.
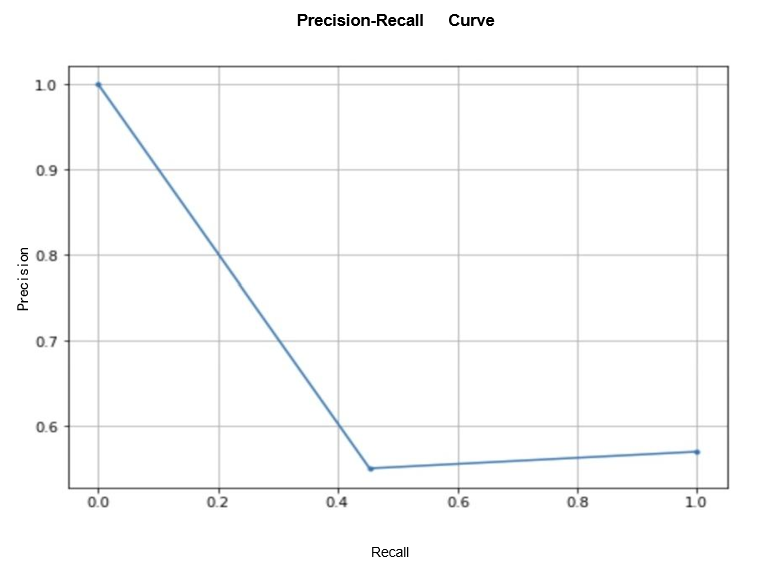
Figure 3: Precision-recall curve for Ridge regression.
Regression model and helps in understanding the trade-offs between precision and recall. It highlights the importance of optimizing the model for the specific requirements of the application, depending on whether higher precision or higher recall is more critical in making accurate predictions. Figure 3 is the visualization for a precision-recall curve of Ridge regression.
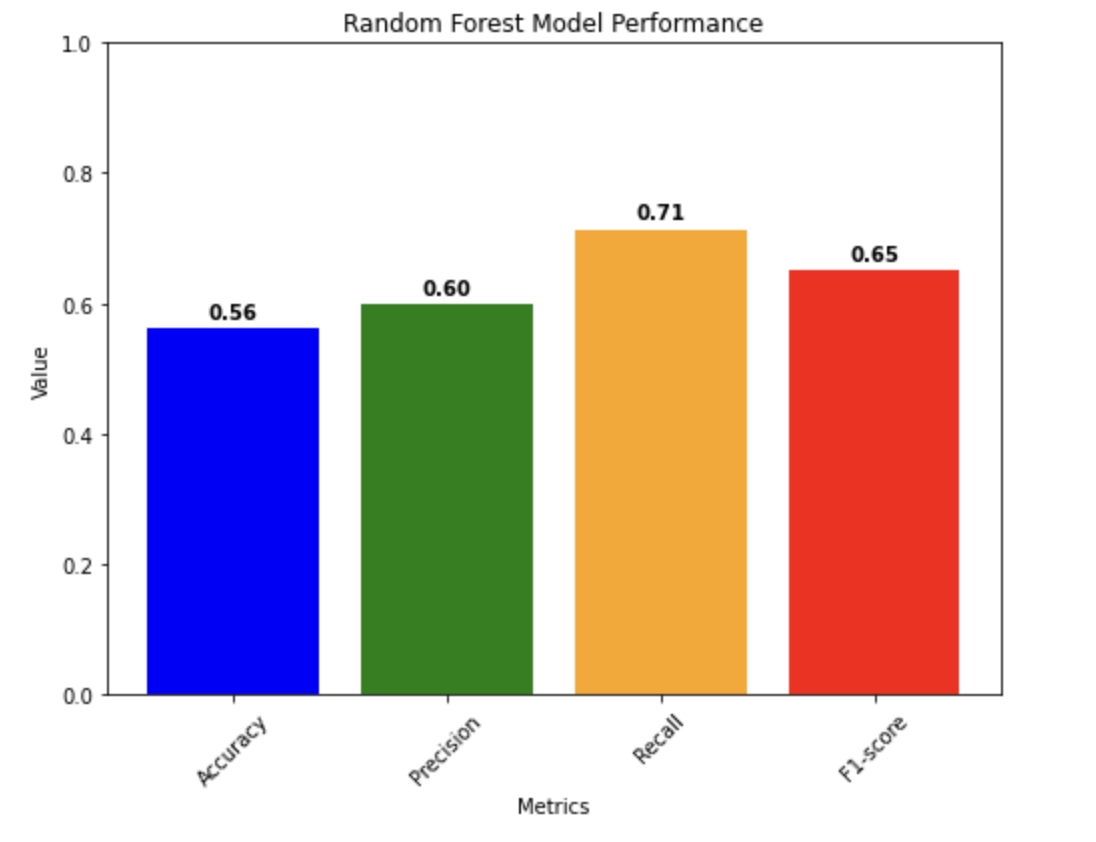
Figure 4: Visualization for Random Forest.
Lastly, the random forest model achieved an accuracy of approximately 0.5628, indicating that it correctly classified the news sentiment as either positive or negative for about 0.5628 of the data points in the test set. The precision of 0.5978 suggests that when the model predicts a positive trend in the stock market, it is correct about 0.5978 of the time. The recall of 0.7137 indicates that the model can identify around 0.7137 of the actual positive trends in the stock market. The F1-score, which combines both precision and recall, is 0.6506. The F1 score is useful to find a balance between precision and recall. It takes into account false positives and false negatives, making it a good overall measure of the model’s performance. The confusion matrix can further help in understanding the model’s behavior, which shows that the model correctly predicted 144 instances of positive trends (true positives) and 66 instances of negative trends (true negatives). However, it misclassified 105 instances of negative trends as positive (false positives) and 83 instances of positive trends as negative (false negatives). Figure 4 is the visualization for the random forest model performance.
In conclusion, the results of our sentiment analysis using Loughran-McDonald (2014) Financial Sentiment Word Lists (Extended), AFINN Lexicon, Ridge regression, and Random Forest indicate that predicting negative trends in the stock market remains challenging across all methods. To improve the F1-score and overall performance, potential avenues for investigation include fine-tuning model hyperparameters, exploring alternative text preprocessing techniques, incorporating more domain-specific lexicons, and exploring other machine learning algorithms tailored to handle imbalanced datasets. Additionally, feature engineering and incorporating contextual information could further enhance the sentiment analysis performance. In conclusion, this research showcases the importance of sentiment analysis in understanding the impact of financial news on the stock market. It paves the way for future advancements in sentiment analysis methodologies to improve prediction accuracy and drive more informed decision-making in the financial domain.
6. Discussion
The results of our news sentiment analysis using different methodologies provide valuable insights into the relationship between financial news sentiment and stock market trends. Overall, our findings demonstrate that predicting negative trends in the stock market remains a challenge across all methods. On the other hand, the models perform relatively better in predicting positive trends, indicating that positive news sentiments have a more significant impact on stock prices.
The Random Forest model achieved the highest accuracy among the three methods, indicating that it effectively classifies news sentiment into positive or negative categories. The precision and recall scores for positive trends are relatively high, suggesting that the model can identify positive trends in the stock market with good accuracy. However, the model struggles with predicting negative trends, as evident from the higher number of false positives and negatives.
Despite the performance differences among the methods, it is crucial to consider their strengths and limitations. For instance, the Loughran-McDonald (2014) Financial Sentiment Word Lists (Extended) and AFINN Lexicon approaches also provide valuable insights into the impact of financial news sentiment on stock prices. While their overall accuracy is lower than that of the Random Forest model, they offer domain-specific perspectives that can uncover nuanced sentiment expressions unique to the financial industry. The Loughran-McDonald (2014) Financial Sentiment Word Lists (Extended) approach allows us to capture sentiment specific to financial news, while the AFINN Lexicon offers a standardized approach to sentiment classification.
Fine-tuning model hyperparameters, exploring alternative text preprocessing techniques, and incorporating more domain-specific lexicons could potentially improve the performance of the sentiment analysis models. Furthermore, incorporating contextual information and feature engineering may provide valuable insights into the impact of specific news events on stock prices. It is also essential to recognize that stock market movements are influenced by various factors beyond news sentiment. Economic indicators, geopolitical events, and global trends all play a role in shaping stock prices. Therefore, while news sentiment analysis can provide valuable insights, it should be used as one of many tools for making investment decisions.
7. Conclusion
In conclusion, this research contributes to the growing knowledge of the correlation between news sentiment and stock market movements. By leveraging NLP techniques and exploring different methodologies, we shed light on the potential impact of financial news on the stock market. As sentiment analysis methodologies continue to evolve and improve, they hold promise in assisting investors, analysts, and researchers to make more informed decisions in the financial domain. However, it is essential to continually refine and expand these approaches to capture the complexities of the stock market and enhance their predictive power.
Moving forward, there are various potential next steps that can further enhance and extend this study. Firstly, incorporating more sophisticated sentiment analysis techniques, such as deep learning-based models, could improve the accuracy and granularity of sentiment classification. These models can capture intricate linguistic patterns and contextual cues, which is particularly beneficial when dealing with financial jargon and market-specific expressions. Secondly, an expansion of the dataset to include news articles from different periods, and an incorporation of real-time data could provide a more dynamic understanding of how news sentiment influences stock market movements over various market conditions and economic landscapes.
Furthermore, exploring additional feature engineering techniques and sentiment lexicons specifically tailored to financial domains may contribute to more comprehensive sentiment analysis and improve the performance of the predictive models.
Additionally, conducting a comparative study of machine learning algorithms beyond Ridge regression and Random Forest, such as support vector machines or gradient boosting, can offer insights into which models are the most effective in predicting stock market trends based on news sentiment. Moreover, investigations of the impact of sentiments from different news sources, such as financial news outlets, social media platforms, and expert opinions, could reveal unique perspectives on market sentiment and further enrich the understanding of market dynamics. Lastly, considering the influences of different external factors in conjunction with news sentiment, such as economic indicators, geopolitical events, and global market trends, could provide a more holistic view of the multifaceted factors driving stock market behavior.
References
[1]. Hogenboom, F., de Winter, M., Frasincar, F., and Kaymak, U. (2015). A news event-driven approach for the historical value at risk method. Expert Systems with Applications, 42(10), 4667-4675.
[2]. Da, Z., Engelberg, J., and Gao, P. (2011). In search of attention. The journal of finance, 66(5), 1461-1499.
[3]. Bollen, J., Mao, H., and Zeng, X. (2011). Twitter's mood predicts the stock market. Journal of Computational Science, 2(1), 1-8.
[4]. Zhang, X., Fuehres, H., and Gloor, P. (2011). Predicting stock market indicators through Twitter: A feasibility study. Decision Support Systems, 52(1), 828-834.
[5]. Tetlock, P. C. (2007). Giving content to investor sentiment: The role of media in the stock market. The Journal of Finance, 62(3), 1139-1168.
[6]. Easley, D., Hvidkjaer, S., and O’Hara, M. (2002). Is information risk a determinant of asset returns? Journal of Finance, 57(5), 2185-2221.
[7]. Lamont, O., and Thaler, R. H. (2003). Can the market add and subtract? Mispricing in tech stock carve-outs. Journal of Political Economy, 111(2), 227-268.
[8]. Barun´ık, J., and Kˇrehl´ık, T. (2018). Measuring the frequency dynamics of financial connectedness and systemic risk. Journal of Financial Econometrics, 16(2), 271-296.
[9]. Dimpfl, T., and Jank, S. (2016). Can internet search queries help to predict stock market volatility? European Financial Management, 22(2), 171-192.
[10]. Ding, X., Liu, B., and Yu, P. S. (2008). A holistic lexicon-based approach to opinion mining. In Proceedings of the 2008 international conference on web search and data mining (pp. 231-240).
[11]. Cambria, E., Schuller, B., Xia, Y., and Havasi, C. (2013). New avenues in opinion mining and sentiment analysis. IEEE Intelligent Systems, 28(2), 15-21.
[12]. Sun, J. (2016). Daily News for Stock Market Prediction, Version 1. https://www.kaggle.com/aaron7sun/stocknews.
[13]. Loughran, T., and McDonald, B. (2014). Measuring readability in financial disclosures. Journal of Finance, 69(4), 1643-1671.
[14]. Nielsen, F. A(˚). (2011). A new ANEW: Evaluation of a word list for sentiment analysis in microblogs. Proceedings of the International Conference on Weblogs and Social Media (ICWSM).
Cite this article
Jin,Z.;Ma,M.;Zhou,Z.;Gan,S.;Min,Y. (2024). Correlation Between News and Stock Price Based on Stock Market Indices: Can News Classification Be Used as a Tool to Make Better Decisions?. Advances in Economics, Management and Political Sciences,82,131-141.
Data availability
The datasets used and/or analyzed during the current study will be available from the authors upon reasonable request.
Disclaimer/Publisher's Note
The statements, opinions and data contained in all publications are solely those of the individual author(s) and contributor(s) and not of EWA Publishing and/or the editor(s). EWA Publishing and/or the editor(s) disclaim responsibility for any injury to people or property resulting from any ideas, methods, instructions or products referred to in the content.
About volume
Volume title: Proceedings of the 2nd International Conference on Financial Technology and Business Analysis
© 2024 by the author(s). Licensee EWA Publishing, Oxford, UK. This article is an open access article distributed under the terms and
conditions of the Creative Commons Attribution (CC BY) license. Authors who
publish this series agree to the following terms:
1. Authors retain copyright and grant the series right of first publication with the work simultaneously licensed under a Creative Commons
Attribution License that allows others to share the work with an acknowledgment of the work's authorship and initial publication in this
series.
2. Authors are able to enter into separate, additional contractual arrangements for the non-exclusive distribution of the series's published
version of the work (e.g., post it to an institutional repository or publish it in a book), with an acknowledgment of its initial
publication in this series.
3. Authors are permitted and encouraged to post their work online (e.g., in institutional repositories or on their website) prior to and
during the submission process, as it can lead to productive exchanges, as well as earlier and greater citation of published work (See
Open access policy for details).
References
[1]. Hogenboom, F., de Winter, M., Frasincar, F., and Kaymak, U. (2015). A news event-driven approach for the historical value at risk method. Expert Systems with Applications, 42(10), 4667-4675.
[2]. Da, Z., Engelberg, J., and Gao, P. (2011). In search of attention. The journal of finance, 66(5), 1461-1499.
[3]. Bollen, J., Mao, H., and Zeng, X. (2011). Twitter's mood predicts the stock market. Journal of Computational Science, 2(1), 1-8.
[4]. Zhang, X., Fuehres, H., and Gloor, P. (2011). Predicting stock market indicators through Twitter: A feasibility study. Decision Support Systems, 52(1), 828-834.
[5]. Tetlock, P. C. (2007). Giving content to investor sentiment: The role of media in the stock market. The Journal of Finance, 62(3), 1139-1168.
[6]. Easley, D., Hvidkjaer, S., and O’Hara, M. (2002). Is information risk a determinant of asset returns? Journal of Finance, 57(5), 2185-2221.
[7]. Lamont, O., and Thaler, R. H. (2003). Can the market add and subtract? Mispricing in tech stock carve-outs. Journal of Political Economy, 111(2), 227-268.
[8]. Barun´ık, J., and Kˇrehl´ık, T. (2018). Measuring the frequency dynamics of financial connectedness and systemic risk. Journal of Financial Econometrics, 16(2), 271-296.
[9]. Dimpfl, T., and Jank, S. (2016). Can internet search queries help to predict stock market volatility? European Financial Management, 22(2), 171-192.
[10]. Ding, X., Liu, B., and Yu, P. S. (2008). A holistic lexicon-based approach to opinion mining. In Proceedings of the 2008 international conference on web search and data mining (pp. 231-240).
[11]. Cambria, E., Schuller, B., Xia, Y., and Havasi, C. (2013). New avenues in opinion mining and sentiment analysis. IEEE Intelligent Systems, 28(2), 15-21.
[12]. Sun, J. (2016). Daily News for Stock Market Prediction, Version 1. https://www.kaggle.com/aaron7sun/stocknews.
[13]. Loughran, T., and McDonald, B. (2014). Measuring readability in financial disclosures. Journal of Finance, 69(4), 1643-1671.
[14]. Nielsen, F. A(˚). (2011). A new ANEW: Evaluation of a word list for sentiment analysis in microblogs. Proceedings of the International Conference on Weblogs and Social Media (ICWSM).