


1.Introduction
The realty sector stands as the mainstay of China's economy, while the stock exchange serves as an indicator of economic progress. The interplay and impact of these two markets on economic advancement have long been a focal point for both academia and industry. At the same time, the currency market is a direct and important means for China 's financial sector to regulate the impact of the stock market and the property market.
During 2001, the network bubble burst, and the U.S. economy began to decline. In order to stimulate the economy, the Federal Reserve adopted a very loose monetary policy. After 13 times of reduction of interest, by June 2003, the Federal Reserve greatly reduced federal funds rate to 1%. This low-interest rate policy generated a sharp increase in American housing prices, and the price bubble loomed. However, by July 2007, the U.S. subprime mortgage crisis burst out suddenly, the real estate bubble burst, and the world fell into the most severe financial crisis since the Great Depression in the 1930s. With the decline of global economic growth, research on the relationship between asset prices and monetary policy has become a hot topic at home and abroad. Some foreign central banks have also begun to pay more attention to the impact of large fluctuations in asset prices on economic growth during a ' specific period '. In this sudden subprime mortgage crisis, the surge in real estate prices and its price ' bubble ' undoubtedly had a profound impact on monetary policy.
Firstly, considering the volatility correlation between financial market and the property market, a nonlinear causality experiment is applied to find that the US stock market displays a significant one-way influence on the real estate market[1]. A short-term one-way impact on the property market is found in the Greek stock market, along with a long-term two-way impact[2]. Indeed, a correlation between the volatility of property and stock markets has been identified in both the United States and Europe, but not the correlation between returns[3]. Research has revealed a long-run bilateral causal relationship between the US property market and the stock market, and has a stronger return and volatility transmission effect[4]. Scholars have highlighted that the real estate market exerts a significant one-way volatility spillover effect on the overall equity market[5]. The two-way spillover effect of China 's property market and equity market has been investigated using the VAR-GARCH-BEKK model and the rolling window method. The findings of the study concluded that there were indeed two-way mean and volatility spillover effects between the property market and the stock market as a whole, while there were only single spillover effects before 2008[6].
The second is about the monetary market and the stock market : The impact of GDP, fiscal expenditure and currency supply on the stock market during same period is negative, but it does not pass the significance test ; the influence of currency inflation and interest rate on the stock market in the same period is positive, although it is not significant[7]. The SVAR method was applied to fin out how the monetary stance would possibly affect the performance of the stock market, and proposed that China's stock market showed obvious “ policy market ” characteristics, that is, the tise in the currency growth rate will lead to a rise in stock prices, and the cumulative impact is persistent[8].
Finally, with regard to the monetary market and the property market, since the enactment of the housing system reform in late 1990s, the property market has gradually matured, and the property market investment has become an essential drive for the development of China's real economy. However, the overheating of the property market and the abnormal expansion of property prices are problems that have not been solved in the past 10 years. Since 2003, China’s central bank has sequentially carried out three regulations on the property market, but the effect is not ideal. Especially in 2007, property prices rose by nearly 6 percentage points in a year, even though the central bank implemented an ultra-tight monetary policy of frequently raising the deposit reserve ratio and raising the deposit and loan interest rates. This shows that China 's central bank 's monetary policy on the property price regulation effect is not ideal and did not achieve the desired regulatory objectives.
The following lists some of the central bank 's regulatory measures for the property industry :
2003 : In 2003, the Chinese government announced to strengthen the regulation of the property market, taking a series of measures, including putting up the deposit reserve ratio, increasing the supervision of property development loans, aiming to restrict surge in housing prices.
2010 : After the 2008 financial crisis, the Chinese government implemented an array of economic stimulus policies, including a large-scale credit expansion. Nevertheless, as the currency flows to the property market, the central bank has taken a series of measures, including putting up the deposit reserve ratio, reinforcing the supervision on second-home loans, limiting the purchase qualification, etc., to constrain extreme speculation behaviors.
2011: The central bank continued to strengthen its regulation of the property market and introduced new monetary and lending policies to curb rising house prices and excessive speculation. This period also involves the introduction of differentiated housing purchase policies in some cities, such as purchase limitations, loan constrains, etc.
2014 : In 2014, the central bank continued to tighten the credit environment in the property market by raising interest rates, reducing loan quotas, and strengthening supervision to curb excessive house price increases.
2016 : In response to the surging house prices in main cities, the People 's Bank of China continued to increase its regulation and control, and adopted discrepant real estate policies, including increasing the proportion of down payment and restricting the qualification of house purchase.
2017 : The Chinese government continues to strengthen the regulation and control of the property market and prevent real estate bubbles and financial risks through various means. This period includes a series of policies, such as rising mortgage rates, differentiated housing purchase policies, and enhancing supervision of real estate developers' financing.
Different from the previous passages, this paper refers to the analysis method and article structure of a previous study by Zhou[9], comprehensively considers the volatility spillover effect and correlation between the three markets, and uses the diagonal BEKK model to analyze, that is, considering the correlation between the two markets, while considering the impact of another market on it.
2.Analysis of Economic Principles
First of all, on the volatility transmission relationship between monetary policy and the stock market : ① The change of monetary policy will affect the yield of securities investments, thus changing the existing value of stocks ; ② The fluctuation of the value of securities investment assets will affect the returns of investors. Investors will increase or decrease the number of investment assets they hold in a timely manner, thus affecting the enthusiasm for stock market investment. Monetary policy will affect the price fluctuation of the securities market through intermediate media, such as currency supply, and will also cause fluctuations in the securities market by affecting stock returns.
Secondly, on the transmission relationship between monetary policy and the property market volatility : ① Monetary policy affects the overall interest rate level by adjusting the benchmark interest rate. Under the tight monetary policy carried out by central bank, increasing the benchmark interest rate will lead to an increase in the cost of loans, which will raise the cost of purchasing houses, thus slowing down the demand for purchasing houses and inhibiting the rise of property prices. ② By regulating the deposit reserve ratio, loan interest rate and credit rationing, the central bank directly affects its credit issuance. Through screwing credit policy, the central bank can decrease the borrowing capacity of property developers and buyers, thus restricting the financing activities of the property market and playing a certain role in curbing the excessive rise in prices. ③Changes in monetary policy will cause fluctuations in market expectations, and market expectations themselves can affect the behavior of investors and homebuyers. For example, if the market is generally expected a tight policy, buyers may be more cautious, and investors may reduce their investment in the property market, leading to a decline in property prices.
Finally, on the property market and the stock market volatility conduction relationship : ① The rise and fall of the property market will directly affect the wealth level of individuals and families. When property prices rise, residents may feel richer, boosting their confidence and spending levels. This wealth effect may lead to increased consumption, further contributing to economic growth. The stock market is mostly sensitive to economic growth, so the rise in property prices may indirectly drive the stock index to rise. ② The stock index usually includes a number of property-related companies, such as house builder, construction companies, property investment trusts and so on. Therefore, the fluctuation of the property market directly affects the performance of these companies, thus transmitting to the entire stock index. ③ Investors in the property market and the stock market are affected by similar psychological factors. When the property market is booming, investor sentiment may be more optimistic, and vice versa. This kind of sentiment fluctuation may be transmitted to the stock market and affect the trend of the stock index. ④ The performance of a stock index is usually closely related to economic activity and corporate performance. When the stock market is strong, this may reflect economic prosperity and an increase in corporate profits. This economic growth may lead to more investment and demand, some of which may flow to the property market to support house prices. ⑤ Investors usually allocate assets according to the performance of different asset classes. If the stock market performs well, investors may be inclined to increase the weight of stocks in their portfolios. This change in asset allocation may affect the property market, as investors ' capital flows may be affected.
According to the economic principles analyzed above, this paper proposes that the three markets are highly interrelated, but there is no significant direct relationship between the two, and there may be a nonlinear relationship between the impact of volatility.
3.Empirical Test
3.1.Model Setting
3.1.1.Volatile correlation model
In the real economy, there are often mutual influences between various markets. So as to diversify the risk of asset price fluctuations, hedge uncertainties, and ameliorate macroeconomic regulation and control functions, establishing corresponding combinations between multiple markets or assets is required. The multivariate GARCH model is a appropriate measure of volatility correlation. There are several different multivariate GARCH models in the existing literature, mainly including : VECH model, but the parameters of VECH model are of a large number, and it is difficult to estimate in the case of too many research objects. Therefore, a conditional variance-covariance matrix of a constrained VECH model was developed, called the diagonal VECH model[10]. However, the diagonal VECH model may not be able to describe the volatility comprehensively enough to quantify the correlation and volatility spillover effects between multiple markets. The BEKK model addressed the issue of ensuring a positive definite H matrix, which was a problem with the VECH model based on previous research[11][12]. The model allows the conditional variance process of multiple variables to interact with each other; that is, it provides a basis for the joint fluctuation interpretation between different variables. However, when multiple asset variables are involved, the “dimension disaster” still exists. Therefore, this paper will analysis the volatility effect of property prices and economic growth and establish a ternary diagonal BEKK model through currency supply, property sales price index, and stock market index. The model is :
\( {ε_{t}}= H_{t}^{\frac{1}{2}}{ζ_{t}} , {ζ_{t}}~i.i.d N(0,1)\ \ \ (1) \)
\( {H_{t}}={W^{ \prime }}W+\sum _{k=1}^{n}{A^{ \prime {ε_{t-k}}{{ε^{ \prime }}_{t-k}}}}A+\sum _{k=1}^{n}{B^{ \prime }}{H_{t-k}}B \ \ \ (2) \)
W is a lower triangular matrix, A and B are N×N parameter matrices and diagonal matrices. Metrix A reflects the ARCH effect of fluctuation. Matrix B reflects the continuity of volatility transmission, that is, the GARCH effect of volatility. The advantages of this model are listed as follows : ① The model setting significantly reduces the quantity of parameters to be estimated in the model, which is helpful to the introduction of three or more assets for analysis ; ② The variance-covariance matrix Ht is invariably positive definite, which ensures the consistency of a particular sequence. ③ It can solve the problem that the parameters of BEKK model are not clear enough. Although this model cannot directly consider the volatility spillover effect of one or more markets on another market at the same time, because it is a simultaneous solution equation, in fact, when reflecting the volatility correlation between two markets, it has indirectly considered the impact of other markets, and it is easier to examine the volatility correlation between two assets. In this paper, through the comprehensive judgment of AIC, SC and HQC criteria, the optimal lag order is determined to be 1 period, and most of the empirical results using GARCH-type models show that the first-order lag model can have a very good configuration for the time series. Therefore, this paper will choose the three-variable diagonal BEKK(1,1,1) model, which is shown as matrix-vector function as followed :
\( \begin{array}{c} [\begin{matrix}{h_{{11_{t}}}} & {h_{{12_{t}}}} & {h_{{13_{t}}}} \\ {h_{{21_{t}}}} & {h_{{22_{t}}}} & {h_{{23_{t}}}} \\ {h_{{31_{t}}}} & {h_{{32_{t}}}} & {h_{{33_{t}}}} \\ \end{matrix}]= {[\begin{matrix}{w_{1}} & 0 & 0 \\ {w_{2}} & {w_{4}} & 0 \\ {w_{3}} & {w_{5}} & {w_{6}} \\ \end{matrix}]^{T}}[\begin{matrix}{w_{1}} & 0 & 0 \\ {w_{2}} & {w_{4}} & 0 \\ {w_{3}} & {w_{5}} & {w_{6}} \\ \end{matrix}]+ {[\begin{matrix}{a_{1}} & 0 & 0 \\ 0 & {a_{2}} & 0 \\ 0 & 0 & {a_{3}} \\ \end{matrix}]^{T}} \\ [\begin{matrix}ε_{1 t-1}^{2} & {ε_{1 t-1}}{ε_{2 t-1}} & {ε_{1 t-1}}{ε_{3 t-1}} \\ {ε_{2 t-1}}{ε_{1 t-1}} & ε_{2 t-1}^{2} & {ε_{2 t-1}}{ε_{3 t-1}} \\ {ε_{3 t-1}}{ε_{1 t-1}} & {ε_{3 t-1}}{ε_{2 t-1}} & ε_{3 t-1}^{2} \\ \end{matrix}][\begin{matrix}{a_{1}} & 0 & 0 \\ 0 & {a_{2}} & 0 \\ 0 & 0 & {a_{3}} \\ \end{matrix}]+ {[\begin{matrix}{b_{1}} & 0 & 0 \\ 0 & {b_{2}} & 0 \\ 0 & 0 & {b_{3}} \\ \end{matrix}]^{T}} \\ [\begin{matrix}{h_{{11_{t-1}}}} & {h_{{12_{t-1}}}} & {h_{{13_{t-1}}}} \\ {h_{{21_{t-1}}}} & {h_{{22_{t-1}}}} & {h_{{23_{t-1}}}} \\ {h_{{31_{t-1}}}} & {h_{{32_{t-1}}}} & {h_{{33_{t-1}}}} \\ \end{matrix}][\begin{matrix}{b_{1}} & 0 & 0 \\ 0 & {b_{2}} & 0 \\ 0 & 0 & {b_{3}} \\ \end{matrix}] \ \ \ (3) \end{array} \)
where hiit represents the conditional variance of a variable, and hijt represents the conditional covariance between two assets. aiaj represents the impact of the ARCH effect of the interaction between the two variables on the future co-movement relationship, and bibj represents the impact of the volatility persistence of the two variables on the volatility of the two variables in the future, where i, j = 1,2,3. The subscript 1 represents the growth rate of currency supply, 2 represents the growth rate of the property sales price index, and 3 represents the growth rate of a stock market index.
If there is no volatility spillover effect on the correlation between currency supply, property value, then the parameters a1a2, a1a3, a2a3, b1b2, b1b3 and b2b3 are not statistically significantly different from zero. Under the assumption of normality, the parameters of the diagonal BEKK model can be obtained by maximizing the function as followed:
\( l(θ)= -\frac{TN}{2}{log_{2}}{π}-\frac{1}{2}\sum _{t=1}^{T}(log{|{H_{t}}|+{{ε^{ \prime }}_{t}}H_{t}^{-1}{ε_{t}}}) \ \ \ (4) \)
In this formula, θ represents all unknown parameters to be estimated, N is the number of assets, T is the number of observations. The maximum likelihood estimation of θ is assumed to be asymptotically normal, so the traditional process of statistical inference can be applied.
3.1.2.Growth Rate Model
In order to investigate the influence of the fluctuation of property price and the joint fluctuation of property price and currency supply on the speed of the stock index, this paper establishes the GARCH conditional mean model of the Shanghai stock index changing with time. Then, the conditional variance and conditional covariance inferred from the previous volatility correlation study are included to the mean model to consider whether the coefficients are significant. The model is as follows :
\( {y_{3t}}=α+\sum _{1}^{i}{β_{i}}{y_{3t-i}}+\sum _{1}^{i}{γ_{i}}{u_{3t-i}}+δ{h_{22}}+ξ{h_{12}}+ϕ{h_{13}}+φ{h_{23}}+η{h_{11}}+{{u^{ \prime }}_{3t}} \ \ \ (5) \)
y3t represents the growth rate of the stock market index, u1t represents the residual term, α represents the constant term, βi and γi are parameters. If the coefficient δ is significant, it shows that the fluctuation of house prices has a great influence on the growth rate of stock market index ; if the coefficient ξ is significant, it shows that the joint volatility of housing prices and currency supply has a greater impact on the growth rate of the stock market index. If the coefficient φ is significant, it shows that the joint fluctuation of the currency supply and the stock index has a great influence on the speed of stock market index. If the coefficient φ is significant, it shows that the joint fluctuation of housing prices and the stock market index has a great influence on the growth rate of the stock market index. If the coefficient η is significant, it shows that the fluctuation of the currency supply has a significant impact on the growth of the stock market index.
3.2.Data Collection and Processing
Since China enacted the housing system reform in late 1990s, specifically, the monetization of housing distribution has come into effect, so as the housing security system. Considering this policy and the availability of data, this paper chooses data of currency supply, property price index and Shanghai Security Composite Index from the fourth quarter of 2005 to the fourth quarter of 202, and finally forms 72 observations. Among them, the property price index is obtained from Fred. The quarterly data of China 's actual residential property prices from 2005 to 2023 released by the Bank for International Settlements, and the currency supply uses M2 data, that is, cash circulating outside the banking system plus demand deposits, time deposits and savings deposits, which generally reflect the liabilities of the financial system and the assets of the substantial economy. The M2 data used in this paper come from the monthly data of money and quasi-money in the monthly document of macro-economic library-financial industry-currency supply in CSMAR, and further use the arithmetic average to calculate the quarterly data of M2. The closing price of the Shanghai Security Composite Index uses the closing index data of the CSMAR market index database-domestic index trading data-domestic index monthly market documents. At the same time, the above three variables are logarithmically processed to eliminate heteroscedasticity to a certain extent. We use\( {M2_{t}} \)to represent the currency supply in the t-th quarter, and use\( {M2\_g_{t}}=log{M2_{t}}-log{M2_{t-1}} \)to calculate the growth rate of currency supply. Similarly,\( {Re_{t}} \)represents the property price index in the t-th quarter, and use\( {Re\_g_{t}}=log{Re_{t}}-log{Re_{t-1}} \)to calculate the growth rate of property prices. Finally,\( {Is_{t}} \)represents the price of the Shanghai Composite Index, and\( {Is\_g_{t}}=log{Is_{t}}-log{Is_{t-1}} \)is used to calculate the growth rate of the stock market index.
Table 1: Descriptive statistics of sample data.
|
Variable |
Min |
Max |
Mean |
Middle |
Std |
Coefficient of Variation |
|
M2 Growth(%) |
0.352 |
9.840 |
3.278 |
3.111 |
1.453 |
0.443 |
|
Real Growth(%) |
-2.773 |
3.208 |
0.243 |
0.239 |
1.449 |
5.941 |
|
Is Growth(%) |
-33.170 |
36.496 |
1.383 |
1.427 |
13.009 |
9.400 |
3.3.Basic Statistic Characteristics
The basic descriptive statistics on the growth rate of the currency supply, property price index and the stock market index are listed in Table 1. By analyzing the results, the stock market index is the largest, whether it is the maximum and minimum range (69.6%), the standard deviation (13.0%) or the coefficient of variation (9.4%), which also shows that the stock market has fluctuated very violently in the past 18 years, far exceeding the volatility of the currency market and even exceeding the volatility of the property market. In practice, however, the currency supply has the highest average growth rate, reflecting the policy direction of the last 18 years of loose monetary policy to stimulate the real and financial markets.
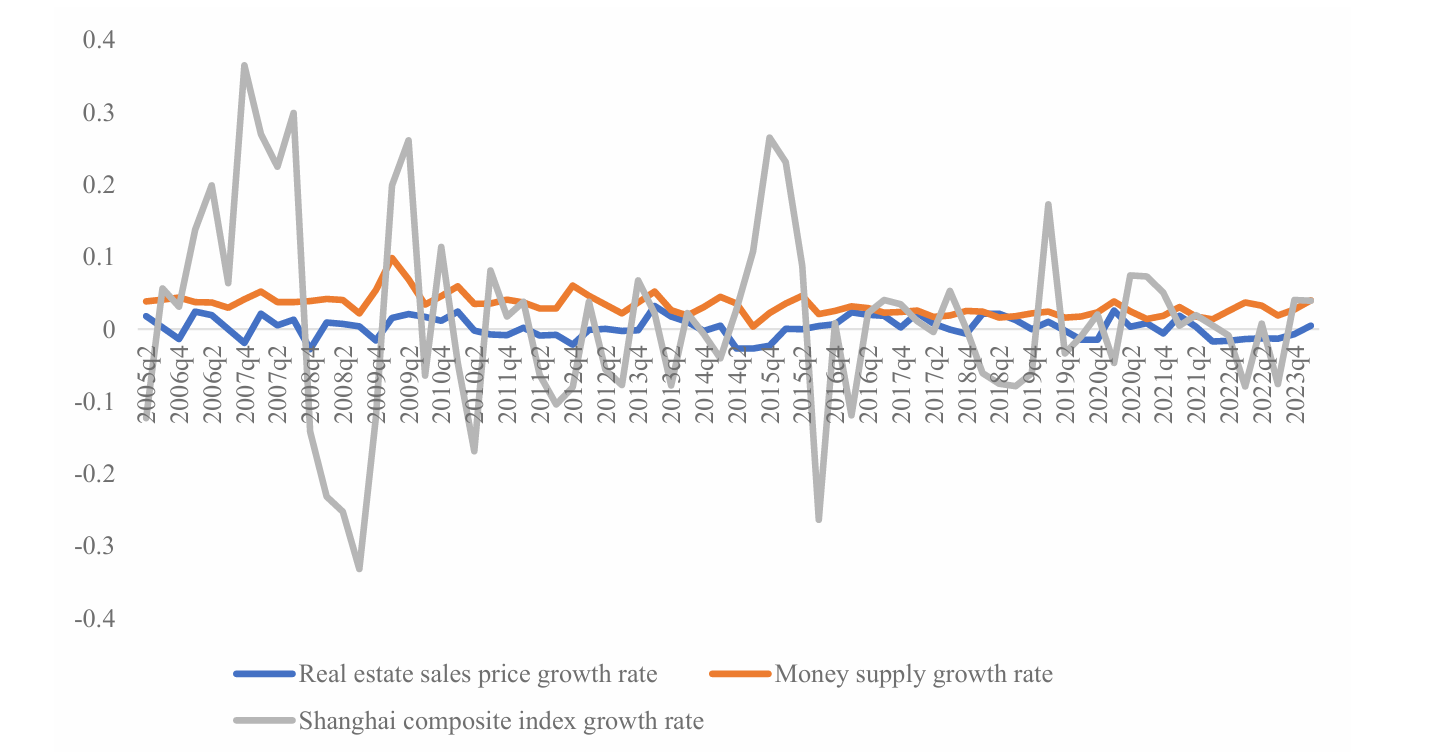 Figure 1: Currency supply, property sales price and Shanghai Security Composite Index growth rate fluctuation sequence diagram.
The ADF unit root test and JB normality test were performed on the data of the three time series. It was found that these variables were stable at the 5% level, and Re_g and Is_g were also stable at the 1% level, and these variables passed the normality hypothesis. The specific results are listed in Table 2, where c indicates that the stationarity test contains a constant term, t = 1 indicates the time trend, and p indicates the length of the autoregressive lag.
Table 2: The stationarity and normality test of sample data.
|
Variable |
(c,t,p) |
ADF statistic value |
ADF critical value (5%) |
ADF P-Value |
JB P-Value |
|
M2 Growth(%) |
(c,1,2) |
-2.331 |
-2.917 |
0.011 |
88.709 (0.000) |
|
Real Growth(%) |
(c,1,0) |
-7.488 |
-4.108 |
0.000 |
1.869 (0.3927) |
|
Is Growth(%) |
(c,1,0) |
-6.386 |
-2.915 |
0.000 |
1.966 (0.3740) |
3.4.Empirical Analysis based on MGARCH-BEKK Model
Table 3 lists the results of parameter estimation. The results show that all estimators are not significant; that is, there is no strong GARCH effect in the three variables, and that is, the relevant volatility impact of any two variables is not persistent. The interaction can affect the relationship between future currency supply and property price can influence the future interaction relationship between monetary supply and property price, and the same is true for the remaining two interactions. In another way, there is no statistical spillover effect between any of the two markets. This result is consist with the classical theory that the currency supply does not affect the performance of the financial macro market. The coefficients a1, a2 and a3 are not significant, indicating that the fluctuations of property prices, currency supply and stock market do not have an apparent ARCH effect; that is, the current fluctuations of property prices, currency supply and stock market do not have a strong impact on themselves. However, even though the coefficients a1, a2 and a3 are not significant, which does not mean that the product between them is not significant. That is to say, this result does not rule out the existence of ARCH effect between them. Therefore, using the BDS test, it is found that there is an ARCH effect in the linkage between currency supply and stock market growth, property price growth and stock market index growth. The result is listed in Table 4.
Table 3: Coefficient estimation of MGARCH-BEKK model.
|
Variable |
a1 |
a2 |
a3 |
b1 |
b2 |
b3 |
|
Estimation |
0.223 |
0.223 |
0.223 |
0.670 |
0.670 |
0.670 |
|
T-statistic |
0.034 |
0.082 |
0.075 |
0.360 |
0.719 |
0.400 |
|
P-values |
0.97 |
0.934 |
0.939 |
0.718 |
0.472 |
0.688 |
t-statistics in parentheses
*** p<0.01, ** p<0.05, * p<0.1
Table 4: BDS test result between currency supply, property price and stock index.
|
Conditional Coefficient |
BDS statistics (2 dimensions) |
Z statistics |
P-values |
|
h12 |
0.000 |
17.232 |
0.000 |
|
h13 |
0.0001 |
28.679 |
0.000 |
|
h23 |
0.0002 |
54.068 |
0.000 |
Figure 2 and Figure 3 show the trend of conditional variance and conditional covariance of currency supply, property price and stock market index growth, respectively. From Figure 2, it is found that the fluctuation of currency supply and property prices has maintained a relatively stable and slow rise in the past ten years, while the fluctuation of the stock market growth rate has changed greatly. In addition, the fluctuation of currency supply growth rate is similar to the fluctuation of house price growth rate, and the fluctuation of currency supply growth lags behind the fluctuation of property market, about 1-3 years.
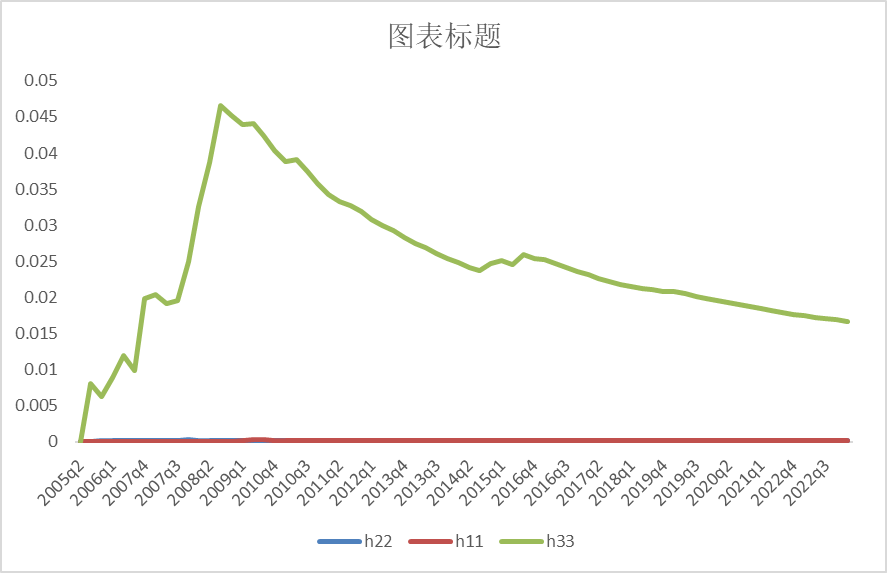
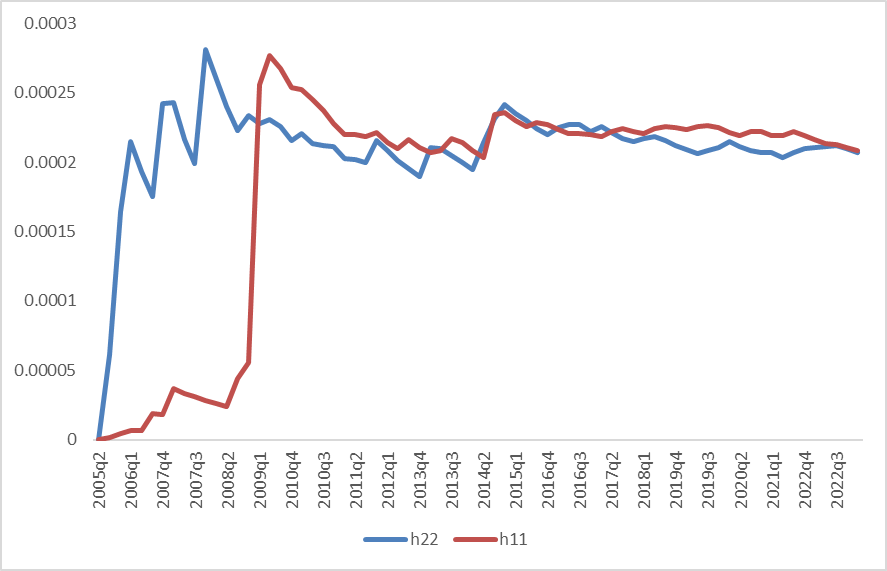
Figure 2: Trend of conditional variance change.
The lagged response of the property price growth rate to the currency supply growth rate seems to imply that the central bank 's currency supply has been targeting at the property price fluctuations, or the currency supply has spontaneously offset the fluctuations in house prices. If the latter, it clearly shows the significant correlation between the currency supply and the fluctuation of property prices, and the central bank has no need to apply straightforward interference on asset prices. However, the key point is that there is the possibility of currency supply intervention in property prices. We further analyze the correlation of variable fluctuations. Figure 3 shows the alteration of the conditional covariance of the three variables. It can be found that the linkage between the monetary growth rate and the volatility of the stock index and the linkage between the growth rate of the property price and the growth rate of the stock index are almost the same and in the same direction, while the linkage between the monetary growth rate and the growth rate of the property price does not change almost around the zero value, indicating that the fluctuation of the monetary growth rate and the property price growth rate is more stable. Obviously, this result supports that property prices can be directly intervened by adjusting the currency supply, and changes in the currency supply can cause simultaneous changes in house prices. However, it is almost impossible to directly affect the financial market through monetary policy. Due to the unstable linkage between the currency supply and the stock index, the adjustment of the currency supply can hardly predict the reaction of the financial market. If the central bank wants to stimulate / suppress the financial market through monetary policy, it is likely to lead to unpredictable policy consequences.
Figure 3: Trend of conditional covariance change.
3.5.Empirical Analysis based on GARCH Mean Equation Model
Firstly, an ARCH test is conducted, the result is shown as follows, which shows an ARCH effect in the model.
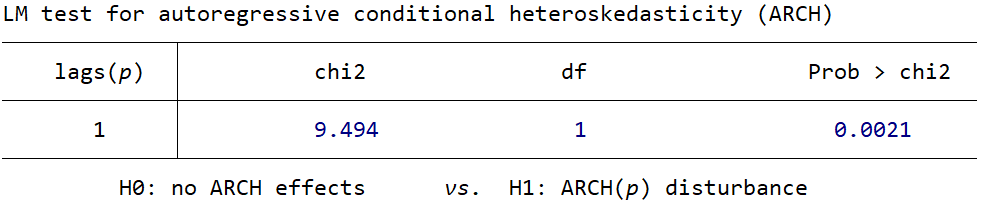
Figure 4: Result of ARCH test.
Based on the SC and AIC criteria, the optimal lag order of the stock index growth rate and residual term in the mean equation is determined to be 1. The conditional variance and conditional covariance inferred in the previous fluctuation correlation study are added to the mean model:
\( {y_{3t}}= α+β{y_{3t-1}}+γ{u_{3t-1}}+δ{h_{22}}+ξ{h_{12}}+ϕ{h_{13}}+φ{h_{23}}+η{h_{11}}+{{u^{ \prime }}_{3t}} \ \ \ (6) \)
Based on the estimation results of the model, δ is significant at the 95% level, while φ and φ are significant at the 99% level. This indicates that the combination of fluctuations in stock index volatility and house prices, as well as currency supply, has a significant positive impact on the growth rate of the stock index. Additionally, the combined fluctuation of currency supply and stock index growth also has a significant positive impact on the growth rate of the stock index. However, the joint fluctuation of house prices and stock index growth has a significant negative influence on the growth rate of the stock index. This shows that the reason why the fluctuation of the currency market can improve the growth rate of stock index is primarily due to the increase of fluctuation between the property market and the stock market, investors turn to invest in securities. To a certain extent, it contributes to the prosperity and growth of the stock market. Meanwhile, the increase in the volatility of currency supply is not conducive to the growth of the stock market, indicating that the central bank wants to control the financial market by adjusting the currency supply is likely to cause the opposite result. In addition, the volatility of the growth rate of the stock index is largely affected by the growth rate of the stock market itself and the linkage between the real economy and the currency market. Therefore, in order to maintain steady growth in the financial industry, it is vital to comprehensively consider the stock market and currency supply and property prices.
Table 5: Variable estimation based on mean equation model.
|
Variable |
\( δ \) |
\( ξ \) |
\( ϕ \) |
\( φ \) |
\( η \) |
|
Estimation |
1037.726** |
917.083 |
243.639*** |
-195.152*** |
-403.986* |
|
T-statistics |
2.04 |
1.50 |
3.29 |
-4.24 |
-1.84 |
|
P-Values |
0.041 |
0.134 |
0.001 |
0.000 |
0.066 |
t-statistics in parentheses
*** p<0.01, ** p<0.05, * p<0.1
4.Conclusion and policy advise
In terms of volatility correlation, there is no significant event volatility persistence and time-varying variance characteristics between currency supply, property sales price and stock market index, but there is a linkage ARCH effect. The linkage between the growth rate of currency supply and the growth rate of housing prices changes dramatically and significantly affects stock volatility, indicating that the central bank needs to start from both markets at the same time to indirectly regulate the stock market, rather than adjusting a single market. In terms of growth rate, the joint fluctuations between property price and monetary volume, property price and stock index, and monetary volume and stock index have a significant impact on the growth rate of the stock index. However, contrary to intuition, the joint fluctuation of monetary volume and property has increased the growth rate of the stock market to a certain degree, which is mainly brought by the property market. When the risk of volatility in the property market is high, investors turn to invest in the stock market, which makes the overall return of the stock market rise, paying a higher expected risk premium for the risk difference between the stock market and the property market, which also explains the low efficiency of Chinese investment to a certain degree.
In general, this paper believes that in order to adjust the financial market through monetary policy, the central bank does not need to apply monetary policy to directly target the real economy price, and the control of property prices can be achieved through non-monetary policies such as fiscal policy and land policy. Similarly, the stock market can also be achieved through financial control and the establishment of financial monitoring institutions.
References
[1]. Okunev J, Wilson P, Zurbruegg R. The causal relationship between real estate and stock markets[J]. The Journal of Real Estate Finance and Economics, 2000, 21: 251-261.
[2]. Gounopoulos D, Kosmidou K, Kousenidis D, et al. The investigation of the dynamic linkages between real estate market and stock market in Greece[J]. The European Journal of Finance, 2019, 25(7): 647-669.
[3]. Mi L, Hodgson A. Real estate's information and volatility links with stock, bond and money markets[J]. Accounting & Finance, 2018, 58: 465-491.
[4]. Liow K H, Zhou X, Li Q, et al. Dynamic interdependence between the US and the securitized real estate markets of the Asian-Pacific economies[J]. Journal of Property Investment & Finance, 2019, 37(1): 92-117.
[5]. Qi Yikang, Yuan Yuan Yuan, Lianfa.Spillover effects and risk correlation between China 's real estate sector and the overall stock market-Evidence from empirical analysis [J].Shanghai Economic Research, 2018 (6) : 58-67.
[6]. Jiang Yu, Li Jie, Wang Hua. Research on the two-way spillover effect of China 's real estate market and stock market [J]. Shanghai Economic Research, 2021, ( 06 ) : 93-104.
[7]. Zou Kunlun.Research on the stock market effect of fiscal policy and monetary policy-analysis based on SVAR model [J].Macroeconomic research, 2020.
[8]. Wang Xi, Zou Wenli. The impact of monetary policy on the stock market [J].Statistical Research, 2011,28 ( 12 ) : 55-65.
[9]. Zhou Hui, Wang Qing. Monetary Policy and Asset Price Volatility : Theoretical Models and Empirical Analysis of China [J].Economic Research, 2009, 10 : 61-74.
[10]. Bollerslev T, Engle R F, Wooldridge J M. A capital asset pricing model with time-varying covariances[J]. Journal of political Economy, 1988, 96(1): 116-131.
[11]. Engle R F, Kroner K F. Multivariate simultaneous generalized ARCH[J]. Econometric theory, 1995, 11(1): 122-150.
[12]. Baba, Y., R.F. Engle, D.F. Kraft, & K.F. Kroner (1991) Multivariate simultaneous generalised ARCH. Discussion paper 89-57, University of California, San Diego, Department of Economics.
Cite this article
Meng,S. (2024). Currency, Property and Stock Market Volatility : An Empirical Analysis of China. Advances in Economics, Management and Political Sciences,83,292-302.
Data availability
The datasets used and/or analyzed during the current study will be available from the authors upon reasonable request.
Disclaimer/Publisher's Note
The statements, opinions and data contained in all publications are solely those of the individual author(s) and contributor(s) and not of EWA Publishing and/or the editor(s). EWA Publishing and/or the editor(s) disclaim responsibility for any injury to people or property resulting from any ideas, methods, instructions or products referred to in the content.
About volume
Volume title: Proceedings of the 2nd International Conference on Management Research and Economic Development
© 2024 by the author(s). Licensee EWA Publishing, Oxford, UK. This article is an open access article distributed under the terms and
conditions of the Creative Commons Attribution (CC BY) license. Authors who
publish this series agree to the following terms:
1. Authors retain copyright and grant the series right of first publication with the work simultaneously licensed under a Creative Commons
Attribution License that allows others to share the work with an acknowledgment of the work's authorship and initial publication in this
series.
2. Authors are able to enter into separate, additional contractual arrangements for the non-exclusive distribution of the series's published
version of the work (e.g., post it to an institutional repository or publish it in a book), with an acknowledgment of its initial
publication in this series.
3. Authors are permitted and encouraged to post their work online (e.g., in institutional repositories or on their website) prior to and
during the submission process, as it can lead to productive exchanges, as well as earlier and greater citation of published work (See
Open access policy for details).
References
[1]. Okunev J, Wilson P, Zurbruegg R. The causal relationship between real estate and stock markets[J]. The Journal of Real Estate Finance and Economics, 2000, 21: 251-261.
[2]. Gounopoulos D, Kosmidou K, Kousenidis D, et al. The investigation of the dynamic linkages between real estate market and stock market in Greece[J]. The European Journal of Finance, 2019, 25(7): 647-669.
[3]. Mi L, Hodgson A. Real estate's information and volatility links with stock, bond and money markets[J]. Accounting & Finance, 2018, 58: 465-491.
[4]. Liow K H, Zhou X, Li Q, et al. Dynamic interdependence between the US and the securitized real estate markets of the Asian-Pacific economies[J]. Journal of Property Investment & Finance, 2019, 37(1): 92-117.
[5]. Qi Yikang, Yuan Yuan Yuan, Lianfa.Spillover effects and risk correlation between China 's real estate sector and the overall stock market-Evidence from empirical analysis [J].Shanghai Economic Research, 2018 (6) : 58-67.
[6]. Jiang Yu, Li Jie, Wang Hua. Research on the two-way spillover effect of China 's real estate market and stock market [J]. Shanghai Economic Research, 2021, ( 06 ) : 93-104.
[7]. Zou Kunlun.Research on the stock market effect of fiscal policy and monetary policy-analysis based on SVAR model [J].Macroeconomic research, 2020.
[8]. Wang Xi, Zou Wenli. The impact of monetary policy on the stock market [J].Statistical Research, 2011,28 ( 12 ) : 55-65.
[9]. Zhou Hui, Wang Qing. Monetary Policy and Asset Price Volatility : Theoretical Models and Empirical Analysis of China [J].Economic Research, 2009, 10 : 61-74.
[10]. Bollerslev T, Engle R F, Wooldridge J M. A capital asset pricing model with time-varying covariances[J]. Journal of political Economy, 1988, 96(1): 116-131.
[11]. Engle R F, Kroner K F. Multivariate simultaneous generalized ARCH[J]. Econometric theory, 1995, 11(1): 122-150.
[12]. Baba, Y., R.F. Engle, D.F. Kraft, & K.F. Kroner (1991) Multivariate simultaneous generalised ARCH. Discussion paper 89-57, University of California, San Diego, Department of Economics.