


1. Introduction
1.1. Research Background and Motivation
Stocks have always played an important role in the financial sector. The stock market is the "barometer" of the national economy, which is of great significance to the development of the national economy. Changes in the price of bank stocks have an important impact on the whole stock market. Therefore, the modelling of stock price changes and the prediction of future trends have certain practical value in both practical and theoretical aspects. Theoretically, stock prices change over time and are time series data. Similar to stock prices, indices and other financial time series, their fluctuations are affected by a variety of factors in the market, and these complex influencing factors are difficult to be fully taken into account or cannot be measured quantitatively, so time series analysis focuses on its own probabilistic or stochastic nature, and explains the fluctuations of the dependent variable by its own past or lagged value and the error term and makes predictions for the future, which is the principle of time series analysis [1]. This is the principle of time series analysis [1]. Bank of China (BOC) is among the four major banks owned by the state in China. BOC accomplished a triumphant dual listing on the Hong Kong Stock Exchange and Shanghai Stock Exchange in 2006, establishing itself as the pioneering bank to be listed under the "A+H" category in China. For twelve consecutive years, Bank of China has been recognized as a globally significant bank systemically, indicating that its international status, competitiveness and overall strength are at par with other large global banks. Bank of China offers a wide range of services in corporate finance, personal finance, and financial markets. It has established a global service network that encompasses investment banking, direct investment securities, and various other sectors. This comprehensive platform enables the bank to cater to diverse needs efficiently. Studying the stock of Bank of China helps to better understand and analyse the financial market in China and the world. Currently, research in time series forecasting has achieved remarkable results. the ARIMA model is currently the most commonly used model for fitting smooth time series. However, the accuracy of the ARIMA model in predicting stock prices needs to be studied.
1.2. Literature Review
Ruixue Zhang et al. proposed a deep learning-based stock price prediction model that incorporates LSTM, BiLSTM, and attention mechanisms to better deal with long-term dependencies and nonlinear relationships in time series data [2]. Experimental results show that the model achieves excellent performance on the stock price prediction task. Meng Li et al. proposed the wavelet-long short memory network (LSTM-Wavelet) model applied to stock price prediction. The share price data of PetroChina for the past two years was used for empirical analysis to predict the closing price of PetroChina on the same day [3]. Jie Zou et al. proposed a Random Forest-based SA-BiGRU (RF-SA-BiGRU) model to predict stock closing prices. A total of 260 factor data of Shunxin Agriculture (000860) from 2008-2022 were used, and experiments showed that the prediction accuracy and stability of the RF-SA-BiGRU model were better than other models [4]. Zhihao Zeng et al. investigated the financial data prediction accuracy of LSTM models with optimisation algorithms by comparing the accuracy of three LSTM models (a single model with no weighted average, a model using Adam's optimiser, and a multi-model fusion approach based on weighted average) in financial data prediction [5].Ying Wang selected 245 daily stock opening prices of Bank of China as a sample, fitted and optimised an ARMA model to the historical stock prices, and predicted its stock opening prices for the next three days. The prediction results demonstrated the feasibility of the time series model for short-term prediction of stock prices [6]. Ning Zhao selected the opening price of Vanke's stock from 10 March 2020 to 22 February 2021 as a sample and used the ARIMA model to make a prediction of the stock price for the next 1 day [7]. The prediction results with more accurate, further indicating that the ARIMA model constructed in this paper can predict the stock's opening price of the day more accurately. ARIMA model can be used to make short-term prediction of stock price, but there are fewer studies applying ARIMA model to make stock price prediction. Existing research mainly focuses on the analysis of corporate stock prices, and less on the analysis and prediction of Bank of China's stock prices. In this paper, ARIMA model is chosen to forecast the stock price of Bank of China.
1.3. Research Contents
This paper focuses on whether the ARIMA model has high accuracy in predicting stock prices. The ARIMA model is established after the smoothness test by the stock opening price of Bank of China from 1 January 2021 to 30 December 2023, then the significance test of the model is carried out, and finally the stock opening price from 1 January 2024 to 31 January 2024 is predicted, and the predicted value is compared with the real value to draw a conclusion.
2. Methodology
2.1. ARIMA
The Autoregressive Integrated Moving Average Model, commonly referred to as ARIMA model, was first proposed by Box and Jenkins during the early 1970s. It is a widely recognized approach for forecasting time series data. The ARIMA(p,d,q) model is a model that combines autoregressive and moving average components to achieve smoothness in the time series. The term "AR" represents the autoregressive component with p indicating its order, while "MA" refers to the moving average component with q representing the number of terms involved. Additionally, "d" signifies the number of differentials applied for achieving smoothness in the time series. The ARIMA model involves transforming a non-stationary time series into a stationary one and then performing regression solely on lagged values of both dependent variable and random error term at present and previous instances. [8].
The form of a general ARMA(p,q) model can be expressed as:
\( {w_{t}}=c+{∅_{1}}{w_{t-1}}+⋯+{∅_{p}}{w_{t-p}}+{ε_{t}}+{θ_{1}}{ε_{t-1}}+{θ_{q}}{ε_{t-q}} \) (1)
where { } is a white noise sequence, p and q are non-negative integers, and both AR and MA models can be considered as specific instances of ARMA(p,q). Specifically, when p=0, the ARMA(0,q) model reduces to MA(q), while when q=0, the ARMA(p,0) model simplifies to AR(p).
The ARIMA model follows a similar structure to the ARMA model, but with a modification in which Y is replaced by a differencing operator in the ARIMA formula. This adjustment aims to enhance data stability [9].
2.2. Sample Selection
In this paper, the daily opening price data of Bank of China (601988) stock from 4 January 2021 to 29 December 2023 were selected by Invesco (https://cn.investing.com/), with a total of 727 samples. The sample interval trend is shown in Figure 1:
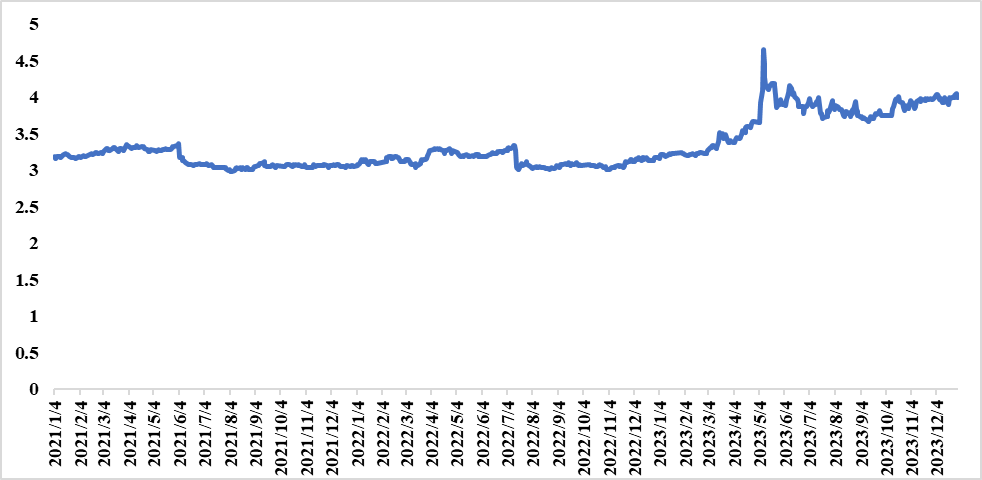
Figure 1: Bank of China (601988) daily opening price trend over the period 2021-2023
As can be seen in Figure 1, the stock opening price series is not smooth. The average value of the sample is 3.33, with a highest recorded value of 4.65 and a lowest recorded value of 2.98.
2.3. Smoothing Test
The smoothness of the time series was assessed using the ADF test and KPSS test. The results are presented in Table 1 and Table 2. According to Table 1, the p-value is 1.35e-05, which is below the significance level (0.05), suggesting that there is no presence of a unit root in the time series.
Table 1: ADF test results
Multiple R-squared | 0.05 |
Adjusted R-squared | 0.04 |
p-value | 1.35e-05 |
Based on the findings presented in Table 2, it can be observed that the obtained P-value of 0.01 is below the predetermined significance threshold of 0.05. This implies that there exists substantial evidence suggesting an absence of smoothness within the time series data. By considering both methods together, it can be concluded that the series does not exhibit smoothness.
Table 2: KPSS test results
KPSS Level | 6.1478 |
Truncation lag parameter | 6 |
p-value | 0.01 |
The original stock series is differenced and the opening price of the stock after performing the first order differencing is shown in Figure 2, where the data tends to be stable.
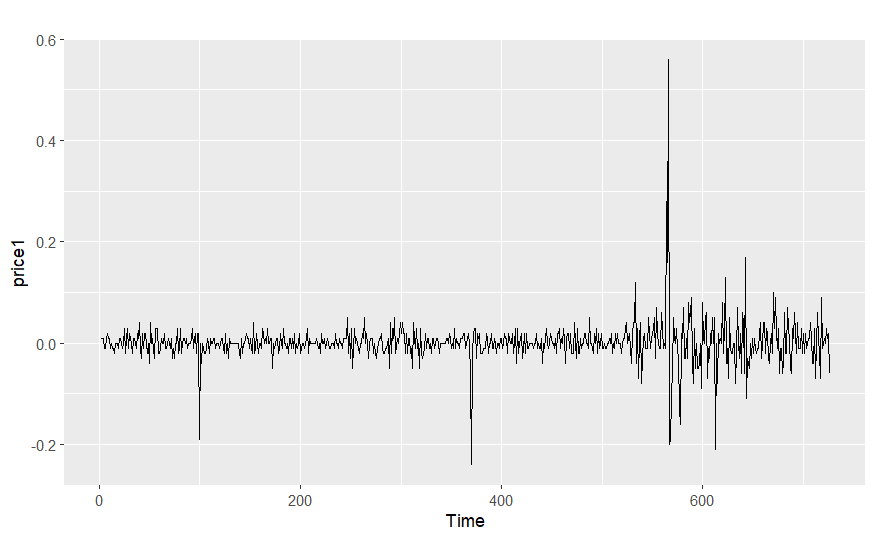
Figure 2: Bank of China (601988) daily opening price trend during 2021-2023 after first-order differencing
In order to further confirm the smoothness of the time series after first order differencing, ADF test and KPSS test are required. The test results are shown in Tables 3 and 4, from Table 3, the P-value is < 2.2e-16, which is less than the level of significance (0.05), indicating that the time series has no unit root.
Table 3: ADF test results
Multiple R-squared | 0.51 |
Adjusted R-squared | 0.5 |
p-value | < 2.2e-16 |
According to the results in Table 4, the P-value exceeds the significance level (0.05) with a value of 0.1, suggesting that the time series exhibits smoothness. By utilizing both methods mentioned above, it can be concluded that the series is indeed smooth.
Table 4: KPSS test results
KPSS Level | 0.11 |
Truncation lag parameter | 6 |
p-value | 0.1 |
3. Analysis of model estimation results
3.1. Modelling
The autoregressive integrated moving average model (ARIMA) parameter selection for Bank of China stock price data was automated using the auto.arama() function of the forecast package in R language. The function determines the optimal ARIMA(p, d, q) model structure by combining the AIC, BIC, or other specified information criteria and searching for all possible combinations within a specified maximum order range. Finally, the choice of model is determined to be ARIMA (4, 1, 0).
3.2. Model Testing
Once the parameter selection was completed, the model was tested for significance. As shown in Figure 3, the ACF plot of the residuals shows truncated tails, indicating that the ARIMA (4, 1, 0) model successfully captures most of the dependence structure in the time series, while the residuals essentially behave as random noise. The model has good forecasting performance.
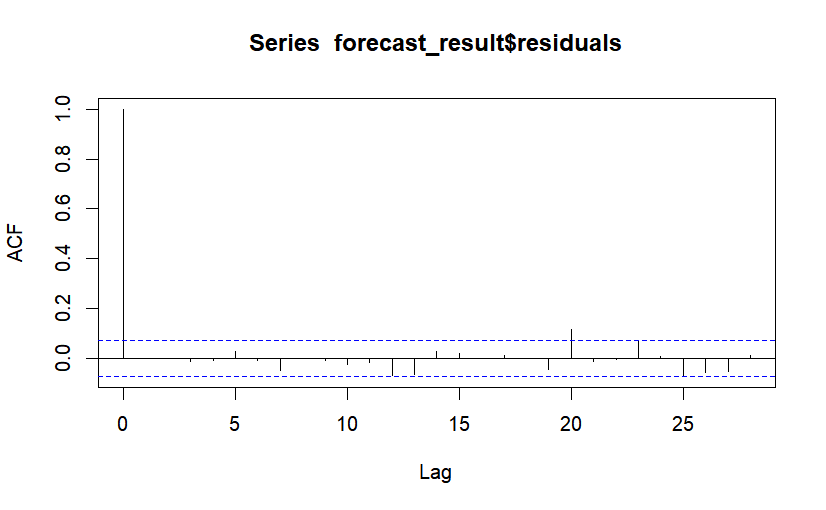
Figure 3: Autocorrelation function (ACF) plot of residuals
As shown in Figure 4, most of the partial autocorrelation coefficients of the residuals are within the dashed line, even though the 20th and 25th orders exceed 2 times the standard deviation, which may be due to chance. It shows that the ARIMA (4, 1, 0) model adequately extracts the information in the time series, i.e., the residual series is a white noise series. The model prediction effect is significant.
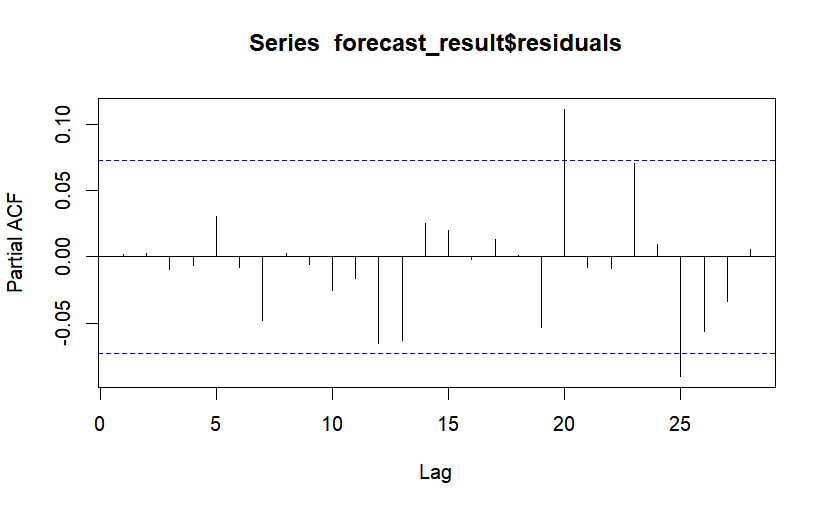
Figure 4: Plot of partial autocorrelation coefficient (PACF) of residuals
The Shapiro-Wilk test was conducted on the residuals of the ARIMA (4, 1, 0) model. The obtained W-statistic value is 0.97, indicating that the residuals possess relatively strong normality characteristics. Furthermore, the p-value of 0.32 surpasses the significance threshold of 0.05. Therefore, there is inadequate evidence to refute the initial hypothesis suggesting that the residuals adhere to a normal distribution. As a result, based on Table 5 findings at a significance level of 5%, it can be inferred that the residuals exhibit an approximate normal distribution.
Table 5: Results of Shapiro-Wilk normality test
W | 0.97 |
p-value | 0.32 |
The ARIMA (4, 1, 0) model underwent the Ljung-Box test and the findings are presented in Table 6. The obtained p-value of 0.82 exceeds the significance level (0.05), indicating that there is no sufficient evidence to reject the null hypothesis. Therefore, it can be concluded that the residual series represents a white noise process and confirms the significant validity of the model.
Table 6: Results of Ljung-Box test
Q* | 2.92 |
df | 6 |
p-value | 0.82 |
In summary, the ARIMA (4, 1, 0) model fits the data more adequately for the next prediction step.
4. Model Prediction
Finally, the ARIMA model with parameters (4, 1, 0) is employed to forecast the future opening price of Bank of China (601988) for a period of 28 days. The predicted outcomes are then compared against actual data and presented in Figure 5. According to Figure 4, the stock price predicted with the model is closer to the real price in the first 17 days, with a smaller error, indicating that the ARIMA model is more effective in predicting the short-term price of the stock. However, due to more factors affecting the long-term price of the stock, such as the occurrence of the new crown epidemic, macro-control policies and the promulgation of relevant policies and regulations, the error increases when using the ARIMA model for a longer period of time [10]. Therefore, it is recommended to choose ARIMA model for short-term forecasting of stock prices.
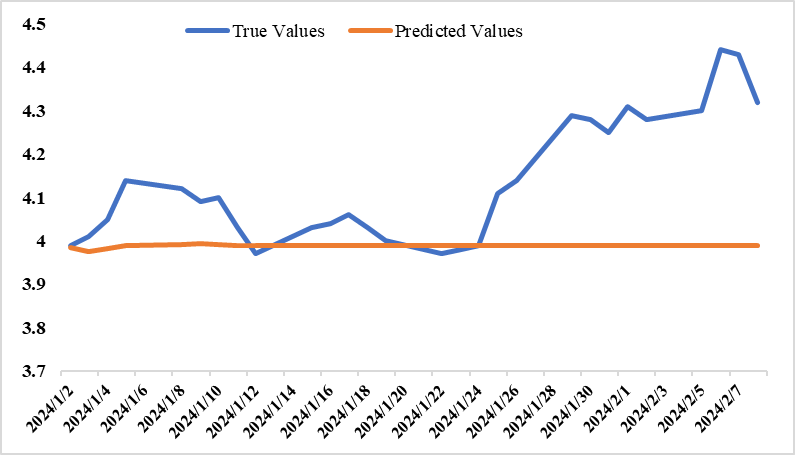
Figure 5: Bank of China (601988) Real and Forecast Values, 2 January - 8 February 2024
5. Conclusion
In this study, an ARIMA (4, 1, 0) model is developed to empirically examine the time series data of Bank of China's (601988) opening price. The aim is to forecast the stock price for the upcoming 28 days and compare it with the actual value. The analysis reveals that the predicted value of Bank of China's stock price tends to stabilize after a small decline, while the true value is basically higher than the predicted value. This shows that Bank of China, as a state-controlled large commercial bank, has a certain stability in the financial market, and shows some investment value. The ARIMA model has high accuracy in short-term forecasting of stock price, but there is a large error in long-term forecasting. Investors and decision makers may consider investing in Bank of China stocks in the future to obtain higher and more stable investment returns. It is recommended to use ARIMA model for short-term stock price prediction to obtain useful information and theoretical basis, but still need to combine the current market situation and other factors to make scientific stock price prediction. This paper does not compare the effect of ARIMA model with other time series models, nor does it further discuss the model selection for long-term forecasting of Bank of China stock. This paper will provide a reference for the subsequent research on short-term stock price forecasting and ARIMA model, and fill the existing research gaps.
References
[1]. Zhang, Yajie. (2019). A simple comparative analysis of stock and index forecasting results based on ARIMA model. Market Research, (11), 23-26.
[2]. Zhang, Ruixue & Hao, Yongtao. (2023). A study on stock price prediction based on deep learning. Computer Knowledge and Technology, (33), 8-10.
[3]. Li, M., Huang, Z. J. & Xu, J. H.. (2023). Stock price prediction of LSTM-Wavelet model based on deep learning and wavelet analysis. Journal of Chongqing Technology and Business University (Natural Science Edition), (02),99-105.
[4]. Zou, J. & Li, L.. (2023). A study on stock price prediction based on SA-BiGRU model of random forest. China Price, (11),52-56.
[5]. Zeng, Z. H., Wang, J. H., Hu, L. Y. & Huang, H. L.. (2023). A study on the accuracy of LSTM model in financial forecasting under optimization algorithm. Computer Programming Skills and Maintenance, (11), 60-64+75.
[6]. Zhao, N. (2023). Short-term forecasting of Vanke stock price based on ARIMA model. Finance Hake, (01),34-36.
[7]. Wang Ying. (2021). Analysis and prediction of stock price based on ARMA model. Productivity Research, (09),124-127.
[8]. Xu, Chenmeng & Fang, Hua. (2019). An empirical study on stock price forecasting using ARMA model. Journal of Economic Research, (31), 77-82.
[9]. Ding, Wei Ke. (2019). Empirical analysis of stock price prediction based on ARMA model. Guangxi quality supervision guide, (05),151-153.
[10]. Zixia Weng. (2023). Share price analysis and prediction based on ARIMA model - Construction Bank as an example. Modern Information Technology, (14),137-141.
Cite this article
Dong,S. (2024). Stock Price Analysis and Forecasting of Bank of China Based on ARIMA Model. Advances in Economics, Management and Political Sciences,84,133-140.
Data availability
The datasets used and/or analyzed during the current study will be available from the authors upon reasonable request.
Disclaimer/Publisher's Note
The statements, opinions and data contained in all publications are solely those of the individual author(s) and contributor(s) and not of EWA Publishing and/or the editor(s). EWA Publishing and/or the editor(s) disclaim responsibility for any injury to people or property resulting from any ideas, methods, instructions or products referred to in the content.
About volume
Volume title: Proceedings of the 2nd International Conference on Management Research and Economic Development
© 2024 by the author(s). Licensee EWA Publishing, Oxford, UK. This article is an open access article distributed under the terms and
conditions of the Creative Commons Attribution (CC BY) license. Authors who
publish this series agree to the following terms:
1. Authors retain copyright and grant the series right of first publication with the work simultaneously licensed under a Creative Commons
Attribution License that allows others to share the work with an acknowledgment of the work's authorship and initial publication in this
series.
2. Authors are able to enter into separate, additional contractual arrangements for the non-exclusive distribution of the series's published
version of the work (e.g., post it to an institutional repository or publish it in a book), with an acknowledgment of its initial
publication in this series.
3. Authors are permitted and encouraged to post their work online (e.g., in institutional repositories or on their website) prior to and
during the submission process, as it can lead to productive exchanges, as well as earlier and greater citation of published work (See
Open access policy for details).
References
[1]. Zhang, Yajie. (2019). A simple comparative analysis of stock and index forecasting results based on ARIMA model. Market Research, (11), 23-26.
[2]. Zhang, Ruixue & Hao, Yongtao. (2023). A study on stock price prediction based on deep learning. Computer Knowledge and Technology, (33), 8-10.
[3]. Li, M., Huang, Z. J. & Xu, J. H.. (2023). Stock price prediction of LSTM-Wavelet model based on deep learning and wavelet analysis. Journal of Chongqing Technology and Business University (Natural Science Edition), (02),99-105.
[4]. Zou, J. & Li, L.. (2023). A study on stock price prediction based on SA-BiGRU model of random forest. China Price, (11),52-56.
[5]. Zeng, Z. H., Wang, J. H., Hu, L. Y. & Huang, H. L.. (2023). A study on the accuracy of LSTM model in financial forecasting under optimization algorithm. Computer Programming Skills and Maintenance, (11), 60-64+75.
[6]. Zhao, N. (2023). Short-term forecasting of Vanke stock price based on ARIMA model. Finance Hake, (01),34-36.
[7]. Wang Ying. (2021). Analysis and prediction of stock price based on ARMA model. Productivity Research, (09),124-127.
[8]. Xu, Chenmeng & Fang, Hua. (2019). An empirical study on stock price forecasting using ARMA model. Journal of Economic Research, (31), 77-82.
[9]. Ding, Wei Ke. (2019). Empirical analysis of stock price prediction based on ARMA model. Guangxi quality supervision guide, (05),151-153.
[10]. Zixia Weng. (2023). Share price analysis and prediction based on ARIMA model - Construction Bank as an example. Modern Information Technology, (14),137-141.