


1. Introduction
Financial markets have been an area of intense research in recent years, and as the core of the financial field, the stock market is particularly attractive, providing a variety of opportunities for investors as well as researchers from different disciplines. Studies have indicated that stock markets exhibit non-linear, high volatility, and chaotic characteristics. They may be affected by various events and thus experience volatility [1]. As a result, society has raised the need for data-driven methods to forecast stocks [2]. The current industry landscape reflects a growing reliance on advanced data processing techniques, such as machine learning models, to make more nuanced predictions about complex stocks. As a result of the 20th century's quick advancements in information technology and the massive collection of financial data, machine learning techniques for stock prediction saw a steady improvement. Utilizing machine learning techniques enables the discovery of fresh prospects and advancements in investment within the realm of financial markets [3]. Stock forecasting has entered a new stage of development. Therefore, comprehending and contrasting the use of various machine learning models in stock prediction plays a part in illuminating and advancing the development of this discipline.
The use of machine learning algorithms in the stock market opens new forecasting opportunities. Models like long short-term memory (LSTM) networks, K-nearest neighbour (KNN), and linear regression have all been extensively employed in the past with varying degrees of success in stock market predictions.
Firstly, linear regression is often referred to as a straightforward model that captures the linear connection between input and output data [4]. In stock forecasting, it is used to establish a linear relationship between stock prices and other factors. During regression analysis, specifically Ordinary Least Squares (OLS), analysts are tasked with selecting variables, formulating the model, and performing a range of diagnostic procedures [5]. The linear regression model has some predictive power for stock price changes in the short term, especially under stable market conditions.
What’s more, the core principle of KNN lies in its ability to pinpoint a cluster of k samples from the training dataset that are most similar to unknown samples [4]. The algorithm utilizes a sample data set with a specific class. Once the new data to be added to the sample data set is appended to the existing data, the algorithm examines the k nearest neighbours [6]. KNN is primarily employed in classification tasks. It relies on a distance function to assess the similarity or dissimilarity between two instances [7]. The predictive performance of KNN is influenced by the selection of the distance metric [5]. As for stock market prediction, the KNN model can accommodate irregular data distribution and complex market patterns.
Finally, a neural network is a structure designed to handle distributed and parallel information processing, comprising interconnected processing units known as neurons and unidirectional signal pathways called connections [8]. LSTM, a subtype of recurrent neural networks (RNNs), is tailored to analyze sequential data [9]. The study by Pramod and Pm showed that LSTM can capture complex patterns in the data and learn long-term dependencies, thus improving the stability and accuracy of predictions [10].
To sum up, this paper is driven by the market's need for assessing the effectiveness of different machine learning models in stock forecasting. The primary objective is to evaluate and compare the effectiveness of these methods in stock prediction, offering investors and researchers a foundation for choosing the most suitable model. The research paper will utilize Python for data analysis, assessing the strengths and weaknesses of machine learning models through RMSE calculations. Models like linear regression, KNN, and LSTM will be compared in this analysis. Based on the result of the comparison, the paper will also put forward the discussion direction of the future development of machine learning models.
2. Methods
2.1. Data Sources
The dataset employed in this research is fetched from the Kaggle website (Tesla Stock Price Prediction). It was the EOD data for Tesla’s stock from 2010 to 2020, collected on finance.yahoo.com by Bozsolik. The dataset contained a total of 2614 observations and remained in the .csv format. Among the dataset, the number of training set observations is 1812 and the number of validations set observations is 604.
2.2. Variable Selection
Stock prices constitute a crucial element of financial markets and are susceptible to fluctuations influenced by significant global events, such as political turmoil, natural disasters, and so on. The closing price, as a stock prediction indicator, possesses the advantages of directness, ease of acquisition, and information richness. It reflects the consensus among market participants regarding the stock's value on a given day and represents the outcome of market supply and demand dynamics. By analysing patterns in closing price fluctuations, one can unveil the laws governing stock price trends. This enables investors to better grasp market trends, mitigate investment risks, and achieve superior returns on investments. Figure 1 below shows the stock price change of Tesla from 2010 to 2020.
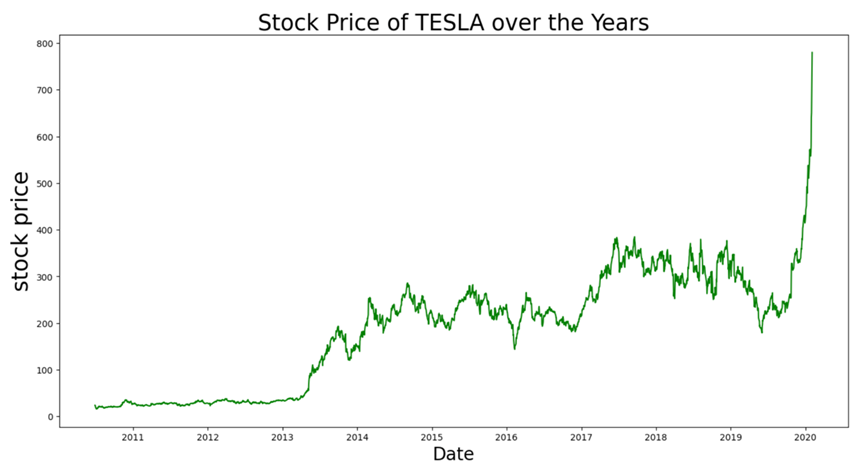
Figure 1: Stock price of Tesla over the years.
It can be observed from Figure 1 that the stock price of Tesla showed an overall trend of rising volatility, which was relatively flat before 2013 and dominated by volatility from 2013 to 2019. It bottomed out after a low point in mid-2019 and has since shown a cliff-like upward trend.
2.3. Model Selection
This paper will use linear regression, KNN and LSTM to predict the stock of Tesla respectively, and then compare the results according to the prediction. Different models have their own advantages and limitations.
Linear regression assumes a straightforward and rapid approach by establishing a linear correlation between variables, particularly effective in scenarios exhibiting evident linear trends. However, it struggles with nonlinear relationships and complex patterns, requiring normality and independence assumptions. Figure 2 illustrates the flow diagram outlining the linear regression technique.
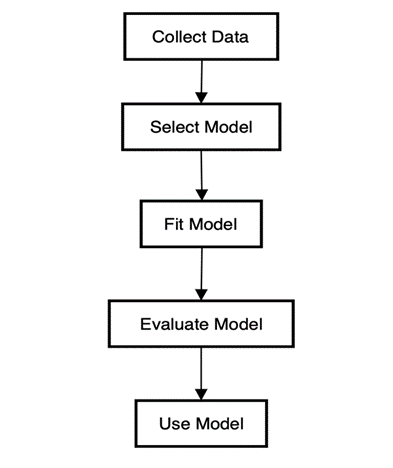
Figure 2: The flow chart of the linear regression approach.
KNN finds similar training samples to predict outcomes, suitable for nonlinear data without distribution assumptions. It's easy to understand but computationally intensive, sensitive to outliers, and requires ample data. Figure 3 below is a schematic diagram of the KNN method.
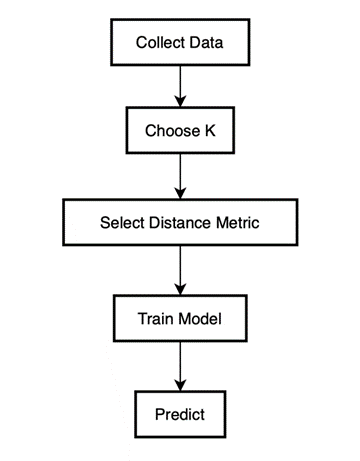
Figure 3: The Flow Diagram of the KNN Method.
LSTM is particularly adept at capturing extended relationships within temporal data, which makes it perfect for complex patterns. It requires more parameters, longer training, and substantial data support. Figure 4 below is a schematic diagram of the flow of the LSTM method.
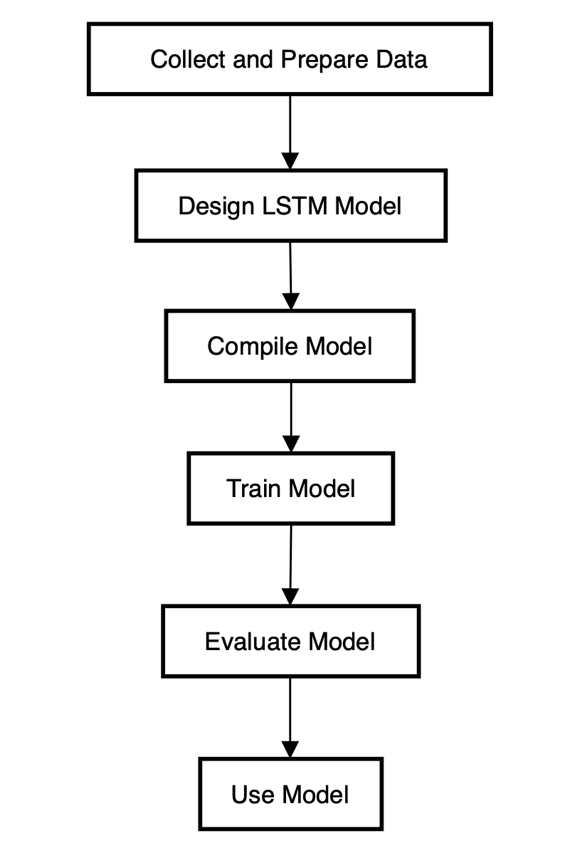
Figure 4: The Flow Diagram of the LSTM Method.
3. Results and Discussion
3.1. Model Evaluation
When machine learning models are applied to stock prediction, the root mean square error (RMSE) is commonly employed to quantify the disparity between the model prediction results and the actual observed values. The following is a mathematical interpretation of RMSE, which is a common measure of error.
Suppose there are \( n \) observations and corresponding predicted values, denoted \( {y_{i}} \) and \( {\hat{y}_{i}} \) respectively, where \( i \) denotes the \( i \) th sample. Initially, the residual for each sample, which is the difference between the observed and predicted values, is computed. Here is the formula (1) that represents the residual.
\( Residual= {y_{i}}-{\hat{y}_{i}} \) (1)
Subsequently, squaring and averaging each residual yields the Mean Squared Error (MSE). It is the equation (2) that represents the MSE.
\( MSE=\frac{\sum _{i=1}^{n}{({y_{i}}-{\hat{y}_{i}})^{2}}}{n} \) (2)
Finally, RMSE, as the square root of MSE, represents the fitting standard deviation of regression coefficients. RMSE is intuitive and informative, better-reflecting model performance in predicting extreme values, and aiding decision-making and model selection. The equation (3) is the interpretation of the RMSE.
\( RMSE=\sqrt[]{MSE}=\sqrt[]{\frac{\sum _{i=1}^{n}{({y_{i}}-{\hat{y}_{i}})^{2}}}{n}} \) (3)
The reasons for using RMSE as a measure to compare the performance of different models in stock price forecasting are as follows. It quantitatively measures forecast error, highlighting differences between predicted and actual values objectively. RMSE emphasizes large errors, providing insights into extreme value predictions. Its unit consistency aids quick understanding by practitioners and researchers, facilitating decision-making and model selection.
3.2. Forecasting Results
The following are visual representations of linear regression, KNN, and LSTM models when predicting Tesla stock. All three models are under the same restrictions. The models are based on Tesla's stock data from 2010 to 2017 and then predict the stock price from 2018 to 2020. Figure 5 below shows the stock price prediction by the linear regression model. Figure 6 illustrates the stock price forecasting by KNN and Figure 7 demonstrates the stock price prediction by LSTM.
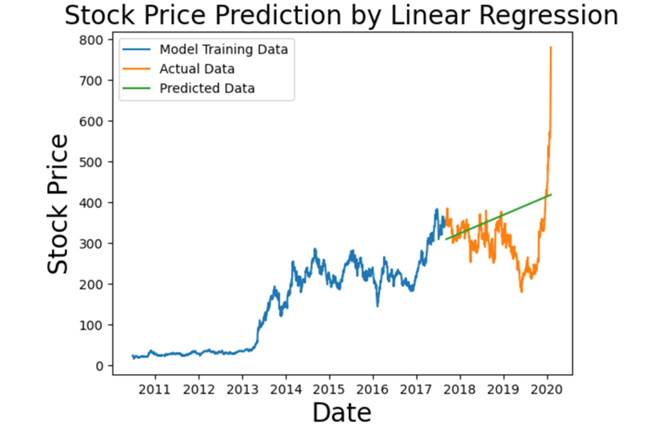
Figure 5: Stock price prediction by linear regression.
The forecasted values from linear regression typically align closely with the actual values in terms of overall trend (Figure 5). However, because linear regression focuses on grasping linear data, it cannot well fit the volatility degree of actual stock data.
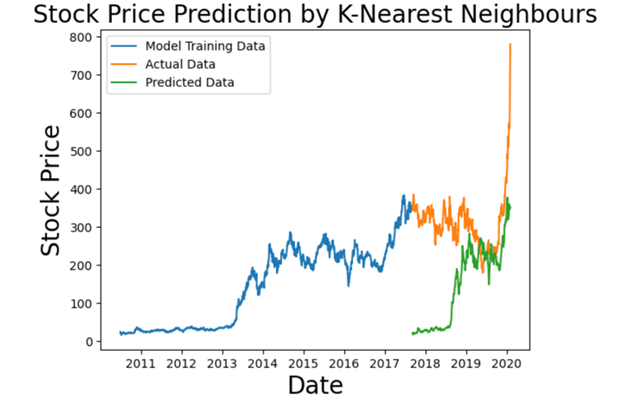
Figure 6: Stock price prediction by K-Nearest Neighbours.
As depicted in the provided figure, the stock predictions generated by the KNN approach exhibit a poor fit with the actual stock fluctuations. A large degree of deviation has occurred (Figure 6).
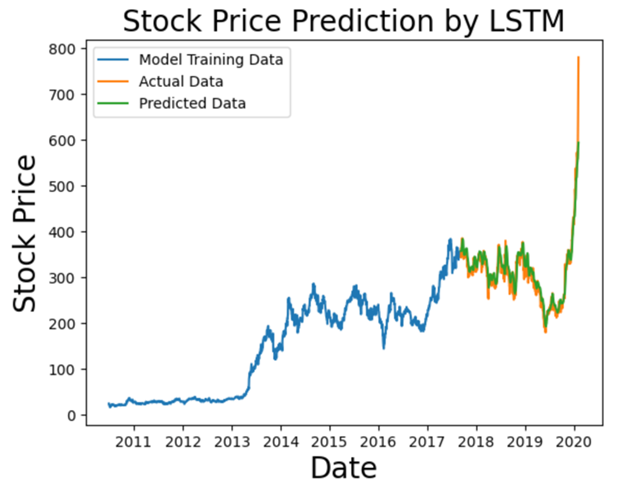
Figure 7: Stock Price Prediction by LSTM.
Upon initial assessment of interpretability, the LSTM model stands out as the most suitable choice for stock prediction outcomes among the three models. In the next section, a more objective judgment will be made by combining the calculation results of RMSE (Figure 7).
3.3. Comparison
As mentioned above, RMSE, as an important index to measure error, will be used to compare the results of linear regression, KNN and LSTM for Tesla stock prediction. Table 1 illustrates the corresponding RMSE results for the different three models.
Table 1: The RMSE results for different methods.
Models | RMSE |
Linear Regression | 91.127 |
KNN | 204.776 |
LSTM | 19.277 |
Table 1 verifies the view based on the viewability above. The prediction results of LSTM have the lowest RMSE, which proves that the forecasted value of the LSTM method can fit the observed value to a high degree in the application of Tesla stock prediction. The LSTM model performs best in stock prediction, followed by the linear regression model and finally the KNN model.
Combined with the above introduction of these three models and the characteristics of RMSE, stock prices are often affected by multiple factors, and their changes have complex nonlinear relationships and time series correlations. On the contrary, the linear regression model assumes that the relationship between variables is linear, while the KNN model may not capture the nonlinear relationship well in high dimensional space, and these two models have strict assumptions about the data distribution and weak generalization ability. Compared with linear regression and KNN models, LSTM has a better ability to capture complicated patterns and extended correlations in temporal data in stock forecasting, thus improving the accuracy and generalization ability of forecasting.
3.4. Critical Thinking
Based on the above comparison results, this paper will discuss the future development direction of machine learning models. First and foremost, machine learning models such as LSTM perform excellently in handling complex data and tasks. Future development will continue to enhance the effectiveness and efficiency of the different models, including improving the network structure, optimizing the training algorithm and accelerating the inference process. Besides, as the importance of time series data increases in finance, meteorology, medical care and other fields, the demand for models that can effectively process time series data will also increase. LSTM and other recurrent neural networks such as RNN will continue to receive attention and play an important role in time series prediction and analysis. Finally, future trends may focus more on fusion and ensemble learning between different models to improve forecasting performance and stability. Combining different types of models such as LSTM, linear regression, and KNN can take full advantage of their respective advantages, thus improving the accuracy and robustness of forecasts.
4. Conclusion
In summary, this study underlines the importance of machine learning techniques in the realm of stock prediction. The comparison of various machine learning algorithms revealed their effectiveness in capturing and analyzing complex patterns and trends in stock market data. The paper compares the performance of three machine learning methods: linear regression, KNN, and LSTM in Tesla stock prediction. Following a thorough assessment and comparison, it can be deduced that the LSTM model demonstrates superior performance in forecasting Tesla stock. The LSTM model can better capture the time series characteristics and nonlinear relationships of stock prices, thus improving the accuracy and stability of the prediction. Based on this conclusion, this study discusses the future development direction of machine learning methods in the realm of stock prediction. Future research directions include further optimizing parameter settings of the LSTM model, increasing the dimension of data features, exploring ensemble learning methods and introducing attention mechanism and other technical means to improve the prediction performance and generalization ability of the model. These explorations will help promote the development of machine learning algorithms in the field of stock forecasting, providing investors with more accurate and reliable decision support, to achieve better investment returns in the stock market.
References
[1]. Thakkar, A. and Chaudhari, K. (2021) Fusion in stock market prediction: a decade survey on the necessity, recent developments, and potential future directions. Information Fusion, 65, 95-107.
[2]. Vijh, M., Chandola, D., Tikkiwal, V. A. and Kumar, A. (2020) Stock closing price prediction using machine learning techniques. Procedia computer science, 167, 599-606.
[3]. Cervelló-Royo, R. and Guijarro, F. (2020) Forecasting stock market trend: A comparison of machine learning algorithms. Finance, Markets and Valuation, 6(1), 37-49.
[4]. Singh, G. (2022) Machine learning models in stock market prediction. Working paper.
[5]. Cosenza, D. N., et al. (2021) Comparison of linear regression, k-nearest neighbour and random forest methods in airborne laser-scanning-based prediction of growing stock. Forestry: An International Journal of Forest Research, 94(2), 311-323.
[6]. Kalyoncu, S., Jamil, A., Rasheed, J., Yesiltepe, M. and Djeddi, C. (2020) Machine learning methods for stock market analysis. In 3rd International Conference on Data Science and Applications (ICONDATA).
[7]. Madeeh, O. D. and Abdullah, H. S. (2021) An efficient prediction model based on machine learning techniques for prediction of the stock market. In Journal of Physics: Conference Series, 1804.
[8]. Alshara, M. A. (2022) Stock Forecasting Using Prophet vs. LSTM Model Applying Time-Series Prediction. IJCSNS, 22(2), 185.
[9]. Ding, G. and Qin, L. (2020) Study on the prediction of stock price based on the associated network model of LSTM. International Journal of Machine Learning and Cybernetics, 11, 1307-1317.
[10]. Pramod, B. S. and Pm, M. S. (2020) Stock price prediction using LSTM. Test Engineering and Management, 83, 5246-5251.
Cite this article
Li,S. (2024). Comparison of Machine Learning Models for Stock Prediction. Advances in Economics, Management and Political Sciences,85,76-84.
Data availability
The datasets used and/or analyzed during the current study will be available from the authors upon reasonable request.
Disclaimer/Publisher's Note
The statements, opinions and data contained in all publications are solely those of the individual author(s) and contributor(s) and not of EWA Publishing and/or the editor(s). EWA Publishing and/or the editor(s) disclaim responsibility for any injury to people or property resulting from any ideas, methods, instructions or products referred to in the content.
About volume
Volume title: Proceedings of the 2nd International Conference on Management Research and Economic Development
© 2024 by the author(s). Licensee EWA Publishing, Oxford, UK. This article is an open access article distributed under the terms and
conditions of the Creative Commons Attribution (CC BY) license. Authors who
publish this series agree to the following terms:
1. Authors retain copyright and grant the series right of first publication with the work simultaneously licensed under a Creative Commons
Attribution License that allows others to share the work with an acknowledgment of the work's authorship and initial publication in this
series.
2. Authors are able to enter into separate, additional contractual arrangements for the non-exclusive distribution of the series's published
version of the work (e.g., post it to an institutional repository or publish it in a book), with an acknowledgment of its initial
publication in this series.
3. Authors are permitted and encouraged to post their work online (e.g., in institutional repositories or on their website) prior to and
during the submission process, as it can lead to productive exchanges, as well as earlier and greater citation of published work (See
Open access policy for details).
References
[1]. Thakkar, A. and Chaudhari, K. (2021) Fusion in stock market prediction: a decade survey on the necessity, recent developments, and potential future directions. Information Fusion, 65, 95-107.
[2]. Vijh, M., Chandola, D., Tikkiwal, V. A. and Kumar, A. (2020) Stock closing price prediction using machine learning techniques. Procedia computer science, 167, 599-606.
[3]. Cervelló-Royo, R. and Guijarro, F. (2020) Forecasting stock market trend: A comparison of machine learning algorithms. Finance, Markets and Valuation, 6(1), 37-49.
[4]. Singh, G. (2022) Machine learning models in stock market prediction. Working paper.
[5]. Cosenza, D. N., et al. (2021) Comparison of linear regression, k-nearest neighbour and random forest methods in airborne laser-scanning-based prediction of growing stock. Forestry: An International Journal of Forest Research, 94(2), 311-323.
[6]. Kalyoncu, S., Jamil, A., Rasheed, J., Yesiltepe, M. and Djeddi, C. (2020) Machine learning methods for stock market analysis. In 3rd International Conference on Data Science and Applications (ICONDATA).
[7]. Madeeh, O. D. and Abdullah, H. S. (2021) An efficient prediction model based on machine learning techniques for prediction of the stock market. In Journal of Physics: Conference Series, 1804.
[8]. Alshara, M. A. (2022) Stock Forecasting Using Prophet vs. LSTM Model Applying Time-Series Prediction. IJCSNS, 22(2), 185.
[9]. Ding, G. and Qin, L. (2020) Study on the prediction of stock price based on the associated network model of LSTM. International Journal of Machine Learning and Cybernetics, 11, 1307-1317.
[10]. Pramod, B. S. and Pm, M. S. (2020) Stock price prediction using LSTM. Test Engineering and Management, 83, 5246-5251.