


1. Introduction
The background of this research is the wide application of option deals in the financial market. This passage realized that the point from the previous work [1, 2]. It is crucial for risk management and price setting that predicts the change of option price by forecasting the implied volatilities of American options because it reflects the variation of market price whether it dilates or diminishes. As noticed, there are limitations when one uses traditional setting methods because of the complexity and uncertainty of options, traditional pricing models like the R language are arduous to accurately predicts option implied volatility in the previous work [3], so machine learning methods are needed to improve the accuracy and robustness of prediction. This study will make use of the ability of machine learning models to predict the American implied volatilities based on an understanding of financial markets and confidence in machine learning techniques, which is enlightened by Culkin and Das [4]. By dealing with the enormous database and pre-process the dataset, the building an accurate prediction model, investors and traders like companies and enterprises can better attach importance to market expectations and risks, so as to make more informed investment decisions, profiting more and avoiding much loss.
In the original work of [5], one can acknowledge that options are security that helps owners to have the right when trading a fixed number of specific ordinary shares at a fixed price to buy or sell at a specific stage or time rather than right now. Also, they put forward the model called Black-Scholes to deal with the complicated model to forecasting the change of options and option pricing setting problems [6]. It indeed solved the problem of the necessity to use complicated model to help with option pricing matters rather than simple formula used now and enhanced the performance of the model. However, there are still some limitations with the models in previous study [7, 8]. First, it just can be applied in European options, not American options or any other complex types of options. What’s more, the Black-Sholes model is based on a polynomial growth model and assumes that the log return on stock prices is normally distributed and that stock prices vary continuously in continuous time. However, stock price changes in the actual market often do not conform to the normal distribution, and there are jump price changes, which may lead to the Black-Sholes model is not accurate enough to describe the market. Therefore, this study uses statistical metrics and machine learning model called random forest model and linear regression model to describe and run the results to forecast the variation of financial market, which are showed in methodology.
2. Data and Method
This study uses random forest model to predict implied volatility rate of American options for several reasons and use linear regression to verify the R-Squared and Mean Absolute Percentage Error. Random Forest Regressor is a kind of ensemble learning method, which consist of by scores of decision trees building multiple decision trees, selecting the features randomly and combining their results, the prediction performance and generalization ability of the model are enhanced [9, 10]. Random Forest Model can capture nonlinear relationship between option pricing and volatility rate of market effectively and performs well dealing with the database which have high complicated relation. Also, it can enhance the ability of nonlinear relationship modeling, resisting overfitting and feature importance evaluation, therefore it is adaptive to variations of models. Besides, it can handle a large number of input variables without feature scaling of data, and can automatically handle missing values. At the same time, Random Forests can provide feature importance assessments to help us understand how much each feature in the data influences the results.
2.1. Data
In this part, the main discussed topic is the data of implied volatility of American option from Option Flow in options in BarChart.com. X, the features is selected for several reasons. First, they should have a high correlation with target variable Y (American Implied Volatility) to have a better understand with the final prediction. Second, select the features which can be the factors to impact the volatility like option price, strike price, expiration time, volume, open interest and Delta value. Third, the features in the database are intact. Also, there won’t be a lot of errors to adapt to the models. Forth, these features are chosen by professional knowledge and experience before. Therefore, one selects some features to establish a predicting model for the implied volatility of American options (Y). For the train set and test set, one splits them into 80% of the data for train set and 20 % of the data for test set, which ensures the distribution of the data is resemble to evaluate the model more accurate. Besides, in order to observing how many quantities of features is the best, this study uses Principal Component Analysis (PCA) to diminish the overlapping part of two different features and also reserve the most crucial information in the data. And to establish a stable model which owns generalization ability, one selects to use data flushing to deal with the noise, outlier, and missing value by integrating multi-tree to minish the variance of models effectively, self-sampling to decrease the overfitting risk and feature importance techniques to enhance the stability of models. Using this method, it indicates that having six components are the best number of the model, because the cumulative variance contribution rate is almost 100%.
2.2. Models and Statistical Metrics
This study uses two models to forecast the implied volatility of American options which are Random Forest Model and Linear regression Model. Within the models, Random Forest Model is mainly used to apply to de prediction of the option pricing, and Linear Regression Model is used as benchmark to verify the accuracy of the performance of Random Forest Model. Among the models, the equation of Linear Regression is:
\( \hat{y} \) = \( {β_{0}}+{β_{1}}{{x_{1 }}+β_{2 }}{x_{2}}+…+{β_{n}}{x_{n}} \) (1)
Here, \( \hat{y} \) is the predicted value of the model, \( {β_{0}} \) is the intercept, \( {β_{1}} \) , \( {β_{2 }} \) , … \( {β_{n}} \) are the features \( {x_{1}} \) , \( {x_{2}}, \) … \( {,x_{n}} \) s’ coefficient, \( {x_{1 }} \) , \( {x_{2}} \) ,… , \( {,x_{n}} \) are the features of model. Finally, one selects the error to verify if the model performs well by testing the R-squared, which is an excellent metric when measuring the regression model’s goodness of fit and Mean Absolute Percentage Error (MAPE), which is a fabulous metric to measure the accuracy of forecasting model. The formula of R-Squared is:
\( {R^{2}} \) =1− \( \frac{\sum i{({\hat{y}_{i}}-{y_{i}})^{2}}}{\sum _{i=1}^{n}({y_{i}}-{\overline{y}_{i}})} \) (2)
The formula of MAPE is:
MAPE= \( \frac{100\%}{n}\sum _{i=1}^{n}|\frac{{\hat{y}_{i}}-{y_{i}}}{{y_{i}}}| \) (3)
3. Results and Discussion
The results of the prediction of models are below. Throughout this process, one rinses and processes the data. Additionally, after generating the Figures of the final result by using default parameters, this study will evaluate the model and optimize it from several aspects which are acknowledged in method part. Finally, one finds the best parameters for the model and the data: the max depth of trees is 6, the best estimator is 100 and the minimum samples split is 2. Then, Fig. 1 illustrates the correlation between every feature and target (implied volatility of American options) when the parameters are default, which is called feature engineering part. Price~, Volume and Open Int columns have no conspicuous relationship with IV, and column Strike shows a nonlinear relation with IV. Expect from these, there seems to be a tendency for IV values to be more concentrated at maturities with shorter time to maturity (DTE), but more widely distributed at longer maturities. That’s a great percentage for these data to be used in the Random Forest Regressor to forecast.
Then, Fig. 2 and Fig. 3 generate the prediction value and actual value, if the points are close even overlapping with the line, it means this is an accurate forecasting. Most of the points are close to the diagonal line and just few of points are isolated compared to Linear Regression (like the two scores, their vertical distance of Predicted Implied Volatility is almost 150, which means the results (Actual Implied Volatility) by using Random Forest Regressor is more fabulous. For the same sample, the results in linear regression are worse because the points are more distant than what Random Forest Model runs, so by contrast the benchmark linear regression, one can easily find Random Forest Model is better predicted.
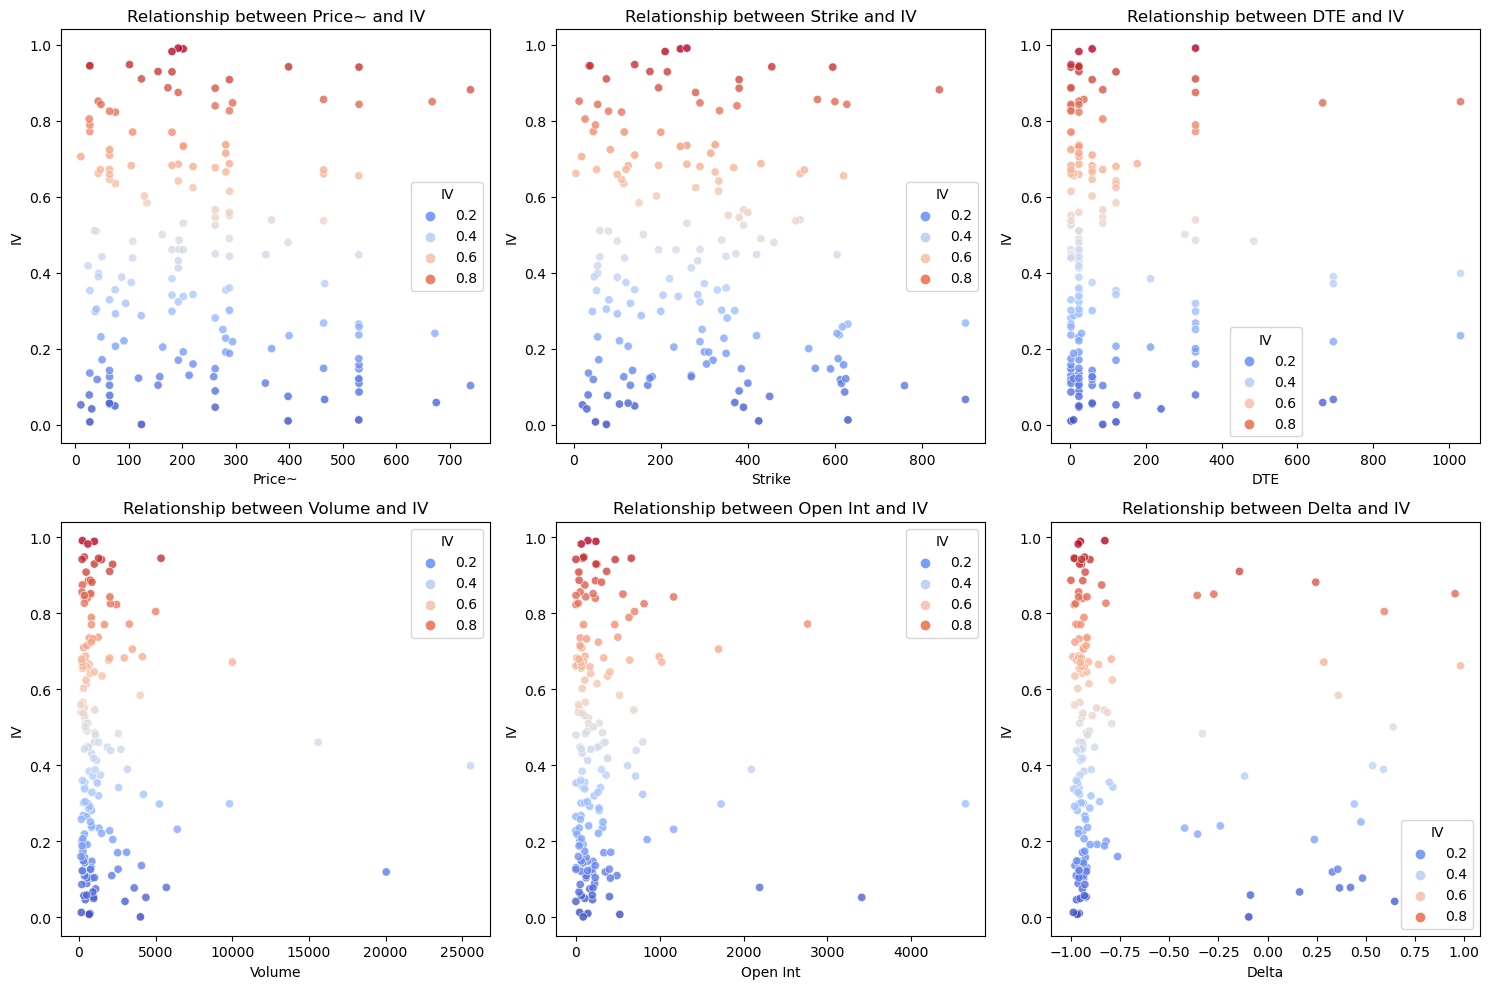
Figure 1: Correlations between features and target (Picture credit: Original).
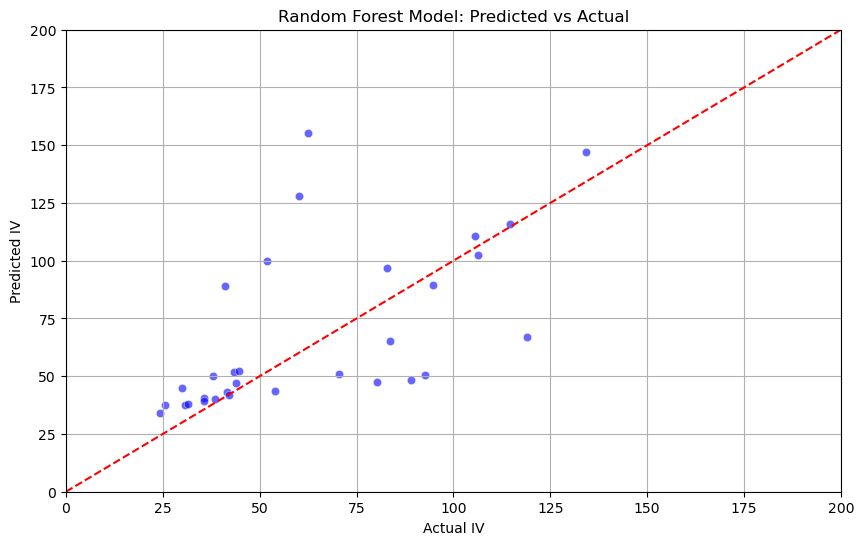
Figure 2: Forecasting value by Random Forest (Picture credit: Original).
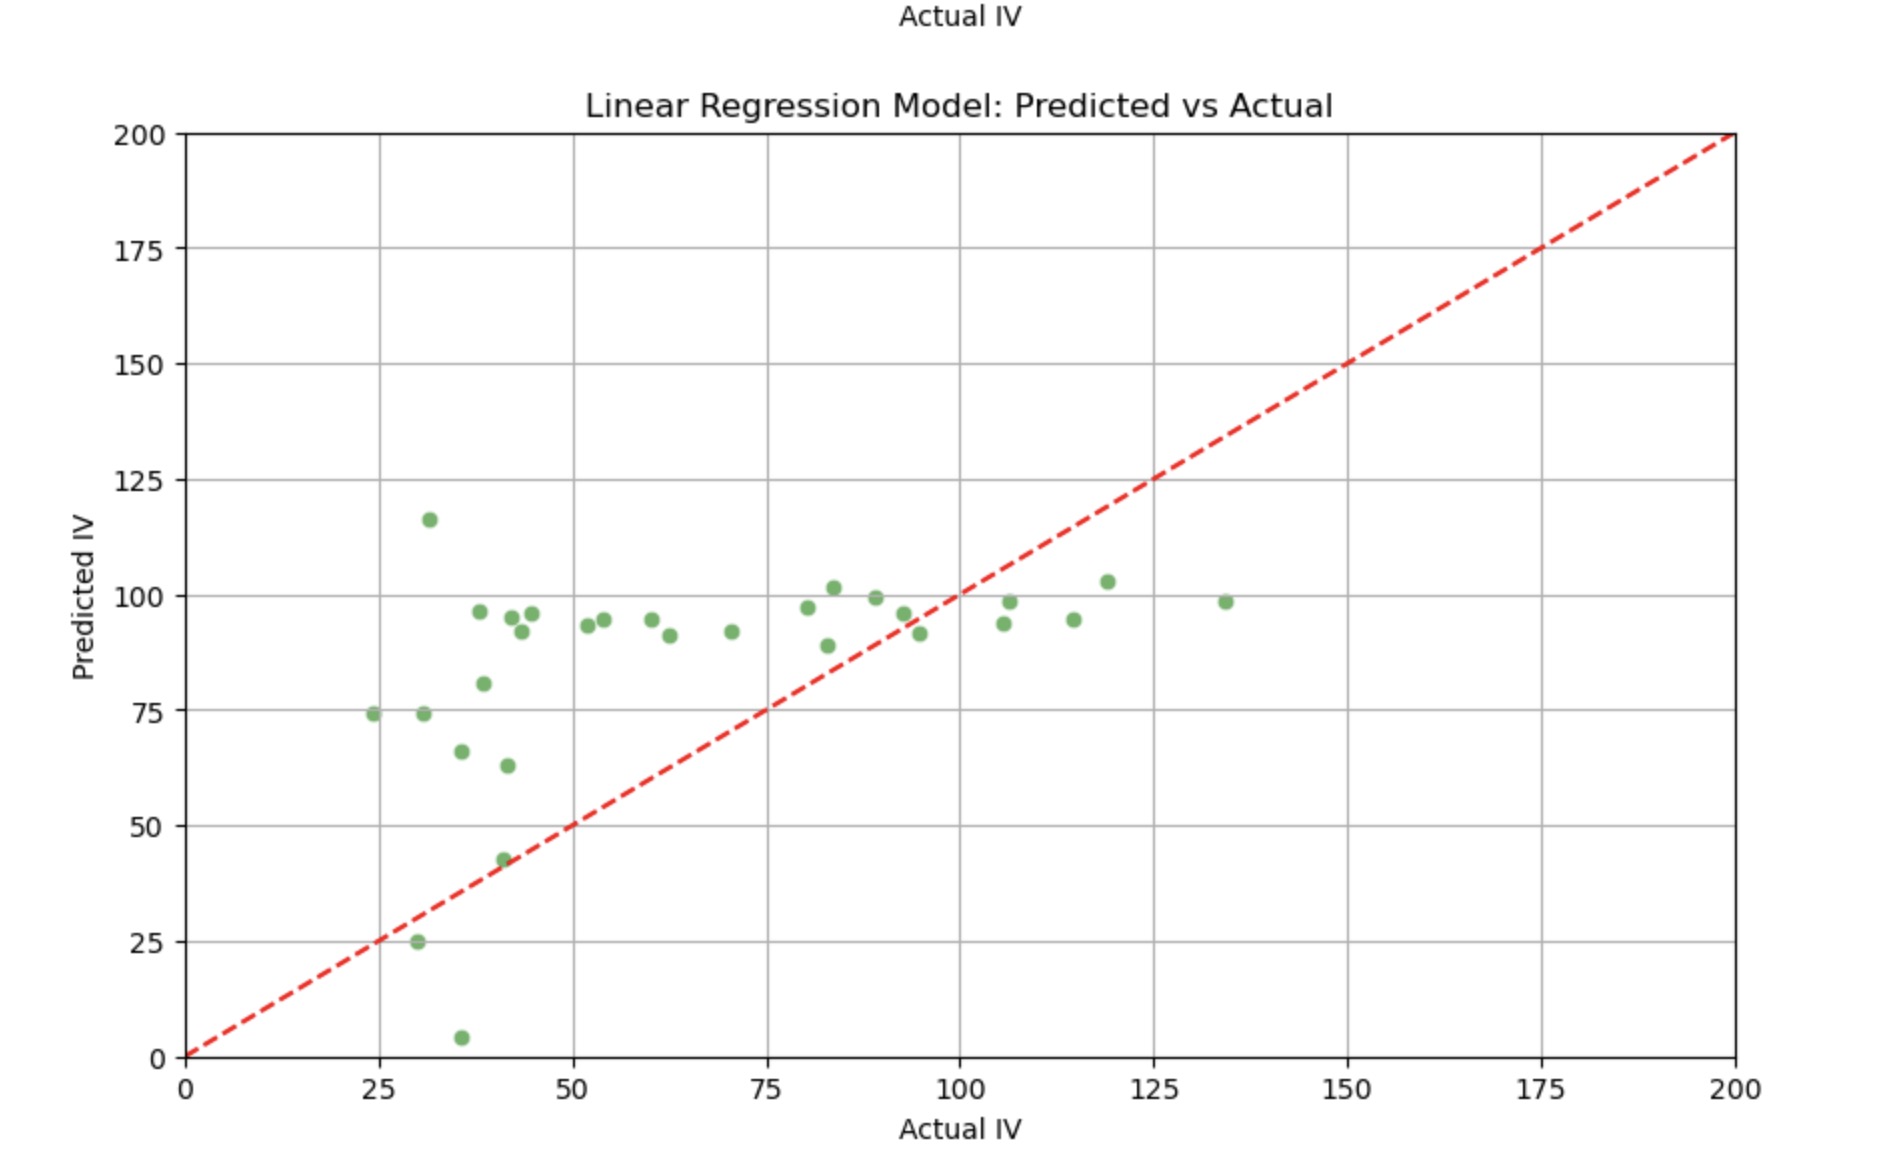
Figure 3: Forecasting value by Linear Regression (Picture credit: Original).
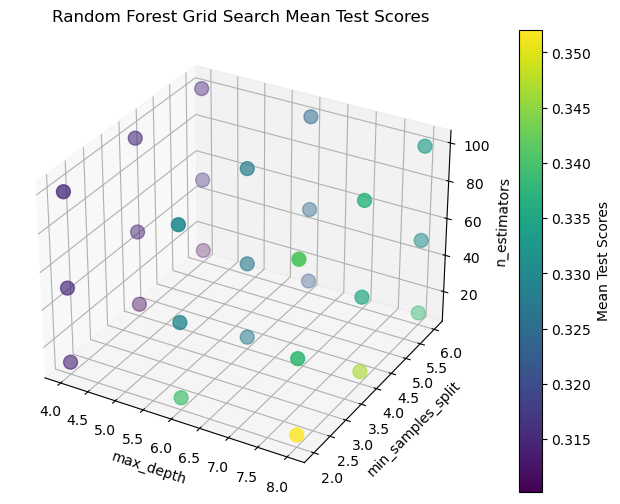
Figure 4: Searching for the best parameters (Picture credit: Original).
After having the basic default value of the prediction, the part moves to evaluate and optimize the model. Fig. 4 shows us the different distribution of the parameters by a 3-dimensional graph. X label represents the max depth, as the maximum depth increases, the complexity of the model increases. And Y label is min sample split, A higher value means that the tree will have fewer branches, while a lower value will increase the branches of the tree. Last, Z label symbols the number of estimators. The result shows the range between 10 and 100, which means that as the number of estimators rise, it also dilates the complexity of the model but the same time increases models’ robustness. Combining with the graph on the right side, it is easily to notice the darker the color is, the less mean test score is. It is necessary to find out the darkest place, in other words, owns the best parameter combination. In the meanwhile, observe the graph on the left side, by selecting the several dark purple points to adjust the parameters, finding that the best parameter is (6, 2, 100).
In Figure 5, it illustrates the relationship between predicted implied volatility and the actual IV and it is generated as a scatter plot to visualize. There are two groups of points in the plot and the blue points represent the true values and the red points represent the values predicted by the model. In the ideal case, the actual value and predicted value should be tightly spaced around a straight line. By using index as the subsequence, the prediction of every sample can be visualized clearly.
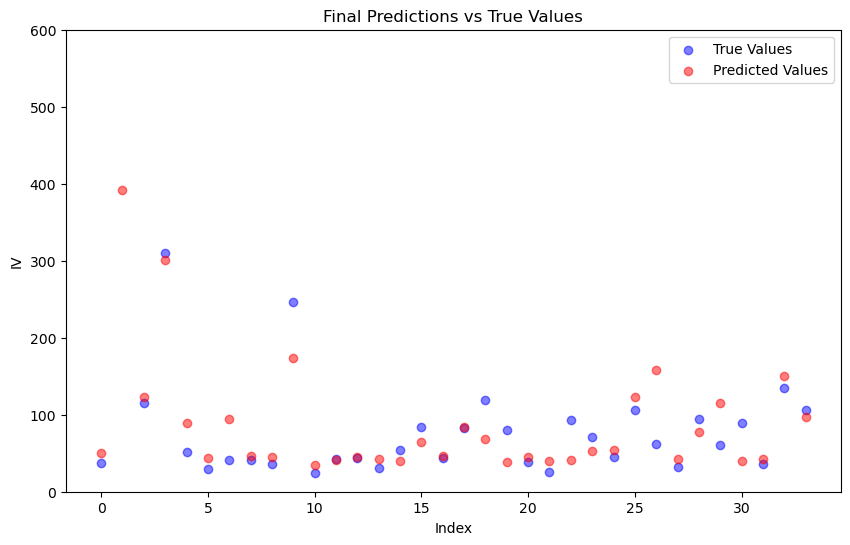
Figure 5: Final Prediction (Picture credit: Original).
Finally, the research uses \( {R^{2}} \) and MAPE to evaluate the performance of Random Forest Regressor and Linear Regression which is take as benchmark as presented in Table 1. As a result, \( {R^{2}} \) of Random Forest Model is 0.7796 and Linear Regression is 0.4613. Also, MAPE of Random Forest Model is 0.2477 and Linear Regression is 0.4027. The more enormous \( {R^{2}} \) is (between 0 -1), the more accurate the model and the smaller the value of MAPE is, the more accurate the model is. Therefore, the prediction of Random Forest which is more accurate is suitable to forecast the options’ implied volatility.
Table 1: Performances of different model.
Model | \( {R^{2}} \) | MAPE |
Random Forest Regressor | 0.7796 | 0.2477 |
Linear Regression | 0.4613 | 0.4027 |
4. Conclusion
Throughout the whole prediction process, Random Forest Model performs well when forecasting implied volatility of American options. Compared with the default value and graph, the Figure s and value after adjusting the parameter to the best ones indeed indicates better performance, which means the model gains better prediction result. R2 of Random Forest on test set is 0.7796 and MAPE is 0.2477, which are better than linear regression. Therefore, it shows that Random Forest Regressor can capture the implied volatility change rule of American option effectively. However,there are still some limitations of Random Forest Model. To start with, it is necessary to use scores of times to train and plenty of calculatable resources. Then, it may overfit the database, especially when there is just few of samples and high characteristic dimension. Expect from this, the model may be affected by noise and missing value, for example, if the data pre-processing (Data processing and cleaning process) is not prepared well, which leads that the database still contains missing value, the results will have no accuracy. In the future, one can take a look at other ensemble learning model like gradient lifting tree. To explore more and more different algorithms to promote the forecasting accuracy. What’s more, time series analysis and deep learning can also be applied to capture the dynamic feature to realize to grasp the dynamic prediction of American options.
References
[1]. Merton, R.C. (1973) Theory of rational option pricing. The Bell Journal of economics and management science, 141-183.
[2]. Cox, J. C., Ross, S. A. and Rubinstein, M. (1979) Option pricing: A simplified approach. Journal of financial Economics, 7(3), 229-263.
[3]. Ij, H. (2018) Statistics versus machine learning. Nat Methods, 15(4), 233.
[4]. Culkin, R. and Das, S.R. (2017). Machine learning in finance: the case of deep learning for option pricing. Journal of Investment Management, 15(4), 92-100.
[5]. Menger, K. and Menger, K. (2003) Statistical metrics. Selecta Mathematica: Volume 2, 433-435.
[6]. Capiński, M. and Kopp, E. (2012. The Black–Scholes Model. Cambridge University Press.
[7]. Janková, Z. (2018) Drawbacks and limitations of Black-Scholes model for options pricing. Journal of Financial Studies and Research, 2018, 1-7.
[8]. Teneng, D. (2011) Limitations of the Black-Scholes model. Collection of Papers, 1, 143.
[9]. Biau, G. and Scornet, E. (2016) A random forest guided tour. Test, 25, 197-227.
[10]. Liu, C., Chan, Y., Alam Kazmi, S.H. and Fu, H. (2015) Financial fraud detection model: Based on random forest. International journal of economics and finance, 7(7).
Cite this article
Liu,C. (2024). Implied Volatility Forecasting for American Options Based on Random Forest Regressor, Linear Regression Model. Advances in Economics, Management and Political Sciences,85,154-160.
Data availability
The datasets used and/or analyzed during the current study will be available from the authors upon reasonable request.
Disclaimer/Publisher's Note
The statements, opinions and data contained in all publications are solely those of the individual author(s) and contributor(s) and not of EWA Publishing and/or the editor(s). EWA Publishing and/or the editor(s) disclaim responsibility for any injury to people or property resulting from any ideas, methods, instructions or products referred to in the content.
About volume
Volume title: Proceedings of the 2nd International Conference on Management Research and Economic Development
© 2024 by the author(s). Licensee EWA Publishing, Oxford, UK. This article is an open access article distributed under the terms and
conditions of the Creative Commons Attribution (CC BY) license. Authors who
publish this series agree to the following terms:
1. Authors retain copyright and grant the series right of first publication with the work simultaneously licensed under a Creative Commons
Attribution License that allows others to share the work with an acknowledgment of the work's authorship and initial publication in this
series.
2. Authors are able to enter into separate, additional contractual arrangements for the non-exclusive distribution of the series's published
version of the work (e.g., post it to an institutional repository or publish it in a book), with an acknowledgment of its initial
publication in this series.
3. Authors are permitted and encouraged to post their work online (e.g., in institutional repositories or on their website) prior to and
during the submission process, as it can lead to productive exchanges, as well as earlier and greater citation of published work (See
Open access policy for details).
References
[1]. Merton, R.C. (1973) Theory of rational option pricing. The Bell Journal of economics and management science, 141-183.
[2]. Cox, J. C., Ross, S. A. and Rubinstein, M. (1979) Option pricing: A simplified approach. Journal of financial Economics, 7(3), 229-263.
[3]. Ij, H. (2018) Statistics versus machine learning. Nat Methods, 15(4), 233.
[4]. Culkin, R. and Das, S.R. (2017). Machine learning in finance: the case of deep learning for option pricing. Journal of Investment Management, 15(4), 92-100.
[5]. Menger, K. and Menger, K. (2003) Statistical metrics. Selecta Mathematica: Volume 2, 433-435.
[6]. Capiński, M. and Kopp, E. (2012. The Black–Scholes Model. Cambridge University Press.
[7]. Janková, Z. (2018) Drawbacks and limitations of Black-Scholes model for options pricing. Journal of Financial Studies and Research, 2018, 1-7.
[8]. Teneng, D. (2011) Limitations of the Black-Scholes model. Collection of Papers, 1, 143.
[9]. Biau, G. and Scornet, E. (2016) A random forest guided tour. Test, 25, 197-227.
[10]. Liu, C., Chan, Y., Alam Kazmi, S.H. and Fu, H. (2015) Financial fraud detection model: Based on random forest. International journal of economics and finance, 7(7).