


1.Introduction
According to previous studies, the occurrence of climate disasters, wars and epidemic events will have a negative impact on consumer sentiment and then on consumer consumption behavior, and the specific degree of impact is also affected by consumers' own adjustment ability and experience [1]. Luxury consumption itself is a kind of non-essential consumption, and the occurrence of the above adverse events will lead consumers to have a negative attitude towards their disposable wealth. The above adverse events themselves will also lead to a strain on the medical resources of the whole society. Most companies are implementing the strategy of reducing salaries and layoffs, and the market vitality is reduced. Unease, anxiety, and panic combined with the slumping economy have led to a sharp decline in luxury sales.
Taking LV, the most representative and influential brand in the world, it can be seen from the LV website that at the beginning of the outbreak of COVID-19, namely in 2020, the sales of LV beauty fragrance business dropped by 22% year-on-year to 5.48 billion Euros, and the profit of continuing business dropped by 88% year-on-year. Sales in the watch and jewelry division fell 24 percent from a year earlier. Sales in the fashion leather goods division fell just 3 per cent to €21.1bn. This is because economic crises are often affected by psychological and social behaviors. The economic and financial crisis has led to consumers spending less and becoming more sensitive to prices. At the same time, during the pandemic, consumers also put personal safety and convenience first. In a study by Marcos Ceron B,through multivariate cointegration model analysis, it is found that the increase of consumer sentiment will lead to the growth of 3.6% in the luxury industry [2]. The stock price of luxury brands is directly linked to the sales volume. Fan's research also shows that since emotional and psychological factors tend to play a higher role in consumers' decision-making process of purchasing goods with high price elasticity (luxury goods), traditional linear regression models do not perform well in this special period after the outbreak of the epidemic [3].
The sales of luxury goods decreased, most of LV's stores were closed during the epidemic, and the profits of LV decreased. Naturally, the shareholders did not look forward to the development of the company, which led to the drastic fluctuation of stock prices and the steady rise of the stock prices before the epidemic.
The motivation to use epideictic related information such as daily new cases, daily recovery number during the epidemic or epideictic related news to increase the accuracy of stock prediction models comes from consumer psychology. In the paper by Sneath, Lacey and Kennett, it is known that there is a relationship between a person's sense of control over time and purchasing behavior [4]. Consumers feel less in control of their health during the pandemic, and their finances are further damaged. Perhaps consumers need to re-establish the order of inner imbalance through purchasing this way, or they may be cutting back on discretionary spending because of financial pressure. Among the factors affecting the stock price of luxury goods, consumer behavior is a small part of the influence on investor behavior. The pressure from the epidemic is also exerted on the luxury goods industry by the import and export policies of various countries.
In Fernandes’s research, as of March 22, 2020, the impact of the covid-19 pandemic on the world economy can be seen. Most stock markets crashed and saw their biggest single-day declines ever, with some well-known share prices topping 80% in a matter of days [5].
So far, humans have experienced several acute outbreaks (e.g., SARS, Ebola). In today's globalized world, it has been shown that the occurrence rate of infectious diseases due to environmental changes caused by human activities increased significantly between 1940 and 2000 [6]. Other models suggest that a threefold increase in the incidence of an infectious disease can lead to a threefold increase in the probability of an extreme pandemic, as exemplified by a reduction in the average return interval to 292 years for events such as the Spanish flu [6]. Traditional machine learning models require the input of historical data over a long period of time as the training set, and some traditional machine learning models also require the stationarity of time series. However, in practice, due to the strong volatility and unpredictability of the market during the epidemic, the time series of stock prices usually have unit root. That is, the time series does not have traditional statistical significance. The robustness and flexibility of machine learning models should also be considered when building them.
2.Data and Method
The dataset for the early days of the pandemic comes from Kaggle. The features are listed as follows: ConfirmedDeaths, Recovered Active, New cases, New deaths, New recovered. Deaths / 100 Cases, Recovered / 100 Cases, Deaths / 100, Recovered No. of countries. The historical stock price and vix index data of LV were also obtained from the website of Yingwei Financial Information for further exploration and research. The main objective of the research is to determine whether a precise range of stock prices can be predicted from available data at an early stage of the development of an infectious disease through the application of machine learning. In the exploration of the original data, after data cleaning and data preprocessing, the correlation between each feature value and the stock price has been calculated. Lags of one to seven days were created to take lagged characteristics of market sentiment into account. However, after principal component analysis and calculation of correlation coefficient, it is found that the lag characteristics do not have greater correlation than the original data in the stock closing price, which may be because the time series caused by the sharp increase in the volatility of stock prices in the early outbreak of the epidemic is close to a random walk. After the ADF unit root test of stock price and vix data, it is found that the two-time series have unit root, that is, the time series show some instability. HaKan 's research has long shown that the results of SVAR model analysis: the Covid-19 epidemic has a negative impact on the S&P 500 index, which can be shown as follows: A 1% increase in the daily cumulative covid-19 cases in the United States will lead to a cumulative decline of about 0.01% in the S&P 500 index after a day and 0.03% after a week [7]. This is also confirmed in principal component analysis. New cases can account for 0.94 of the principal components, and its explanatory variance is much higher than that of other principal components. In the calculation of the correlation coefficient, the vix index also shows a correlation of -0.84 with the closing price of the stock, which indicates that the mood of the investors is about panic, and the stock price may be correspondingly lower. After the difference between stock price and vix index, the correlation coefficient reaches -0.56, which proves that the index can indeed affect the further trend of stock price.
3.Results and Discussion
Linear regression is the most traditional supervised machine learning model. It is used as a static technique for predicting the relationship between dependent and independent variables. This study uses the least squares method to estimate the coefficients. The best coefficient value is determined by minimizing the sum of squared residuals between the observed and model-predicted values. In the process of model building, in order to explore whether there is a lag in the impact of historical stock prices on stock price prediction, this study expanded the dataset to use lv stock prices from 2006 to January 2020 as the training set to predict the stock prices from January to July 2020 (that is, the early outbreak stage of the pandemic), and created different lag features. The results are shown in Fig. 1 that the model based on the previous day's stocks performs better in terms of both MSE error and R-squared error.
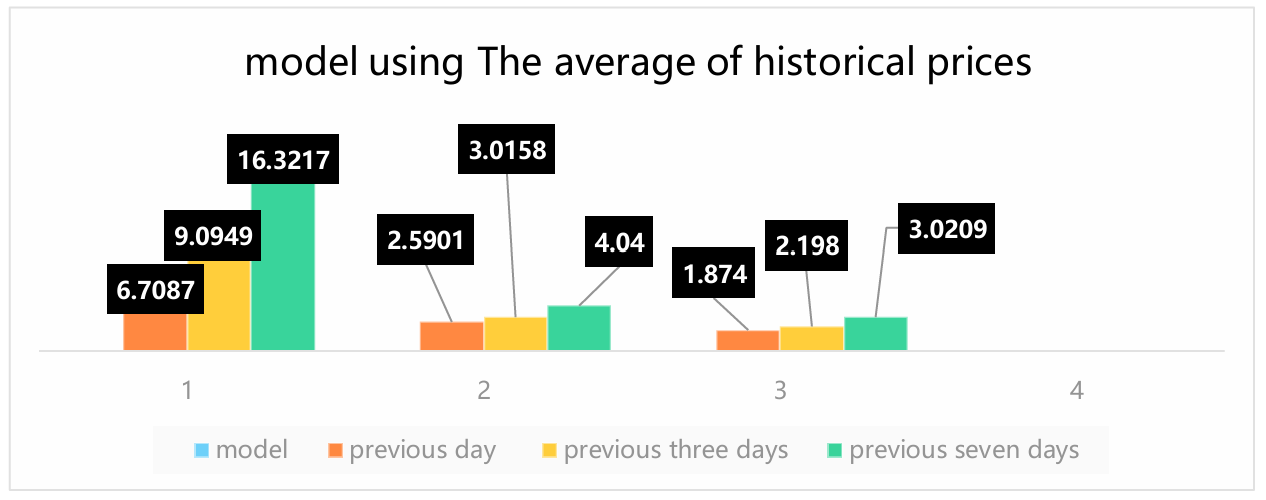
Figure 1: linear regression model with different Lag characteristic (Photo/Picture credit: Original).
Linear regression models assume that there is a linear relationship between the independent variable and the dependent variable, which may limit the ability of the model to fit. To capture more flexible nonlinear relationships, random forest models are subsequently considered. When establishing a linear regression model, scholars often worry about the emergence of outliers, because the factors affecting stock prices during the epidemic period are very complex and diverse. For example, Fan's research has shown that the capital market decisions and the government's macroeconomic regulation will directly affect the trend of stocks. In their research, the error of the linear model has been as high as 80% [8]. When the decision tree is selected for stock prediction, it is easy to overfitting, and it is necessary to accurately control the depth of the decision tree. The random forest improves the bagging tree, which can further reduce the variance of the model by randomly sampling the samples and features.
Objective = Loss + Regularization is the objective function of XGBoost. This algorithm adds a regularization function to control whether the model has a tendency to overfit while ensuring accuracy. The advantage of this model is that based on the decision tree, the gradient boosting method is used to further train the decision tree model, and a decision tree is trained according to the residual value of the true value and the predicted result to fit these errors and finally obtain the cumulative result. The comparison results are shown in Fig. 2 and Fig. 3. Due to the non-stationary time series of new cases and stock closing prices, the model optimization adopts the GridSearchCV function to create a grid search object, and specifies XGBoost as the basic model, specifies fivefold cross validation, and finally uses the mean square error as the scoring index. The model uses a nested loop to combine the lag features of new cases and stock closing price one by one and perform a grid search under each combination. For each set of features, the corresponding feature variable is selected from the training set and the grid search is performed by calling the fit function in the grid search. Finally, the data with two features lagging two days respectively performs better on the XGBoost model. The loss function and regularization parameter are also tuned by cross-grid search. In Yun's study, the authors optimized the feature engineering aspect of XGBoost algorithm through GA algorithm combined with XGBoost. By simulating the 'survival of the fittest' principle in natural selection, the near-optimal solution is found in the multi-dimensional and large-scale search space [9]. In other research, the Bayesian algorithm is also combined to optimize the parameter combination, so that the model has better approximation ability and generalization ability [10]. The appropriate combination of features and parameters can make XGBoost have better performance in stock prediction, which is also the direction of improvement and optimization in this study in the future.
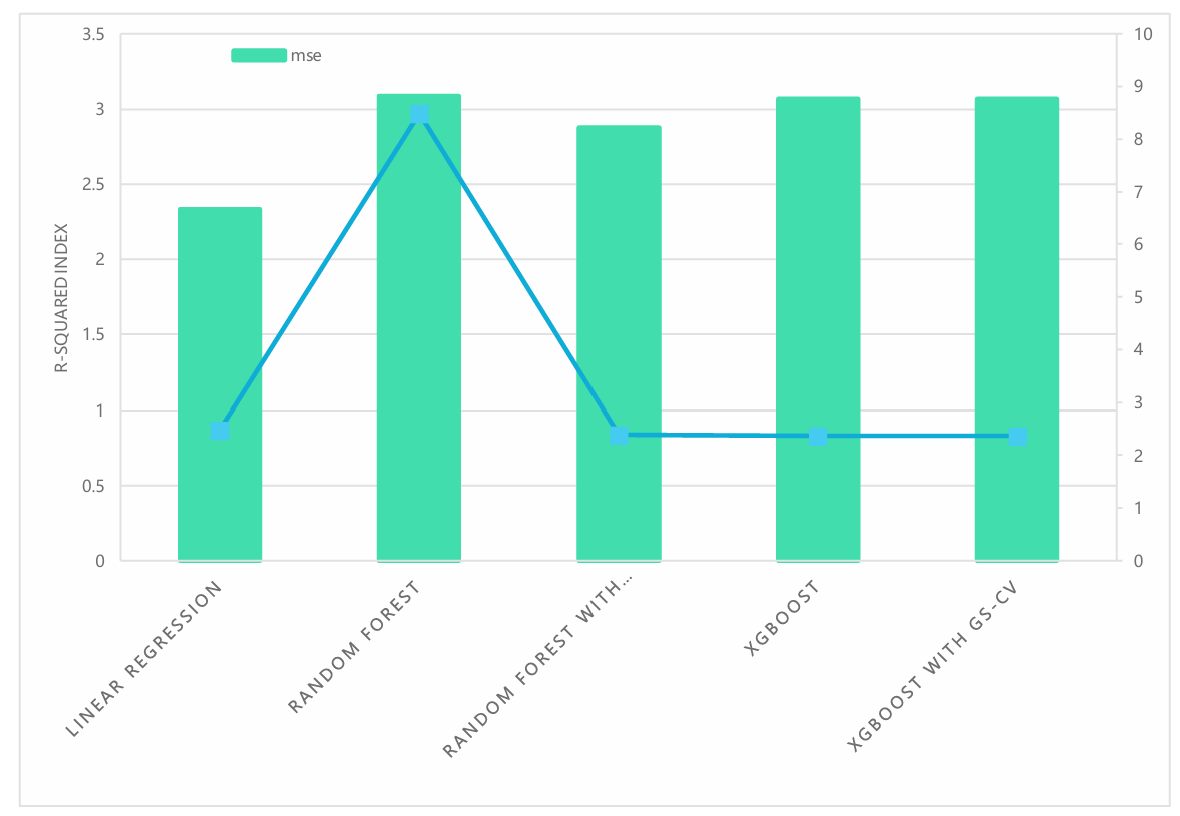
Figure 2: Error analysis of the prediction model (Photo/Picture credit: Original).
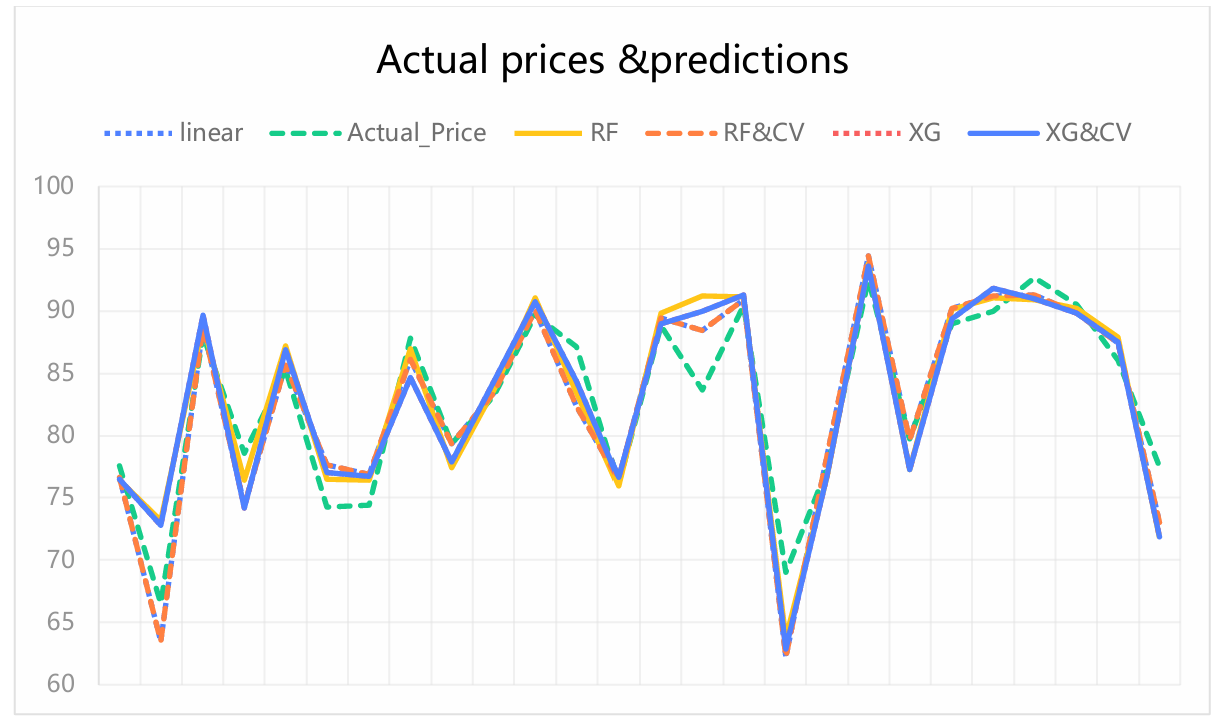
Figure 3: Comparison of predicted and true values (Photo/Picture credit: Original)
4.Conclusion
The most relevant feature of the epidemic situation to the stock price prediction model is new cases, which also reflects the conclusion that market sentiment affects stock prices by affecting the behavior of shareholders and consumers. In the short-term data set, linear regression model, random forest, and XGBoost all have good performance, and the mean square error of stock prices is controlled within a very small range. Although the mean square error of random forest model is relatively large at the beginning, it has a better performance in terms of stock price trend after the parameter tuning of grid search, and can predict the trend of volatility more accurately. Since the performance of the capital market directly affects the stock market, the impact of special events on stock prices should also be considered in the construction of stock prediction models. For example, a series of rescue policy tools of the Federal Reserve during the dollar shortage in early 2020 will certainly have a significant impact on the capital market. Focusing on special events and the stability of the capital market combined with the sentiment analysis of investors can further optimize the application of machine learning in stock prediction.
References
[1]. Sneath, J.Z., Lacey, R. and Kennett-Hensel, P.A. (2009) Coping with a natural disaster: Losses, emotions, and impulsive and compulsive buying. Marketing letters, 20, 45-60.
[2]. Marcos Ceron, B. and Monge, M. (2023) Consumer sentiment and luxury behavior in the United States before and after COVID-19: time trends and persistence analysis. Mathematics, 11(16), 3612.
[3]. Fan, Z. (2022) Prediction and Analysis of the Impact of Covid-19 on Luxury Goods Stock Prices. In 2022 2nd International Conference on Economic Development and Business Culture (ICEDBC 2022) Atlantis Press, 551-557.
[4]. Sneath, J.Z., Lacey, R. and Kennett-Hensel, P.A. (2009) Coping with a natural disaster: Losses, emotions, and impulsive and compulsive buying. Market Letters, 20, 45–60.
[5]. Fernandes, N. (2020) Economic effects of coronavirus outbreak (COVID-19) on the world economy, 1.
[6]. Marani, M., Katul, G.G., Pan, W.K. and Parolari, A.J. (2021) Intensity and frequency of extreme novel epidemics. Proceedings of the National Academy of Sciences, 118(35), e2105482118.
[7]. Yilmazkuday, H. (2023) COVID-19 effects on the S&P 500 index. Applied Economics Letters, 30(1), 7-13.
[8]. Nivoix, S. and Rey, S. (2020) Covid-19: Stock Market Responses. In Covid-19 and International Business, 125-13.
[9]. Yun, K.K., Yoon, S.W. and Won, D. (2021) Prediction of stock price direction using a hybrid GA-XGBoost algorithm with a three-stage feature engineering process. Expert Systems with Applications, 186, 115716.
[10]. Vuong, P.H., Dat, T.T., Mai, T.K. and Uyen, P.H. (2022) Stock-price forecasting based on XGBoost and LSTM. Computer Systems Science & Engineering, 40, 1.
Cite this article
Zhao,Y. (2024). Analysis of LV Stocks Based on Linear Regression, Random Forest and XGBoost. Advances in Economics, Management and Political Sciences,88,25-30.
Data availability
The datasets used and/or analyzed during the current study will be available from the authors upon reasonable request.
Disclaimer/Publisher's Note
The statements, opinions and data contained in all publications are solely those of the individual author(s) and contributor(s) and not of EWA Publishing and/or the editor(s). EWA Publishing and/or the editor(s) disclaim responsibility for any injury to people or property resulting from any ideas, methods, instructions or products referred to in the content.
About volume
Volume title: Proceedings of the 2nd International Conference on Management Research and Economic Development
© 2024 by the author(s). Licensee EWA Publishing, Oxford, UK. This article is an open access article distributed under the terms and
conditions of the Creative Commons Attribution (CC BY) license. Authors who
publish this series agree to the following terms:
1. Authors retain copyright and grant the series right of first publication with the work simultaneously licensed under a Creative Commons
Attribution License that allows others to share the work with an acknowledgment of the work's authorship and initial publication in this
series.
2. Authors are able to enter into separate, additional contractual arrangements for the non-exclusive distribution of the series's published
version of the work (e.g., post it to an institutional repository or publish it in a book), with an acknowledgment of its initial
publication in this series.
3. Authors are permitted and encouraged to post their work online (e.g., in institutional repositories or on their website) prior to and
during the submission process, as it can lead to productive exchanges, as well as earlier and greater citation of published work (See
Open access policy for details).
References
[1]. Sneath, J.Z., Lacey, R. and Kennett-Hensel, P.A. (2009) Coping with a natural disaster: Losses, emotions, and impulsive and compulsive buying. Marketing letters, 20, 45-60.
[2]. Marcos Ceron, B. and Monge, M. (2023) Consumer sentiment and luxury behavior in the United States before and after COVID-19: time trends and persistence analysis. Mathematics, 11(16), 3612.
[3]. Fan, Z. (2022) Prediction and Analysis of the Impact of Covid-19 on Luxury Goods Stock Prices. In 2022 2nd International Conference on Economic Development and Business Culture (ICEDBC 2022) Atlantis Press, 551-557.
[4]. Sneath, J.Z., Lacey, R. and Kennett-Hensel, P.A. (2009) Coping with a natural disaster: Losses, emotions, and impulsive and compulsive buying. Market Letters, 20, 45–60.
[5]. Fernandes, N. (2020) Economic effects of coronavirus outbreak (COVID-19) on the world economy, 1.
[6]. Marani, M., Katul, G.G., Pan, W.K. and Parolari, A.J. (2021) Intensity and frequency of extreme novel epidemics. Proceedings of the National Academy of Sciences, 118(35), e2105482118.
[7]. Yilmazkuday, H. (2023) COVID-19 effects on the S&P 500 index. Applied Economics Letters, 30(1), 7-13.
[8]. Nivoix, S. and Rey, S. (2020) Covid-19: Stock Market Responses. In Covid-19 and International Business, 125-13.
[9]. Yun, K.K., Yoon, S.W. and Won, D. (2021) Prediction of stock price direction using a hybrid GA-XGBoost algorithm with a three-stage feature engineering process. Expert Systems with Applications, 186, 115716.
[10]. Vuong, P.H., Dat, T.T., Mai, T.K. and Uyen, P.H. (2022) Stock-price forecasting based on XGBoost and LSTM. Computer Systems Science & Engineering, 40, 1.