1. Introduction
With the advancement of science, technology, and globalization, coffee, originally hailing from South America and beloved in Western culture, has gradually gained acceptance and popularity worldwide. Among all the companies in the coffee industry, Starbucks undoubtedly stands out as the most competitive player. The iterative upgrading of the consumer society has prompted companies to strive to establish emotional connections with consumers through personalized brand experiences. They not only hope to establish a good interactive relationship between consumers and brands, but also hope to enhance the brand's influence in the market [1]. Previous surveys and studies have identified certain factors influencing Starbucks' brand loyalty. However, they have not delved into which factors exert the greatest impact and the potential underlying reasons.
In this paper, the authors aim to utilize data collected from Starbucks customers to analyze the factors influencing customer loyalty within a specific coffee business and uncover any associated issues. The ultimate goal is to assist businesses in enhancing their sales strategies and products.
2. Literature Review
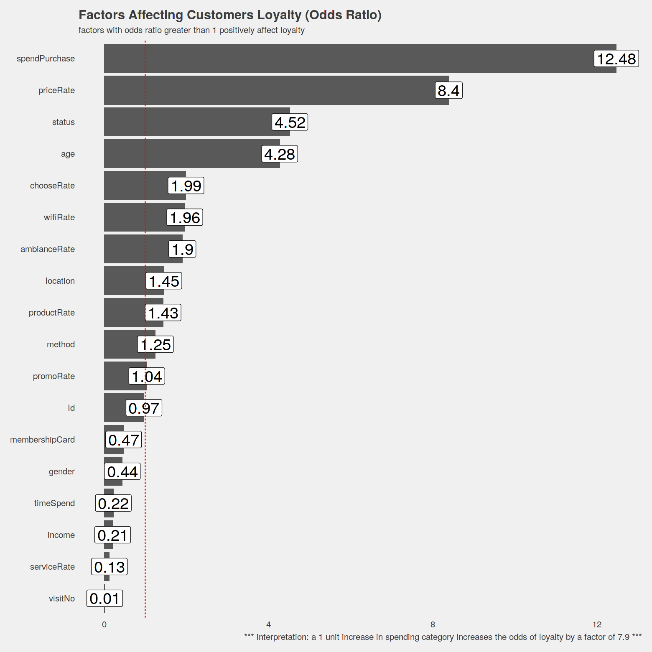
On the website of Kaggle, there are already articles making data analysis to detect the characteristic of a customer that will continue buying at Starbucks. Through the usage of p-value testing along with chi-square modeling, it has been concluded that spending and price rate are the major factor affecting customer retention, age and occupational status are also two factors that greatly affect the loyalty. The study uses a bar chart (see Figure 1) to show the influence rate of different influencing factors on the odds of loyalty. A unit increase in spending category will cause the rise of odds of loyalty of 12.48. Increasing the price rate unit will result in an increase in loyalty odds of 8.4. A unit increase in status and age will result in an increase in loyalty odds of 4.52 and 4.28 respectively. At the same time, it had been found that ambiance rating and service rating can also help reinforce Starbuck’s good brand image. While free Wi-Fi product variety can also enhance general brand image of Starbucks.

Figure1: Factors Affecting Customers Loyalty (Odds Ratio)
3. Methodology
The data set used for this study was collected through secondhand resources. The data set used for the study was collected through www.kaggle.com, and represent a survey done to over 100 respondents for their buying behavior at Starbucks in Malaysia. The content of the survey contains Demographic info about customers, their current behavior in buying Starbucks, and facilities and features of Starbucks that contribute to the behavior. In the research process, we have set up the “continue buying at Starbucks” (customer loyalty) as dependent factor, while considering selecting Gender, Income, Price rate, Money spent at Starbucks, Age and Status from the data set as independent factor for test. The Gender column has two categories: Male and Female. In the column of Income, there are five kinds of people: Less than RM25,000, RM25,000-RM50,000, RM50,000-RM100,000, RM100,000-RM150,000 and More than RM150,000. The Price rate has five levels, which represent the customer's rating of the price of Starbucks products to the price of different coffee brands, and the score is 1-5. In column Money spend at Starbucks, Zero, Less than RM20, Around RM20-RM40 and More than RM40 are involved. There are also five different data in the age column, which are Below 20, From 20 to 29, From 30 to 39 and 40 and above. In the column of Status, Student, Employed, Self-employed and Housewife.
We divide the customer's willingness to continue buying into 0 and 1. 0 means he will no longer buy Starbucks products, and 1 means they have the willing of continue buying.
We tested the independence of the qualitative variables in our dataset such as age, gender and status using the chi-square test of independence. Moreover, the relationship between loyalty and other qualitative and quantitative variable was evaluated by constructing a binary logistic regression model. (Figure 2).

Figure 2: chi-square test and Logical regression analysis
Then, we use the function:
odds_price_rate=exp(model_price_rate$coefficients)
odds_price_rate
to calculate the actual odds changes within one variable changes.
Finally, we superimposed these two factors and performed binary logistic regression fitting, then test the reliability of the model. We got the following results.
4. Results
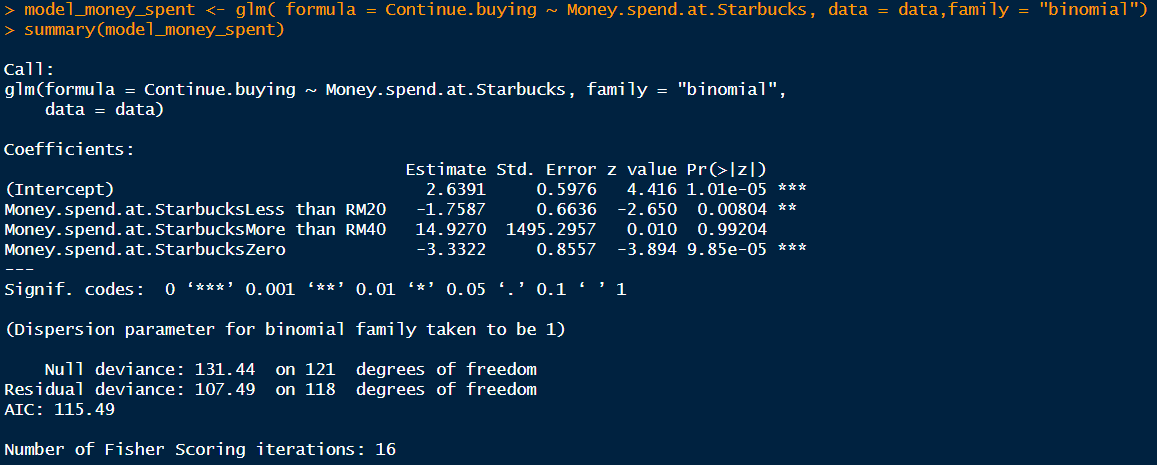
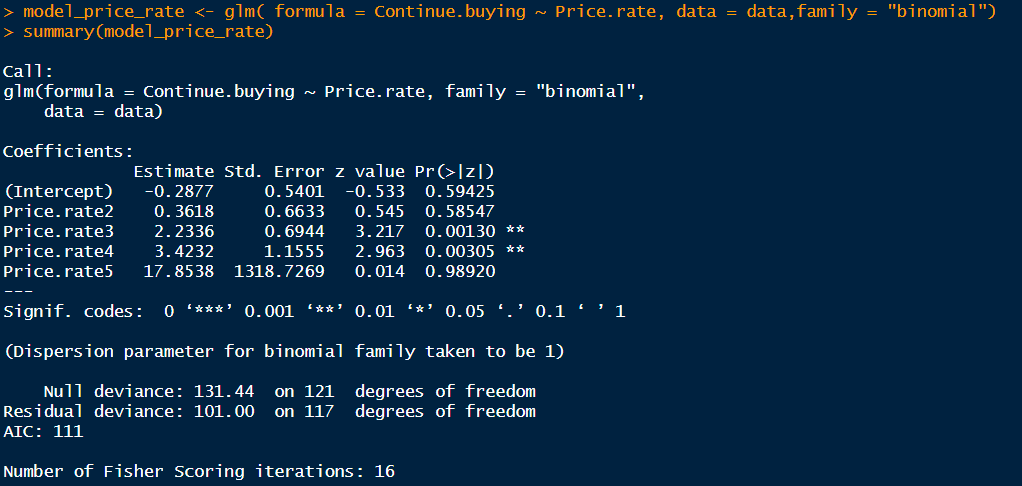
We concluded that Price rate and Money spent at Starbucks are statistically significant and have the highest coefficient, indicating how these two factors are important in influencing customer loyalty. The P-value are 3.797e-05 and 6.531e-06 respectively. The rest of the factors had all get a P-value that is higher than 0.05, showing their irrelevance with consumer loyalty. Afterward, we conducted the binary logistic regression model test on these two variables respectively for continuing buying. The results are in Figure 3 and Figure 4.

Figure 3: binary logistic regression model test of Money spend at Starbucks

Figure 4: Binary logistic regression model test of Price rate
Collect the above results into a tabular form into Table 1:
Table 1: Results in mentioned variables
Price rate | |||
Variables | Significancy | Coef | Odds |
1 | - | - | - |
2 | - | - | - |
3 | ** | 2.23 | 9.33 |
4 | ** | 3.42 | 30.67 |
5 | - | - | - |
Money spend at Strarbucks | |||
Variables | Significancy | Coef | Odds |
RM Zero | *** | -3.33 | 0.04 |
Less than RM20 | ** | -1.67 | 0.17 |
RM20-40 | *** | 2.64 | 14 |
Higher than RM40 | - | - | - |
Figure 5 shows how spending and price rate affect loyalty.
We changed the range of different spending each time into integers: RM Zero->0; Less than RM20->1; RM20-40->2; Higher than RM40->3, then we got the following diagram.
From the figure we can see that as the spending and the rating of the price increase, the loyalty will also get higher, eventually approaching to 1.
These two variables show a generalized linear regression model.

Figure 5: how spending and price rate affects loyalty.
After combining the two groups of variables with the dependent variable for binomial distribution fitting, we got the following results:(Figure 6)
From the fitted function, take Y>0.5 as the benchmark, take the value of Y>0.5 in the fitted result to take 1, and take 0 if it is less than the value to obtain the accuracy of the function.

Figure 6: Reliability test
Accuracy calculation:
\( Accuracy=\frac{((Actual=1,Predicted=1)+(Actual=0,Predicted=0))}{Sum of the sample}=0.82 \)
The accuracy is greater than 0.8, which means the function is reliable.
The value of column “odds” means the function:
\( odds = Ax1 + Bx2 + Cx3 + …. + intercept \)
The following result means the odds by each category:
\( odds=\frac{P(continue buying)}{ P(won \prime t continue buying)} \)

Figure 7: Results of two factors using binary logistic regression fitting to Continue buying
Figure 7 shows the results of two factors using binary logistic regression fitting to Continue buying
Collect the above results into a tabular form into Table 2:
Table 2: Significant variables and their influence
Variable that matters | Significancy | Odds |
Price Rate 3 | * | 7.33 |
Price Rate 4 | * | 20.37 |
Spend less than RM20 | * | 0.19 |
Spend at zero | ** | 0.04 |
5. Discussion
The findings of this study clearly show that the price of the product and the money spend for each of the buying experiences are the most crucial factor deciding the propensity of consumer to purchase again in the future. Under the dimensions of economy, purchasing power, price level, are closely related to the choice of Starbucks stores [2]. For the price rate factor, the data analysis has shown that consumer who rate the product for 3 to 4 will usually have a higher tendency for repurchasing Starbucks. This phenomenon can be explained through several aspects. To begin with, consumer who rate the price of the product as 1 to 2 will not be willing to come again. This group of customers believed that the product is too cheap, which will likely not going to meet their need. Based on their income, social status and other social identity, they will have a higher chance of being in a higher stage in the system of “hierarchy of need” based on Maslow’s theory [3]. As these customers have already own enough resources for satisfying the safety needs and need of belongingness, they will likely to be in the stage of esteem need, which would induce them to invest more time and resources in finding the product the really meet their need and prestige. Thus, they will be more likely to choose other more luxury brand or hands made coffee that requires more effort and time to produce. While for customers that rate the price of the product from to 3 to 4, they will be much more likely to consume in Starbucks again, since the price rate for them is in an appropriate level, they will be more willing and capable to afford buying these drinks. These middle-class customers are likely to be the targeted consumers that are designed by Starbucks, as the business target consumer group is the middle class and above [4]. This can also be indicated by the coefficient gathered from the model: the coefficient for price rate of 3 is 2.236, while the coefficient for the price rate of 4 is 3.4232. And for customers that rate the price for 5, they will feel that the price is over expensive, therefore having a much lower propensity for continue shopping in Starbucks. Moreover, based on the theory of marginal utility [5], when comparing the customers that rate the price for 1 to 2 to the customers that rate the price for 3 to 4, their initial total utility is the same, but after the division of price based on their price rate, their marginal utility will be significantly lower than the marginal utility of the later group.
Due to the general weak consumption ability of the 0-20 spending group, the product that they are likely to purchase will likely to be something other than coffee, which makes them less possible for being the potential customer for the business as the product they buy is something different other than the major product: coffee. This can infer that their major consumption is generally something other than coffee like water or sandwiches, which is the major product of many convenient stores. Moreover, for the price interval of 0 to 20, there are many more firms like Luckin coffee or other drinking store. This can also be proved by the data model as the coefficient for the variable representing the group of “below 20” is -1.76. In contrast, those customers that spend in the interval of 20 to 40 will likely bought the most qualified product, the coffee, in Starbuck. And as coffee is a special type of drink that contains the highly addictive caffeine, it will be easy for them to form the so called path dependence which is a state that occurs whenever there is positive amplification, for then initially nearby dynamical trajectories subsequently diverge as a function of small differences in their initial conditions, so the path taken depends on precisely where the first step began [6]. This made it much easier for these groups of customers to get addicted to the drink they bought in Starbucks. Thereby increasing customer loyalty. At the same time, those who can spend more than 20 on a single purchase is likely to acknowledge more on the specific brand of Starbucks and is therefore more willing to pay for this.
It is worth noticing that many factors like income or status that are supposed to be influential to customer loyalty based on common sense have been proved by data analysis that they don’t have much effect on that. For the factor of income, the reason why it has no effect on consumer loyalty is that it doesn’t equal to the amount of disposable income that can be used for consumption is a specific area. The factors that can effectively influence one’s disposable income would be their own expenditure habit and savings [7]. Different people would have different amounts of expenditure in other area of spending besides food and drinks based on their family structure and other personal status. This may lead to the fact that a father earning $ 10,000 per month while raising a family of 3 spend the exact same amount of money in drinks compared to a young lady earning only $6000 but are still single. Meanwhile, the difference in social status can also not necessarily a factor in affecting the continued buying of coffee in Starbucks. With the rise of living quality, students in nowadays have gain a relatively higher amount of pocket money than they do in the past, which allows them to afford the price of coffee in Starbucks. Moreover, as coffee gets more popular worldwide, its functions of motivation have been discovered and recognized, and this function is not only useful for the workers who need to focus on their job for a generally long period of time but is also useful for students who need caffeine to stay energetic when studying continuously [8].
There are mainly two improvements related to these two factors that can help the business to gain a better profit regarding the issue of customer loyalty. The first improvement is about designing and rebuilding a point system that are based on the amount of money consumed. As customers consumed more at Starbucks, they will be able to unlock special gifts along with certain privileges like the removal of deliver fee or the use of special seats. In this way, consumers can be effectively motivated to consume more in order to obtain those privileges to get a better experience at Starbucks. And as they enjoy those well-designed treatment, they will be more likely to consume more, making them even more loyalty than before. The second improvement is about the creation and design of lower-division products like tissue or chewing gum. Doing this can effectively enable business to obtain the lower part of market that are previously neglected, while the brand power of the business can also ensure the sales of these products since in many customers’ mind, the product of Starbucks had already been deeply related to the impression of high quality and decent status [9].
6. Conclusion
Due to the increasing global popularity of coffee originating from South America, Starbucks is one of the most representative companies among them. The authors conducted data analysis on the major factors affecting customer loyalty coffee business, aiming to help Starbucks optimize sales strategies and products. The author collected second-hand resources and imported them into R studio for analysis using P-value and chi square modeling methods. Among the many possible influencing factors, the data shows that the factors that have a substantial impact are price rate and spending. We believe that the majority of price rate customers between 3-4 are middle-class customers (possibly Starbucks' target customer group). And for them, Starbucks' prices are at a normal level, which proves that they have sufficient purchasing power. Customers spend in the interval of 20 to 40RM most likely to purchase coffee products (containing addictive caffeine), so they are more likely to become dependent on it. At the same time, these people who are willing to consume up to 20-40RM will also have a deeper understanding of the product. In summary, author proposes to improve Starbuck’s business with the way of designing and rebuilding a point system that are based on the amount of money consumed and creating and designing of lower- division product.
References
[1]. He Jie, Cao Jing, and Cai Xiaomei (2023): Starbucks Consumer Brand Experience and Formation Mechanism from the Perspective of Self Consistency, Journal of Tourism
[2]. Zeng Guojun, Lu Rurui, Z, L, 2017, Research on the spatial diffusion characteristics and influencing factors of Starbucks in Chinese Mainland, Geographical research.
[3]. Gawel, Joseph E. “Herzberg’s Theory of Motivation and Maslow’s Hierarchy of Needs.” ScholarWorks@UMass Amherst, scholarworks.umass.edu/pare/vol5/iss1/11/. Accessed 22 Oct. 2023.
[4]. Carmely, Maya. “Starbucks Target Market Analysis & Marketing Strategy.” Start.Io - A Mobile Marketing and Audience Platform, 5 June 2023, www.start.io/blog/starbucks-target-market-customer-characteristics-marketing-strategy/.
[5]. Economics Help “Marginal Utility Theory.”, www.economicshelp.org/blog/glossary/marginal-utility-theory/. Accessed 19 Aug. 2023.
[6]. Path Dependency - Meaning, Theory, Example, How It Works? - Wallstreetmojo, www.wallstreetmojo.com/path-dependency/. Accessed 18 Aug. 2023.
[7]. Woytinsky, W. S. “Relationship Between Consumers’ Expenditures, Savings, and Disposable Income.” The Review of Economics and Statistics, vol. 28, no. 1, 1946, pp. 1–12. JSTOR, https://doi.org/10.2307/1926680. Accessed 22 Oct. 2023.
[8]. Hamzah, Mahira. “Starbucks Customer Survey.” Kaggle, 16 May 2020, www.kaggle.com/datasets/mahirahmzh/starbucks-customer-retention-malaysia-survey.
[9]. Anthem Branding “What Is Brand Power and Why Is It Important for Your Business?”, anthembranding.com/blog/what-is-brand-power-and-why-is-it-important-for-your-business. Accessed 19 Aug. 2023.
Cite this article
Hou,Y.;Zhu,T.;Zhang,X. (2024). Analysis of Factors Affecting Customer Loyalty to Starbucks. Advances in Economics, Management and Political Sciences,92,75-82.
Data availability
The datasets used and/or analyzed during the current study will be available from the authors upon reasonable request.
Disclaimer/Publisher's Note
The statements, opinions and data contained in all publications are solely those of the individual author(s) and contributor(s) and not of EWA Publishing and/or the editor(s). EWA Publishing and/or the editor(s) disclaim responsibility for any injury to people or property resulting from any ideas, methods, instructions or products referred to in the content.
About volume
Volume title: Proceedings of the 2nd International Conference on Financial Technology and Business Analysis
© 2024 by the author(s). Licensee EWA Publishing, Oxford, UK. This article is an open access article distributed under the terms and
conditions of the Creative Commons Attribution (CC BY) license. Authors who
publish this series agree to the following terms:
1. Authors retain copyright and grant the series right of first publication with the work simultaneously licensed under a Creative Commons
Attribution License that allows others to share the work with an acknowledgment of the work's authorship and initial publication in this
series.
2. Authors are able to enter into separate, additional contractual arrangements for the non-exclusive distribution of the series's published
version of the work (e.g., post it to an institutional repository or publish it in a book), with an acknowledgment of its initial
publication in this series.
3. Authors are permitted and encouraged to post their work online (e.g., in institutional repositories or on their website) prior to and
during the submission process, as it can lead to productive exchanges, as well as earlier and greater citation of published work (See
Open access policy for details).
References
[1]. He Jie, Cao Jing, and Cai Xiaomei (2023): Starbucks Consumer Brand Experience and Formation Mechanism from the Perspective of Self Consistency, Journal of Tourism
[2]. Zeng Guojun, Lu Rurui, Z, L, 2017, Research on the spatial diffusion characteristics and influencing factors of Starbucks in Chinese Mainland, Geographical research.
[3]. Gawel, Joseph E. “Herzberg’s Theory of Motivation and Maslow’s Hierarchy of Needs.” ScholarWorks@UMass Amherst, scholarworks.umass.edu/pare/vol5/iss1/11/. Accessed 22 Oct. 2023.
[4]. Carmely, Maya. “Starbucks Target Market Analysis & Marketing Strategy.” Start.Io - A Mobile Marketing and Audience Platform, 5 June 2023, www.start.io/blog/starbucks-target-market-customer-characteristics-marketing-strategy/.
[5]. Economics Help “Marginal Utility Theory.”, www.economicshelp.org/blog/glossary/marginal-utility-theory/. Accessed 19 Aug. 2023.
[6]. Path Dependency - Meaning, Theory, Example, How It Works? - Wallstreetmojo, www.wallstreetmojo.com/path-dependency/. Accessed 18 Aug. 2023.
[7]. Woytinsky, W. S. “Relationship Between Consumers’ Expenditures, Savings, and Disposable Income.” The Review of Economics and Statistics, vol. 28, no. 1, 1946, pp. 1–12. JSTOR, https://doi.org/10.2307/1926680. Accessed 22 Oct. 2023.
[8]. Hamzah, Mahira. “Starbucks Customer Survey.” Kaggle, 16 May 2020, www.kaggle.com/datasets/mahirahmzh/starbucks-customer-retention-malaysia-survey.
[9]. Anthem Branding “What Is Brand Power and Why Is It Important for Your Business?”, anthembranding.com/blog/what-is-brand-power-and-why-is-it-important-for-your-business. Accessed 19 Aug. 2023.


