


1. Introduction
Innovation has been proven to be the engine of economic growth [1-2]. Although many factors, such as breakthroughs in basic science, influence the pace and direction of innovation, economists have begun to focus, at least since President Donald Trump came to power, on the important role of politics in shaping investments in innovation [3-5]. In this paper, we ask: How do political shocks in the U.S. affect innovation in China? How do firms in China react to these shocks?
Politics can affect innovation through two competing mechanisms: On the one hand, political decisions affect collaboration and knowledge diffusion across countries and individuals, which might negatively hurt firms' innovation [3, 5]. On the other hand, political shocks may raise the transaction cost of acquiring patents, which forces the firms to invent independently and increase innovation output [6]. From our perspective, the question is not whether one or the other is exclusively at work; instead, it is more important to examine which one outweighs the other, on average, and which contextual conditions amplify one process relative to the other.
Recent debates about how Trump affects innovation in China illustrate the dilemma: While some expect Trump's policies on immigration, communication, and collaboration restrictions to heavily affect the volume, quality, and direction of Chinese research due to the increasing cost of getting funding resources from the U.S., others view it as a chance for Chinese firms to catch up and decrease reliance on the technology of other countries. Firms often have to make the critical decision on whether to invest resources in internal patent invention (make it) or pursue external acquisition (buy it). Among all the factors affecting firms’ decision to “make” or to “buy,” one of the most significant is the transaction cost. The political shock from Trump increased the transaction cost of buying patents and forced the firms in China to create.
However, empirically identifying the effect of the political shock on innovation is challenging due to several obstacles. First, many other factors confound the estimation of the effect. For example, China's National 15-year Plan for Science and Technology Development was implemented over a decade ago, showing how China had been attempting to develop its indigenous innovation even without substantial political shocks [7]. Second, Chinese data on specific Chinese political decisions and the behavior of inventors in China are limited and have unestablished veracity.
This paper takes advantage of the election of Donald Trump as an opportunity for naturalistic observation to investigate the effect of political conflict on innovation. Donald Trump was overwhelmingly predicted to lose to Hillary Clinton [8], and he won the Electoral College vote, not the popular vote [9]. These factors illustrate how Trump's win was an unexpected, exogenous shock. Other papers have used similar reasoning to justify the identification of Trump's election victory as a shock [4,10].
To empirically identify the impacts of Trump on Chinese inventors, we apply a difference-in-differences (DID) approach, utilizing data from the USPTO. We use patents, inventors, and firms from China as our treatment group and estimate the causal effect with a control group containing innovation from Japan, South Korea, Taiwan, and Singapore.
There is no simple, one-dimensional method to measuring innovation; as such, we construct numerous dependent variables indicative of innovative output at the patent, inventor, and firm levels. The quantity of patents is the number of patents granted, and the quality of patents is measured through the number of citations received. Furthermore, we construct two variables that indicate search distance. First, technological distance is defined to be the extent to which a patent searches distant knowledge fields during the invention process. In this case, knowledge fields are based on each patent’s respective Cooperative Patent Classification (CPC) subclasses, a categorization system that denotes the fields of every patent. The second search distance measure is cognitive distance, measuring the extent to which inventors searched for knowledge with low visibility. These distance measures reflect the chances of meaningful innovation, as previous literature has established that larger search distances heighten the occurrence of serendipitous discoveries[11-12].
We find that following the Trump shock, China has produced higher patent quality, patent quantity, and search distance compared to its regional counterparts. The quality of Chinese patents improved 17.8% relative to the control group on average, technological distance improved by 5.4%, and the ratio of U.S. patents cited increased by 6.6%. These results remained consistent across the patent, inventor, and firm levels. In fact, inventors saw a 17.7% increase in patent quality on average.
This paper contributes to several parts of the existing literature. First, it contributes to prior research surrounding the understanding of how politics affects innovation. Previous studies have highlighted the role of decreasing labor mobility, collaboration, communication, and expectation [3, 5, 13-15]. We add a new perspective, transaction cost, and emphasize the importance of firms’ strategic decisions. Secondly, there is a significant amount of attention devoted to studying factors that affect the innovation of firms [15-18]. We add new evidence showing how disruptive institutional change can be a source of the changing nature of innovation. Lastly, we provide new empirical evidence for the transaction cost literature by testing the theory in a novel international context.
Moreover, this paper will have implications for policymakers. The tension between China and the U.S. has aroused attention among academics, the public, and policymakers. Without fully understanding how political tension affects the economies of China and the U.S., it is difficult for government officials to find a comprehensive way to react to the rising issues in foreign affairs. This paper sheds light on one of the most critical aspects of an economy –– innovation –– and helps policymakers better understand the true weight of their political decisions.
The rest of the paper proceeds as follows: Section 2 illustrates the construction of the variables in detail; Section 3 analyzes the results of the DID regression approach; Section 4 discusses this study’s findings while providing insight into the limitations of this study and concludes.
2. Method
2.1. Data and Sample
This paper’s primary data source is the patent data from the United States Patent and Trademark Office (USPTO). This source was chosen because of the work of previous scholars and its clear, expansive, and transparent data. Due to USPTO’s international recognition and utility, prior studies about patents and innovation have conducted their analyses using figures from the same source [4, 12].
Our full data sample includes all patents granted between 2012 and 2022. In our primary regressions, we restrict the time frame to patents granted between 2012 and 2020 to fully capture four years before and after the Trump shock in 2016.
We conduct a difference-in-differences approach to establish causal inferences. For this analysis, we chose a control group comprised of geographically proximate East Asian countries that shared economic, political, and cultural similarities. The control group includes South Korea, Singapore, Taiwan, and Japan. The assignee locations attributed to each focal patent are used to identify the country of that patent; in other words, the firm’s location identifies the country to which the patent belongs. In the end, 992,455 patents from China and the control group are identified, but this data is narrowed into a sample of 300,178 patents for regression analysis after keeping patents that have technological distance data.
2.2. Dependent Variables
2.2.1. Number of citations received
A patent’s quality is indicated by the number of citations it receives. This measurement has been used in well-established literature [4, 19-20], and it makes intuitive sense. For instance, patents frequently cited by others tend to have higher economic value and visibility.
To construct this numerical indicator of patent quality, we use the full citation dataset of all countries and restrict it to patents from China and the control group, which are on the receiving end of citations. We determine the year the citation was made by the year the citing patent was granted and restrict the time interval to define the dependent variable as the number of citations received by a focal patent immediately two years after the year it was granted.
2.2.2. The ratio of U.S. patents cited to all patents
In the opposite direction, the patents cited by a focal patent are also valuable indicators of search behavior. Determining the origin of these cited patents provides meaningful insight into the extent of knowledge diffusion and communication between countries. To construct this variable, we begin by restricting the full citation dataset of all countries to focal patents from China and the control group; focal patents are the patents granted between 2016 and 2022 that cite other patents. After determining the country of the patents cited by using the location of their assignee, we construct a binary indicator of whether the location is the U.S. Moreover, we count the total number of citations made by focal patents and calculate the ratio of the number of cited patents of U.S. origin to the number of total cited patents.
2.2.3. Technological distance
Technological distance measures the extent to which a patent searches distant knowledge fields during the invention process. The construction of this variable is based on previous literature. Specifically, we follow in the footsteps of Zheng and Wang [12].
2.2.4. Cognitive distance
Cognitive distance measures the extent to which inventors avoided the local search trap to search for prior art and knowledge with low visibility. Building on work from Zheng and Wang [12], we construct this variable through two measures: temporal visibility and assignee visibility.
Temporal visibility indicates how recent the cited patent j is. Assignee visibility measured the prominence of an assignee. Specifically, it measured the prominence of patent j’s assignee in patent j’s field based on its ranking in the number of granted patents in the field from 2012 to 2022. Subsequently, we calculated cognitive distance by first standardizing and aggregating temporal and assignee visibility. Then, we took the reciprocal of the sum so that larger visibilities would correspond with smaller distances. Once we had the measure of cognitive distance for each focal patent and its cited patent j’s, we aggregated the cognitive distances across the cited patent j’s in set S for each focal patent.
2.3. Independent Variables
The independent variables in this study include China, an indicator of whether the firm is located in China, and the Trump shock, an indicator of whether the year is post-2016 (in robustness checks, we change this post to 2017 to reinforce the causation effect).
2.4. Difference-in-differences Regression
Given the dependent variables, independent variables, moderators, and control variables described above, we use the following equation for regression analysis:
\( {Y_{tt}}=α+{β_{1}}Trea{t_{t}}+{β_{2}}Pas{t_{t}}+{β_{3}}Trea{t_{t}}Pas{t_{t}}+control{s_{tt}}+{ε_{tt}} \) (1)
In the equation, i refers to the firm (assignee), individual inventor, or focal patent; t refers to the year; Y indicates the dependent variable; Treat refers to the treatment group, China; Post refers to the post-election indicator (whether the year is past 2016); controls include the control variables outlined in Section 4.5; and \( {ε_{it}} \) indicates the error.
We chose the control group of Singapore, Japan, Taiwan, and South Korea by matching China with geographically proximate regions that were the most economically and culturally similar. Innovative activity in these regions was substantially more similar to China compared to European nations or the U.S., with all of the chosen regions demonstrating emerging capacities and dominance in the global innovative landscape. Despite its similarity in population size, India is omitted from the control group with China because its innovation ecosystem focuses heavily on services like IT and software, differing drastically from China’s technological specialization.
3. Results
3.1. Independent Variables
Table 1: Assignee and inventor level results
(1) | (2) | (3) | (4) | |
Assignee | Inventor | |||
VARIABLES | Number of patents | Number of citations received per patent | Number of patents | Number of citations received per patent |
Treatment (1 = China) | -0.583 | -0.119 | 0.213*** | -0.147*** |
(4.184) | (0.158) | (0.0335) | (0.0316) | |
Post (1 = after 2016) | -1.650*** | -0.244*** | -0.0620*** | -0.305*** |
(0.561) | (0.0212) | (0.00625) | (0.00588) | |
Treatment | 10.73*** | 0.0249 | 0.370*** | 0.0600*** |
(1.354) | (0.0511) | (0.0240) | (0.0225) | |
Observations | 56,489 | 56,489 | 478,275 | 478,275 |
R-squared | 0.935 | 0.418 | 0.638 | 0.329 |
 Post
Post Standard errors in parentheses
*** p<0.01, ** p<0.05, * p<0.1
The table above features the first two columns at the assignee (firm) level and columns 3 and 4 at the inventor level. At each level, the dependent variables include the number of patents and the average number of citations received per patent, which measure the quantity and quality of patents, respectively. The assignee level demonstrates that patent-owning organizations based in China versus nearby regions were not statistically significantly different before the Trump shock. The coefficient before post is negative for both, reflecting Trump's impacts on the rest of the world in terms of quantity and quality of patents. The statistically significant interaction term is 10.73 for the number of patents, which, given the sample's mean of 15.2, indicates that Chinese assignees increased the production of patents by 70.5% relative to assignees of nearby regions (Singapore, Japan, Taiwan, and South Korea) after the Trump shock.
At the inventor level, the number of citations received per patent increased by approximately 17.7% (given its sample mean of 0.34) for patents with Chinese inventors relative to the control group. At the same time, the number of patents from Chinese inventors increased by 0.370 relative to the control group after the Trump shock.
These results fit in line with hypothesis 2: China’s organizations became increasingly self-reliant after the Trump shock. While nearby regions such as Singapore, Japan, Taiwan, and South Korea were also affected by the shock, they had weaker incentives to become self-reliant because they could still rely on buying U.S. inventions with relatively low transaction costs.
Table 2: Effects of the Trump shock on dependent variables
(1) | (2) | (3) | (4) | |
VARIABLES | Number of citations received | Ratio of U.S. patents cited to all patents | Mean technological distance | Cognitive distance |
Treatment (1 = China) | -0.106*** | -0.0156*** | 0.00426*** | 29.34 |
(0.0146) | (0.00299) | (0.000695) | (35.70) | |
Post (1 = after 2016) | -0.171*** | -0.00506*** | 0.00469*** | -37.67* |
(0.00514) | (0.00163) | (0.000379) | (19.26) | |
Treatment | 0.0680*** | 0.0251*** | 0.00714*** | 2.457 |
(0.0175) | (0.00363) | (0.000843) | (43.53) | |
Observations | 691,998 | 229,170 | 227,961 | 210,351 |
R-squared | 0.016 | 0.096 | 0.440 | 0.006 |
 Post
PostStandard errors in parentheses
*** p<0.01, ** p<0.05, * p<0.1
The first column displays the effects of the Trump shock on the number of citations received per patent, which measures the quality of patents. The regression results show that before the Trump shock, the treatment group on average received 0.106 fewer citations per patent than those of the control group. This coefficient is statistically significant. Given that the mean number of citations per patent for the sample is 0.38, 0.106 number of citations is around 27.7% fewer citations than that of the control group. This result is consistent with the common perception that Chinese patents were historically lower quality than their East-Asian counterparts. As expected, the coefficient before the post illustrates how the control group decreased somewhat in response to the Trump shock, which indicates that the election and presidency of Trump affected the rest of the world. After the Trump shock, the average number of citations received per patent in China was 0.0680 higher than those received by nearby regions (including Singapore, Japan, Taiwan, and South Korea). This statistically significant change is approximately 17.8% of the mean number of citations per patent. Therefore, China's improvement in patent quality relative to comparable regions supports the hypothesis that Chinese innovators became more self-reliant and robust following the Trump shock. Because the transaction costs of relying on licensing U.S. innovation increased, firms began developing their own innovation, leading to more experience and productivity in innovation and, thereby, higher quality patents.
The second column illustrates the ratio of citations of U.S. patents made by the focal patent to the total number of citations made. The post coefficient partially supports the hypothesis of knowledge diffusion decreasing following the Trump shock, as it shows the control group’s ratio decreasing after 2016. However, the interaction term illustrates the impacts on China: knowledge diffusion may exist, but it is not a main driver. China began to catch up with comparable regions by taking full advantage of existing knowledge. This conjecture is supported by China’s relative increase in the ratio of U.S. patents cited; the U.S. is a leader in innovation, so taking full advantage of knowledge would entail citing more U.S. patents.
Similarly, the effect of the Trump shock on technological distance is shown in the third column. After the Trump shock, the control group somewhat increased in distance, yet China began displaying 5.4% larger technological distance (given its sample mean of 0.13) compared to nearby regions. This similarly reaffirms China’s heightened propensity to internalize the innovation process following the Trump shock due to higher transaction costs of outsourcing.
Lastly, the fourth column shows cognitive distance. While the interaction term is not statistically significant, it is positive, providing evidence to support the hypothesis that Chinese firms became independently stronger innovators. The results indicate that there is a chance that Chinese firms increased their cognitive distance by 8.6% (given its sample mean of 28.6) compared to nearby regions. Recent literature has discussed make it or buy it, and these results overall reflect that China, compared to the control group, was incentivized to invest drastically more in its internal innovation rather than rely on foreign technology.
3.2. Parallel Trend
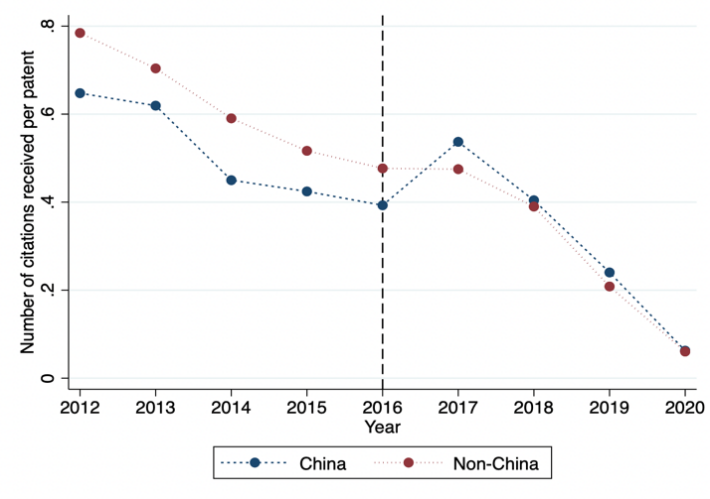
Figure 1: Number of citations received per patent (section H): China and non-China (Japan).
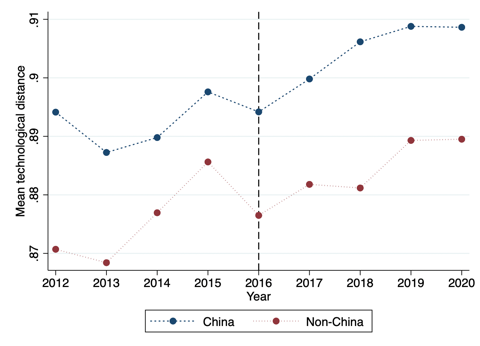
Figure 2: Mean technological distance: China and non-China.
This paper tests for the parallel trend assumption to satisfy DID both graphically and analytically.
To assess the parallel trend assumption regression results and the plot, we focus on the pre-intervention period before 2016. As demonstrated in figures 1 and 2, China and non-China show similar values before 2016 in both number of citations received per patent (measuring quality) and mean technological distance (measuring search distance). Although they may differ in value, as the control group is naturally imperfect, the values move accordingly in similar directions.
Table 3: Effects of the Trump shock on dependent variables
(1) | (2) | (3) | (4) | |
VARIABLES | Number of citations received | Ratio of U.S. patents cited to all patents | Mean technological distance | Cognitive distance |
Treatment | -15.22 | -7.087 | 270.2 | 13,554 |
(22.60) | (5.172) | (207.3) | (32,892) | |
Year | -0.0785*** | 0.00132 | -0.209*** | 7.787 |
(0.00282) | (0.00104) | (0.0415) | (6.474) | |
Treatment Year | 0.00752 | 0.00353 | -0.135 | -6.726 |
(0.0112) | (0.00257) | (0.103) | (16.33) | |
Observations | 338,467 | 106,929 | 106,188 | 98,791 |
R-squared | 0.003 | 0.000 | 0.001 | 0.000 |
Standard errors in parentheses
*** p<0.01, ** p<0.05, * p<0.1
In Table 3, the interaction between treatment and time indicates whether time has an effect on outcome (the trend) and whether these trends varied for the treatment group for each dependent variable. Hypothetically, a significant interaction would indicate that trends varied for both treatment groups, whereas a non-significant interaction indicates that both groups show similar trends. In this case, the interaction remains insignificant for all measures, reinforcing how the treatment and control groups are parallel in their trends.
4. Discussion and Conclusion
Though the vast majority of the literature has traditionally focused on internal characteristics of a country that affect its innovative capacity, it is now becoming apparent that political actions –– even those across the world –– can affect a country's innovation. The central question of this study concerns how the election and administration of Trump affected innovation in China. The Trump shock has sparked significant debates in academic and non-academic worlds. There are two major perspectives regarding how politics can affect innovation. The perspective of knowledge diffusion argues that Trump’s actions hurt Chinese innovation by limiting communication, collaboration, and labor mobility [3, 5, 13-15]. In contrast, the transaction cost perspective argues that Trump gave a chance for China to decrease its reliance on U.S. innovation by raising the cost of pursuing external acquisition [21-24]. We develop both frameworks by acknowledging that the central question of this debate is not about which perspective is correct but rather the extent to which either perspective has occurred in the real world.
Through our empirical analysis and regression results, we find that inventors and firms in China experienced relative increases in patent quality, quantity, and search distance following the Trump shock. These results support the transaction cost hypothesis being the more dominant one. Moreover, in heterogeneity analysis that we don’t display here due to page limitations, we find fields facing higher transaction costs, such as semiconductors, performed better. Inventors with larger collaboration networks and Chinese firms in southern urban cities also responded better.
Our paper makes several contributions to literature. First, we add to the overall framework of innovation by examining evidence of external political shocks. We overcome obstacles to collecting empirical data by using the USPTO dataset to examine the Trump administration following Trump’s election victory as a natural experiment.
Secondly, we add nuance to the literature on knowledge diffusion. On the one hand, our results demonstrate that knowledge diffusion is still a critical part of innovation: following the shock, the countries in the control group were negatively impacted due to limitations in communication, collaboration, and talent mobility. On the other hand, our study shows that knowledge diffusion may only be one part of the larger picture when considering the impacts of political actions on innovation. The difference-in-differences regression results show that attempts at self-reliance in response to sufficient incentives outweighed possible limitations and restrictions in communication and collaboration between international inventors.
Thirdly, we add to transaction cost economics by illustrating how transaction costs are expanding to apply to innovation in the 21st century [21]. China's better performance compared to Singapore, South Korea, Taiwan, and Japan illustrates that heightened transaction costs in "buying" resources from the U.S. incentivized China to pursue internal vertical integration. Some scholars have noted China's tendency to rely on U.S. technology [3, 22], but few have studied the shocks that catalyzed China into becoming more self-reliant. Moreover, some studies focused on China’s push for innovation, such as the Made in China 2025 plan [24-25], but these papers have utilized local Chinese databases for data instead of USPTO, which is more transparent, reliable, and international. Hence, our findings indicate that China's act of catching up is being reflected on the international stage.
Our paper also provides a novel perspective to policymakers. China's unexpectedly flexible response to Trump's actions illustrates how policies aimed to ostensibly stifle competitors can have large inadvertent effects by pushing competitors to become more self-reliant and powerful instead. The results from inventor networks, which is not shown here due to page limitations, also demonstrate the importance of communication and collaboration, which entail the exposure of firms to new and different talent. Lastly, the heterogeneous impacts depending on the city size and location serve as cautious reminders to the government that growing inequality could impact innovation by concentrating innovation in certain agglomerated areas instead of taking advantage of the unique aspects that numerous different geographical locations can offer.
Nonetheless, there are some limitations of this study. First, we recognize that the control and treatment groups are imperfect; while the East Asian countries share a handful of similarities, many differences exist. Future studies could do sample matching to allow the control and treatment groups to better align before the shock. Second, we took the trade-off of using the internationally recognized U.S. patent base, USPTO, instead of the Chinese patent base, Chinese National Intellectual Property Administration (CNIPA). We chose not to use the Chinese patent base mainly because of logistical obstacles, such as the fact that many Chinese patents are not publicly available and existing data require significant work to clean. Lastly, future studies could add more information about specific firm-level characteristics and related heterogeneous effects, such as firms’ amount of resources available and whether firms are state-owned enterprises.
References
[1]. Romer, P. M. (1990). Endogenous Technological Change. Journal of political Economy 98 (5, Part 2), S71-S102
[2]. Aghion, P., & P. Howitt (1992). A Model of Growth Through Creative Destruction. Economet-rica 60 (2), 323-351
[3]. Aghion, P., Antonin, C., Paluskiewicz, L., Strömberg, D., Sun, X., Wargon, R., & Westin, K. (2023). Does Chinese Research Hinge on U.S. Coauthors? Evidence from the China Initiative. National Bureau of Economic Research, Working Paper(Innovation). https://conference.nber.org/conf_papers/f183830.pdf
[4]. Engelberg, J., Lu, R., Mullins, W., & Townsend, R. (2022). Political Sentiment and Innovation: Evidence from Patenters. SSRN Electronic Journal. https://doi.org/10.2139/ssrn.4176649
[5]. Jia, R., Roberts, M. E., Wang, Y., & Yang, E. (2023). THE IMPACT OF U.S.-CHINA TENSIONS ON U.S. SCIENCE. National Bureau of Economic Research, Working Paper(Innovation). https://conference.nber.org/conf_papers/f183830.pdf
[6]. Williamson, O. E. (1989). Transaction cost economics. Handbook of industrial organization, 1, 135-182
[7]. Sun, Y., & Cao, C. (2021). Planning for science: China’s “grand experiment” and global implications. Humanities and Social Sciences Communications, 8(1), 1–9. https://doi.org/10.1057/s41599-021-00895-7
[8]. Katz, J. (2016, July 19). 2016 Election Forecast: Who Will Be President? The New York Times. https://www.nytimes.com/interactive/2016/upshot/presidential-polls-forecast.html
[9]. Shaw, D. (2016). Assessing the Impact of Campaigning in the 2016 U.S. Presidential Election . Zeitschrift Für Politikberatung, 8(1), 15–23. https://doi.org/10.5771/1865-4789-2016-1-15
[10]. Child, T. B., Massoud, N., Schabus, M., & Zhou, Y. (2021). Surprise election for Trump connections. Journal of Financial Economics, 140(2), 676–697. https://doi.org/10.1016/j.jfineco.2020.12.004
[11]. Arts, S., & Fleming, L. (2018). Paradise of Novelty—Or Loss of Human Capital? Exploring New Fields and Inventive Output. Organization Science, 29(6), 1074–1092. https://doi.org/10.1287/orsc.2018.1216
[12]. Zheng, Y., & Wang, Q. (Ryan). (2020). Shadow Of The Great Firewall: The Impact Of Google Blockade On Innovation In China. Strategic Management Journal, 41(12), 2234–2260. https://doi.org/10.1002/smj.3179
[13]. Kim, J. & Marschke, G., 2005. Labor mobility of scientists, technological diffusion, and the firm's patenting decision. RAND Journal of Economics, pp.298-317
[14]. Møen, J. (2005). Is Mobility of Technical Personnel a Source of R&D Spillovers? Journal of Labor Economics, 23(1), 81–114. https://doi.org/10.1086/425434
[15]. Atkin, D., Chen, M.K., & Popov, A., 2022. The returns to face-to-face interactions: Knowledge spillovers in Silicon Valley (No. w30147). National Bureau of Economic Research
[16]. Marx, M., Strumsky, D., & Fleming, L. (2009). Mobility, Skills, and the Michigan Non-Compete
[17]. Dustmann, C., & Preston, I. P. (2019). Free Movement, Open Borders, and the Global Gains from Labor Mobility. Annual Review of Economics, 11(1), 783–808. https://doi.org/10.1146/annurev-economics-080218-025843
[18]. Wuchty, S., Jones, B.F. and Uzzi, B., 2007. The increasing dominance of teams in production of knowledge. Science, 316(5827), pp.1036-1039
[19]. Henderson, R., Jaffe, A., & Trajtenberg, M. (2005). Patent Citations and the Geography of Knowledge Spillovers: A Reassessment: Comment. American Economic Review, 95(1), 461–464. https://doi.org/10.1257/0002828053828644
[20]. Hall, B. H., Jaffe, A., & Trajtenberg, M. (2005). Market Value and Patent Citations. The RAND Journal of Economics, 36(1), 16–38. http://www.jstor.org/stable/1593752
[21]. Arora, A., Fosfuri, A. and Gambardella, A., 2004. Markets for technology: The economics of innovation and corporate strategy. MIT press
[22]. Choung, E., & Koo, M. G. (2023). China's dream for chip supremacy: Seeing through the lens of panel display-related I.C. patents. Business and Politics, 25(2), 117–132. https://doi.org/10.1017/bap.2023.1
[23]. Edamura, K., Haneda, S., Inui, T., Tan, X. and Todo, Y., 2014. Impact of Chinese cross-border outbound M&As on firm performance: Econometric analysis using firm-level data. China Economic Review, 30, pp.169-179
[24]. Salitskii, A. I., & Salitskaya, E. A. (2022). China on the Way to Global Technology Leadership. Herald of the Russian Academy of Sciences, 92(3), 262–267. https://doi.org/10.1134/s1019331622030042
[25]. Hu, A. G. Z., Zhang, P., & Zhao, L. (2017). China as number one? Evidence from China’s most recent patenting surge. Journal of Development Economics, 124, 107–119. https://doi.org/10.1016/j.jdeveco.2016.09.004
Cite this article
Zhao,B.X. (2024). Trump’s Impact on Chinese Innovation: Evidence from Patents. Advances in Economics, Management and Political Sciences,93,171-180.
Data availability
The datasets used and/or analyzed during the current study will be available from the authors upon reasonable request.
Disclaimer/Publisher's Note
The statements, opinions and data contained in all publications are solely those of the individual author(s) and contributor(s) and not of EWA Publishing and/or the editor(s). EWA Publishing and/or the editor(s) disclaim responsibility for any injury to people or property resulting from any ideas, methods, instructions or products referred to in the content.
About volume
Volume title: Proceedings of the 2nd International Conference on Management Research and Economic Development
© 2024 by the author(s). Licensee EWA Publishing, Oxford, UK. This article is an open access article distributed under the terms and
conditions of the Creative Commons Attribution (CC BY) license. Authors who
publish this series agree to the following terms:
1. Authors retain copyright and grant the series right of first publication with the work simultaneously licensed under a Creative Commons
Attribution License that allows others to share the work with an acknowledgment of the work's authorship and initial publication in this
series.
2. Authors are able to enter into separate, additional contractual arrangements for the non-exclusive distribution of the series's published
version of the work (e.g., post it to an institutional repository or publish it in a book), with an acknowledgment of its initial
publication in this series.
3. Authors are permitted and encouraged to post their work online (e.g., in institutional repositories or on their website) prior to and
during the submission process, as it can lead to productive exchanges, as well as earlier and greater citation of published work (See
Open access policy for details).
References
[1]. Romer, P. M. (1990). Endogenous Technological Change. Journal of political Economy 98 (5, Part 2), S71-S102
[2]. Aghion, P., & P. Howitt (1992). A Model of Growth Through Creative Destruction. Economet-rica 60 (2), 323-351
[3]. Aghion, P., Antonin, C., Paluskiewicz, L., Strömberg, D., Sun, X., Wargon, R., & Westin, K. (2023). Does Chinese Research Hinge on U.S. Coauthors? Evidence from the China Initiative. National Bureau of Economic Research, Working Paper(Innovation). https://conference.nber.org/conf_papers/f183830.pdf
[4]. Engelberg, J., Lu, R., Mullins, W., & Townsend, R. (2022). Political Sentiment and Innovation: Evidence from Patenters. SSRN Electronic Journal. https://doi.org/10.2139/ssrn.4176649
[5]. Jia, R., Roberts, M. E., Wang, Y., & Yang, E. (2023). THE IMPACT OF U.S.-CHINA TENSIONS ON U.S. SCIENCE. National Bureau of Economic Research, Working Paper(Innovation). https://conference.nber.org/conf_papers/f183830.pdf
[6]. Williamson, O. E. (1989). Transaction cost economics. Handbook of industrial organization, 1, 135-182
[7]. Sun, Y., & Cao, C. (2021). Planning for science: China’s “grand experiment” and global implications. Humanities and Social Sciences Communications, 8(1), 1–9. https://doi.org/10.1057/s41599-021-00895-7
[8]. Katz, J. (2016, July 19). 2016 Election Forecast: Who Will Be President? The New York Times. https://www.nytimes.com/interactive/2016/upshot/presidential-polls-forecast.html
[9]. Shaw, D. (2016). Assessing the Impact of Campaigning in the 2016 U.S. Presidential Election . Zeitschrift Für Politikberatung, 8(1), 15–23. https://doi.org/10.5771/1865-4789-2016-1-15
[10]. Child, T. B., Massoud, N., Schabus, M., & Zhou, Y. (2021). Surprise election for Trump connections. Journal of Financial Economics, 140(2), 676–697. https://doi.org/10.1016/j.jfineco.2020.12.004
[11]. Arts, S., & Fleming, L. (2018). Paradise of Novelty—Or Loss of Human Capital? Exploring New Fields and Inventive Output. Organization Science, 29(6), 1074–1092. https://doi.org/10.1287/orsc.2018.1216
[12]. Zheng, Y., & Wang, Q. (Ryan). (2020). Shadow Of The Great Firewall: The Impact Of Google Blockade On Innovation In China. Strategic Management Journal, 41(12), 2234–2260. https://doi.org/10.1002/smj.3179
[13]. Kim, J. & Marschke, G., 2005. Labor mobility of scientists, technological diffusion, and the firm's patenting decision. RAND Journal of Economics, pp.298-317
[14]. Møen, J. (2005). Is Mobility of Technical Personnel a Source of R&D Spillovers? Journal of Labor Economics, 23(1), 81–114. https://doi.org/10.1086/425434
[15]. Atkin, D., Chen, M.K., & Popov, A., 2022. The returns to face-to-face interactions: Knowledge spillovers in Silicon Valley (No. w30147). National Bureau of Economic Research
[16]. Marx, M., Strumsky, D., & Fleming, L. (2009). Mobility, Skills, and the Michigan Non-Compete
[17]. Dustmann, C., & Preston, I. P. (2019). Free Movement, Open Borders, and the Global Gains from Labor Mobility. Annual Review of Economics, 11(1), 783–808. https://doi.org/10.1146/annurev-economics-080218-025843
[18]. Wuchty, S., Jones, B.F. and Uzzi, B., 2007. The increasing dominance of teams in production of knowledge. Science, 316(5827), pp.1036-1039
[19]. Henderson, R., Jaffe, A., & Trajtenberg, M. (2005). Patent Citations and the Geography of Knowledge Spillovers: A Reassessment: Comment. American Economic Review, 95(1), 461–464. https://doi.org/10.1257/0002828053828644
[20]. Hall, B. H., Jaffe, A., & Trajtenberg, M. (2005). Market Value and Patent Citations. The RAND Journal of Economics, 36(1), 16–38. http://www.jstor.org/stable/1593752
[21]. Arora, A., Fosfuri, A. and Gambardella, A., 2004. Markets for technology: The economics of innovation and corporate strategy. MIT press
[22]. Choung, E., & Koo, M. G. (2023). China's dream for chip supremacy: Seeing through the lens of panel display-related I.C. patents. Business and Politics, 25(2), 117–132. https://doi.org/10.1017/bap.2023.1
[23]. Edamura, K., Haneda, S., Inui, T., Tan, X. and Todo, Y., 2014. Impact of Chinese cross-border outbound M&As on firm performance: Econometric analysis using firm-level data. China Economic Review, 30, pp.169-179
[24]. Salitskii, A. I., & Salitskaya, E. A. (2022). China on the Way to Global Technology Leadership. Herald of the Russian Academy of Sciences, 92(3), 262–267. https://doi.org/10.1134/s1019331622030042
[25]. Hu, A. G. Z., Zhang, P., & Zhao, L. (2017). China as number one? Evidence from China’s most recent patenting surge. Journal of Development Economics, 124, 107–119. https://doi.org/10.1016/j.jdeveco.2016.09.004