


1. Introduction
The pursuit of progress in human society is endless. However, along with social advancement and economic development, the world faces both opportunities and challenges. Since 2020, the historical process dominated by "pandemic" and "post-pandemic" themes has brought about numerous black swan events. These events include multiple stock market circuit breakers, the Russia-Ukraine conflict, frequent natural disasters caused by El Niño phenomena, and more. In this context, the concept of ESG (Environmental, Social, Governance) has received unprecedented attention.
The ESG concept, first introduced in 2005, comprises three components: E stands for Environment, used to assess companies' involvement in sustainability and their impact on climate change factors. An example of an environmental factor is carbon-related concepts like carbon emissions, carbon neutrality, and carbon footprint. S stands for Social, encompassing aspects like brand image, gender equality, employee turnover rate, and social acceptance. G stands for Governance, a crucial element in ESG that allows investors to evaluate how a company's leadership affects risks and opportunities. Governance includes aspects such as equity, investments, changes in board members, and can predict a company's potential risks and returns to some extent.
ESG, as a value system that promotes sustainable and coordinated development in economic, environmental, social, and governance aspects, represents an investment philosophy that seeks long-term value growth. It is a comprehensive, concrete investment approach. Initially, ESG was viewed as the "second financial report for analyzing a company's market performance," emphasizing the evaluation of publicly traded companies through an ESG assessment system.
As ESG gained widespread attention, international organizations, authoritative institutions, and countries worldwide have proposed ESG sustainable development action plans. For instance, the European Union has initiatives like the "European Green Deal" and the "Sustainable Finance Action Plan." The Chinese government has also committed to the "peak carbon emissions and carbon neutrality" goal to promote sustainable finance and the development of ESG standards.
Exchange-Traded Funds (ETFs) are investment instruments that are traded on stock exchanges, similar to stocks. ETFs typically track specific indices, industries, asset categories, or strategies and achieve this tracking by holding the corresponding underlying assets, such as stocks, bonds, commodities, etc. Naturally, with the emergence of the ESG concept, ESG ETF products have also emerged. ESG ETFs are now in a phase of rapid development, with increasing asset sizes, product diversity, and consumer attention [1].
The main purpose of this article is to investigate whether ESG ETFs perform better than the perennial favorite in the Chinese mainland trading market - the CSI 300 Index ETF. If this viewpoint is confirmed, it could become a compelling reason to continue promoting the ESG sector, marking an important milestone in reshaping investment values. If the results show no evidence that ESG ETFs outperform the existing CSI 300 Index ETF products, there is no reason to avoid them, as rejecting ESG values will not bring greater returns or lower risks.
2. Literature Review
Regarding the performance of ESG ETFs compared to other ETFs, current academic research primarily presents three viewpoints:
1) ESG ETFs outperform or partially outperform traditional ETFs.
2) The performance of ESG ETFs is not significantly different from that of traditional ETFs.
3) ESG ETFs underperform traditional ETFs.
These viewpoints reflect the ongoing debate in academic research about the relative performance of ESG-focused exchange-traded funds compared to more traditional ETFs. Each perspective has its own set of arguments and supporting evidence, and the consensus may vary depending on the specific time frame, region, and methodology of the research. It's important to note that the performance of ESG ETFs can be influenced by various factors, including the specific ESG criteria used and market conditions.
2.1. ESG ETFs outperform traditional ETFs
Research by Ariadna Dumitrescu [2] and others indicates that due to the rapid growth of the ESG ETF industry, increased competition, and more incentives for fund managers to provide higher-quality products, incorporating ESG preferences into ETF investment decisions can help investors outperform the market and passive benchmark ETFs. HUONG NGUYEN's study [3], which examined 126 ESG ETFs under the market pressures of Covid-19, showed that ESG ETFs performed better than the market during the pandemic. This was primarily attributed to investor stickiness and positive expectations regarding ESG ETFs. Pavlova & de Boyrie's research [4], analyzing over 60 sustainable ETFs, found that although ESG-focused funds were not fully protected during market downturns, their performance was either on par with or even better than the market at any given time. Naffa's study [5] revealed that, as most investors are willing to sacrifice short-term gains for long-term returns, trend-following portfolios generated non-negative alpha, with environmental-themed portfolios performing the best. Annamarie Khandji [6] conducted extensive testing and concluded that in most years, U.S. ESG-focused ETFs had higher Sharpe and information ratios compared to traditional ETFs, leading to the conclusion that ESG ETFs generated higher returns. Ellen's findings [7] suggest that due to investors' perception of well-managed ESG-related companies in many aspects, ESG investments can be seen as a strategy for private and professional investors to mitigate some risks associated with entering the ETF market, with significant results at a 5% significance level. Jasper Chan's [8] performance analysis from May 2018 to May 2020 concluded that, after accounting for regional biases, local ESG ETFs outperformed non-ESG ETFs. Franco Fiordelisi [9] and others' research found that passive and pre-committed strategies offered various economic and econometric advantages, demonstrating that socially responsible investment (SRI)-oriented strategies could generate significantly higher average stock market returns and liquidity. However, this conclusion is not absolute, as the excess performance was concentrated during months of extreme climate events, and this effect reversed during financial crises.
2.2. The performance of ESG ETFs is not significantly different from that of traditional ETFs
Srinidhi Kanuri's [10] research indicates that in European ESG funds and non-ESG funds, performance metrics such as Jensen's Alpha, Sharpe Ratio, and Treynor Ratio are nearly identical. The average excess return of ESG funds is slightly higher than non-ESG funds in the Fama-French model, but the difference is not statistically significant. Hidenori Takahashi [11] found no relationship between ESG scores and abnormal returns at any stage. Even when using four virtual variables based on ESG score quintiles, the coefficients of these variables are not statistically significant. Guangliang Y [12] compared stocks with different ESG scores to the Sharpe ratio under efficient frontier conditions. The results show that ESG-related stocks do not provide excess returns during normal periods compared to non-ESG-related stocks but exhibit better risk performance. This extends to the conclusion that the performance of ESG ETFs is not significantly different from that of traditional ETFs. Quinn Curtis [13], while investigating whether ESG ETFs require more financial regulation, found that, on average, ESG funds do not impose higher costs on investors in terms of expense ratios, reduced returns, or decreased risk-adjusted performance compared to similar funds. It should be noted that these results do not imply that ESG funds are superior to regular funds as investments. Ryan Cultice [14] studied a group of 28 ESG-focused ETFs and compared them to a matched sample of actively managed ESG mutual funds. However, their performance metrics were roughly similar to those of their active peers. Marcelo Pagotto Figueiredo [15] analyzed the returns of financial assets dedicated to ESG. In the U.S. market environment, compared to the S&P 500 Index, no significant reduction or increase in risk patterns for ESG assets was found, nor was there evidence of a return premium.
2.3. ESG ETFs underperform traditional ETFs
This perspective in academic research presents a diverse range of findings, and we will highlight a selection of literature. SRINIDHI KANURI [16] focused on the risk and return characteristics of ESG ETFs from their inception (February 2005) to July 2019. The study compared them with investable proxies for the U.S. (Russell 3000 ETF - IWV) and global (SPDR® Global Dow ETF - DGT) stock markets. Using absolute and risk-adjusted performance metrics, the author found that equally weighted and value-weighted ESG portfolios outperformed IWV and DGT in certain periods but underperformed in others. However, over the entire period, IWV and DGT outperformed ESG portfolios and exhibited higher absolute and risk-adjusted performance. Gerasimos G. Rompotis' research [17] did not find a significant relationship between the ESG ratings of ETFs and their assets. In fact, the author even found a negative correlation between the returns of ETFs and their ESG indicators.
3. Methodology
The data used in this article all come from the Wind database and Bloomberg database. The core methodology of this article is centered around the idea of "achieving better market performance with lower risk" to compare two types of ETFs. Before conducting a rigorous comparison, simple visual comparisons were carried out using Python coding and operational tools. Several ESG ETFs were selected, and several Shanghai and Shenzhen 300 Index ETFs were averaged. By calculating the cumulative returns within the same up-and-down cycle, the trend in cumulative returns between ESG ETFs and Shanghai and Shenzhen 300 Index ETFs can be intuitively assessed. The Python code will be retained in the appendix of this document.
Based on the content of the literature review, it is evident that the evaluation systems for ESG ETFs are diverse at present: statistical analyses based on the market performance of ESG ETFs have generally produced positive evaluations, while evaluations of ESG ETFs using common financial tools such as the Fama-French model tend to be relatively neutral or negative. This divergence in evaluation can be attributed to several factors:
1)In recent years, the impact of events like the pandemic has created volatility in global financial markets. Consequently, many common financial products, including ESG ETFs, have generally yielded negative returns. In this environment, statistical analysis is more favourable to ESG ETFs.
2)The impact of global events like the pandemic on financial products has been indiscriminate. Therefore, from the perspective of traditional financial evaluation systems, ESG ETFs do not appear significantly different from conventional ETFs in many metrics.
3)The ESG concept is relatively new, and its market acceptance is still developing. Investor confidence in ESG ETFs may be relatively low, making evaluations using metrics typical of mature financial products potentially prone to errors.
It's evident that the current market and academic evaluation standards for ETF performance fall into two categories. The first emphasizes standard financial metrics such as net asset value, risk, return, expense ratio, tracking error, variability of returns, and differential returns. Statistical tools like standard deviation, Beta, Alpha, R-squared, and the Sharpe ratio [18] are used for data analysis. The other approach places more emphasis on analyzing ETF market performance, evident in cross-comparisons. A representative evaluation system is the ETF Efficiency Indicator developed by Lyxor [19], which has three dimensions: maximizing excess returns, minimizing trading costs, and minimizing tracking error. In practice, both evaluation dimensions have their reference value.
This article aims to provide evidence for one of the viewpoints presented in the literature review and discuss the reasons for such results in subsequent analyses. Therefore, in evaluating ETFs, this article employs metrics such as annualized volatility, daily average returns, Sharpe ratio, information ratio, and tracking error to measure different aspects of ETFs, aiming to encompass a more comprehensive evaluation of ETF performance.
4. Data
This article selected several ESG ETFs and Shanghai and Shenzhen 300 Index ETFs from among the numerous ETFs listed in mainland China.
4.1. ESG ETFs
ESG ETFs were chosen from ETF products under the China Securities Index (CSI) and GuoZi Index, both of which are dedicated to ESG initiatives in China. The CSI ESG business aims to establish ESG standards in China, promote best ESG practices, and provide diverse services to the market, including ESG assessments, data, indices, and comprehensive solutions. GuoZi Index has developed over 170 index-based products, including ETFs. These two indices cover the Shanghai and Shenzhen indices and are highly authoritative and recognized. As pioneers in the ESG field in the mainland Chinese market, CSI and GuoZi indices are representative in their products. As shown in Table 1, the ESG ETFs we selected come from the above two indexes.
Table 1: ESG ETF list.
Code | Name of ETF | Launch date |
159621 | Guotai MSCI China A ESG Universal ETF | 2022-8-30 |
159633 | E Fund CSI 1000 ETF | 2022-7-28 |
159717 | Penghua CNI ESG 300 ETF | 2021-9-15 |
159791 | ChinaAMC CSI 300 ESG Index ETF | 2022-2-24 |
510990 | ICBCCS CSI 180 ESG Index ETF | 2021-6-28 |
516720 | AXA-SPDB CSI ESG 120 Strategy ETF | 2021-7-22 |
516830 | Fullgoal CSI 300 ESG Index ETF | 2021-6-24 |
560180 | CSI 300 Esg Index Etf | 2023-4-13 |
561900 | CMF CSI 300 Esg Etf | 2021-7-06 |
4.2. Shanghai and Shenzhen 300 Index ETFs
The Shanghai and Shenzhen 300 Index (Abbreviated as CSI 300 Index) is one of the most important indices in the mainland Chinese market, characterized by the following features:
1)Strong Market Representation, Covering Core A-Share Assets: The Shanghai and Shenzhen 300 Index consists of the most representative 300 stocks with large market capitalization and good liquidity from the A-shares of the Shanghai and Shenzhen stock exchanges. It has a high level of market representation. As of December 31, 2019, the number of constituent stocks in the Shanghai and Shenzhen 300 Index accounted for only about 8% of the total number of A-shares, but its total market capitalization exceeded CNY 38.98 trillion, accounting for nearly 60% of the total market capitalization of all A-shares. Its free float market capitalization was CNY 13.30 trillion, representing 54% of the total.
2)Long-Term Performance Superior to Other Broad-Based Indices: Whether in the medium to long term or the short term, the Shanghai and Shenzhen 300 Index has consistently exhibited excellent performance compared to other broad-based indices. In terms of risk control, its risk-adjusted performance over the past five years has been the best.
Therefore, selecting ETF products that track the Shanghai and Shenzhen 300 Index helps represent the major market trends and movements in mainland China to a certain extent, enhancing the reliability of the overall comparison.
Currently, there are over 150 ETF products in the mainland Chinese market that track the Shanghai and Shenzhen 300 Index. As shown in Table 2, after considering factors such as establishment date, trading volume, and cumulative returns, the article selected the following four Shanghai and Shenzhen 300 Index ETF products with the largest scale, best cumulative returns, and longest establishment history.
Table 2: Shanghai and Shenzhen 300 Index ETF list.
Code | Name of ETF | Launch date |
159919 | Harvest CSI 300 ETF | 2012-05-07 |
510300 | Huatai-PineBridge CSI 300 ETF | 2012-05-04 |
510310 | E Fund Seeded CSI 300 ETF | 2013-03-06 |
510330 | ChinaAMC CSI 300 ET | 2012-12-25 |
4.3. Visualization of Cumulative Returns
Randomly selected 561900, 516720, and 516830 were used to calculate the cumulative returns for single up or down cycles as well as the average cumulative returns of the four Shanghai and Shenzhen 300 Index ETFs over a one-year time period. A line chart was created to visualize the cumulative returns (as shown in Figure 1, the red color is the ESG ETFs and blue color is the the Shanghai and Shenzhen 300 Index). From the visual representation of cumulative returns, the following patterns can be roughly observed: ESG ETFs have lower cumulative gains compared to the average cumulative gains of the Shanghai and Shenzhen 300 Index ETFs, but their cumulative losses are slightly better than those of the Shanghai and Shenzhen 300 Index ETFs. In simple terms, ESG ETFs may have a certain advantage in risk mitigation.
By obtaining the one-year data for the above-mentioned ETFs from the Wind database and Bloomberg Financial Terminal (if the data is for less than a year, annualization is calculated based on actual dates), the daily ETF returns were first calculated using a compounded method.
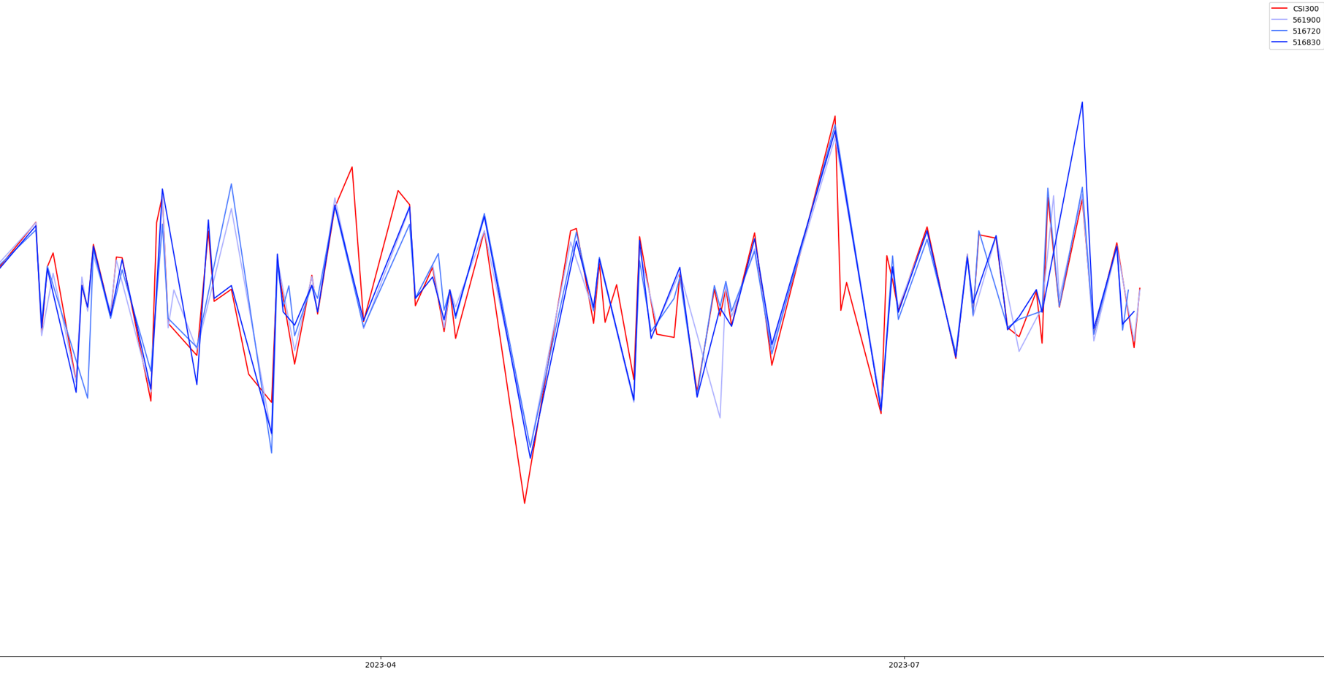
Figure 1: Cumulative increase or decrease in a single up or down cycle (partial).
4.4. Detailed Data
4.4.1. Risk Valuation
Using one year's worth of data for the above ETFs obtained from the Wind database and Bloomberg Financial Terminal (annualized to the actual date if less than one year), the daily ETF returns are first calculated on a compounded basis:
\( {r_{i}}=ln{(\frac{{p_{i}}}{{p_{i-1}}})}\ \ \ (1) \)
Where \( {r_{i}} \) is the daily rate of return of the ETF under the daily compound interest calculation method, \( {p_{i}} \) is the closing price of the ETF on the day, and \( {p_{i-1}} \) is the closing price of the ETF on the previous day.
The standard deviation of daily returns is:
\( s=\sqrt[]{\frac{1}{n-1}\sum _{i=1}^{n}u_{i}^{2}-{\frac{1}{n(n-1)}(\sum _{i=1}^{n}{u_{i}})^{2}}}\ \ \ (2) \)
Finally, the annualized volatility is estimated based on different lengths of time.
\( \frac{σ}{\sqrt[]{2n}}\ \ \ (3) \)
\( σ=s\sqrt[]{252}\ \ \ (4) \)
4.4.1.1. Results of ESG ETFs
Table 3: ESG ETFs.
Code | Standard deviation of daily return/% | Annualized volatility/% | Daily average return/% |
159621 | 0.943749 | 0.491794 | -0.03907 |
159633 | 0.769384 | 0.84686 | -0.06186 |
159717 | 0.997653 | 0.718392 | -0.03145 |
159791 | 1.100272 | 0.651836 | -0.02999 |
510990 | 0.973623 | 0.701088 | -0.01821 |
516720 | 0.959001 | 0.69056 | -0.01875 |
516830 | 0.970324 | 0.698713 | -0.02615 |
560180 | 0.876480 | 1.067131 | -0.06675 |
561900 | 0.970404 | 0.697337 | -0.0285 |
4.4.1.2. Results of Shanghai and Shenzhen 300 Index ETFs
Table 4: Shanghai and Shenzhen 300 Index ETFs.
Code | Standard deviation of daily return/% | Annualized volatility/% | Daily average return/% |
159919 | 0.943749 | 0.491794 | -0.03907 |
510300 | 0.769384 | 0.84686 | -0.06186 |
510310 | 0.997653 | 0.718392 | -0.03145 |
510330 | 1.100272 | 0.651836 | -0.02999 |
The results of ESG ETFs and the Shanghai and Shenzhen 300 Index ETFs are as shown in Table 3 & 4. In order to make the results more obvious, we did the following visualization processing.
It's evident from the preliminary analysis (as shown in Figure 2) that within the range of 0.6% to 0.8% annualized volatility, seven ESG ETFs exhibit a superior combination of annualized volatility and daily average returns compared to two of the selected four Shanghai and Shenzhen 300 Index ETFs.
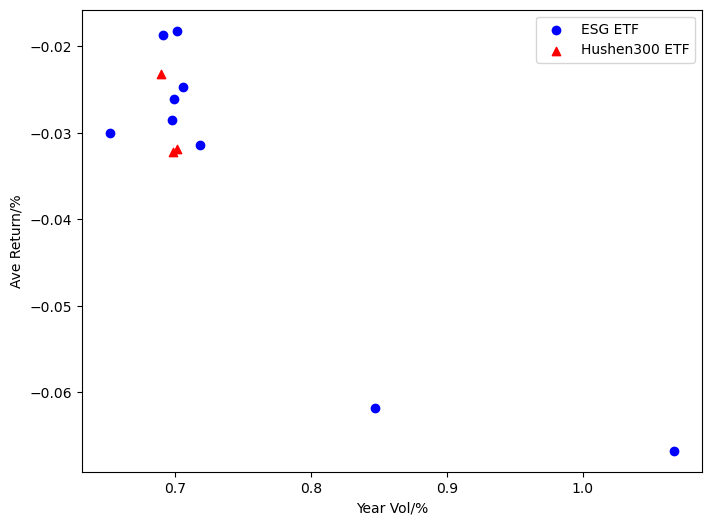
Figure 2: Annualized Volatility-Daily Average Return Scatter Plot.
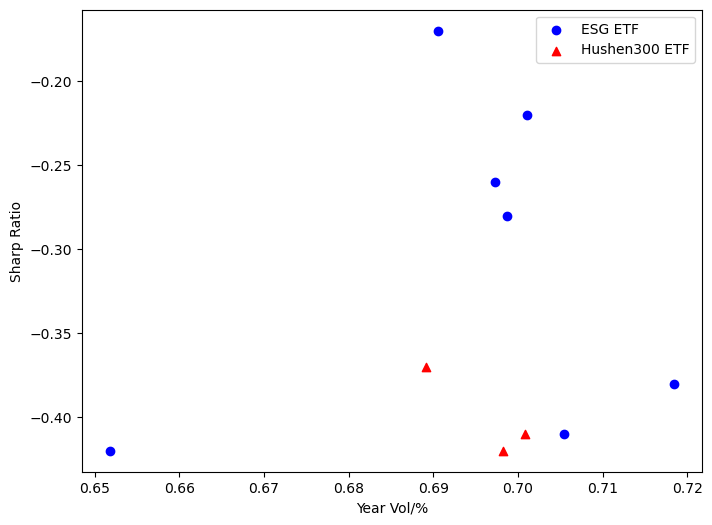
Figure 3: Annualized Volatility-Sharpe Ratio Scatter Plot.
4.4.2. The Correlation between Risk and other Data
Based on the core idea of this article, the Sharpe ratio, Information ratio, and tracking error have been selected as the factors to consider.
In summary, the Sharpe ratio focuses on risk-adjusted returns, the Information ratio assesses active management capabilities, and tracking error measures the proximity between the ETF and the benchmark index. Therefore, it is possible to compare whether there are certain advantages in terms of risk and return using the "annual volatility - selected indicator" method.
The data below (shown as Table 5 & 6) has been obtained through the Wind database and Bloomberg Financial Terminal. Some data could not be found due to missing reports or limitations in information disclosure.
4.4.2.1. Results of ESG ETFs
Table 5: ESG ETFs.
Code | Sharp Ratio | Information Ratio | Tracking Error |
159621 | -0.42 | ||
159633 | |||
159717 | -0.38 | 0.21 | 0.66% |
159791 | -0.42 | 0.08 | 0.67% |
510990 | -0.22 | 0.19 | 0.75% |
516720 | -0.17 | 0.08 | 0.87% |
516830 | -0.28 | 0.34 | 0.55% |
560180 | |||
561900 | -0.26 | 0.34 | 0.50% |
4.4.2.2. Results of Shanghai and Shenzhen 300 Index ETFs
Table 6: Shanghai and Shenzhen 300 Index ETFs.
Code | Sharp Ratio | Information Ratio | Tracking Error |
159919 | -0.41 | 0.31 | 0.41% |
510330 | -0.41 | 0.30 | 0.42% |
510310 | -0.37 | 0.38 | 0.41% |
510300 | -0.42 | 0.27 | 0.44% |
Using visualizations provides an intuitive way to make comparisons.
4.4.3. From the Sharpe Ratio Perspective
Based on the definition of the Sharpe ratio (as shown in Figure 3), it can be concluded that when the Sharpe ratio is negative, it lacks meaningful comparison, and thus, it's not possible to compare the superiority or inferiority of the two types of ETFs.
4.4.4. From the Information Ratio Perspective
The Information Ratio (as shown in Figure 4) is used to measure excess returns under active risk. Through the images, it can be visually observed that within the annual volatility range of 0.69% to 0.71%, the overall Information Ratio of the Shanghai and Shenzhen 300 Index ETFs outperforms that of ESG ETFs, indicating that ESG ETFs do not exhibit an advantage in excess returns.
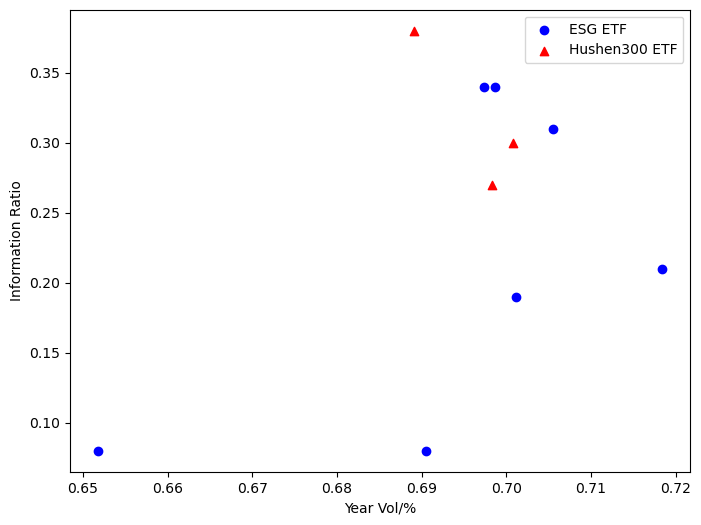
Figure 4: Annualized Volatility-Information Ratio Scatter Plot
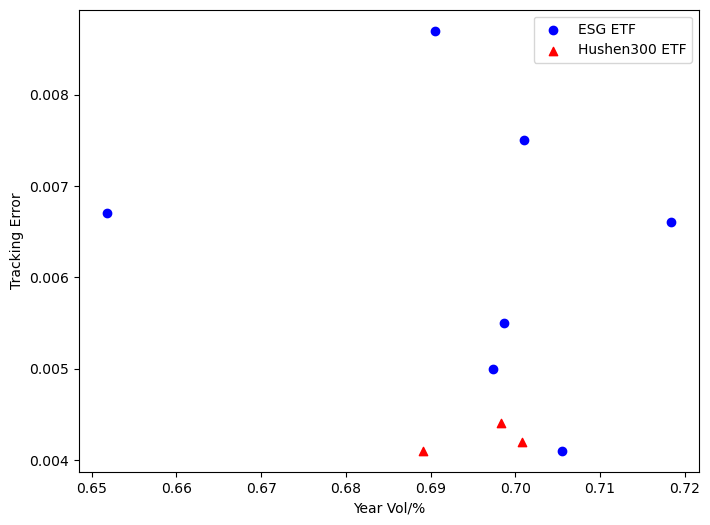
Figure 5: Annualized Volatility-Tracking Error Scatter Plot.
4.4.5. From the Tracking Error Perspective
It's evident that in terms of tracking error(as shown in Figure 5), ESG ETFs are outperformed comprehensively by the Shanghai and Shenzhen 300 Index ETFs. This indirectly reflects that ESG ETFs, as emerging products, have a relatively poor performance in tracking their benchmark indices. There is still a long way to go for ESG ETFs to match the Shanghai and Shenzhen 300 Index ETFs in terms of tracking error.
5. Result and Discussion
5.1. Theoretically, can ESG ETFs have an advantage over the Shanghai and Shenzhen 300 Index ETFs?
5.1.1. The Impact of Investor Sentiment on Stock Prices
As found by Baker and Wurgler [20], investor sentiment significantly influences the pricing of US stocks, with higher current sentiment leading to lower returns. Corredor [21] et al. revealed the role of investor sentiment in pricing in French, German, Spanish, and UK stock markets, explaining price volatility under arbitrage constraints. Xu Yihan and Green [22], using data from Chinese A-shares, found that sentiment helps explain mispricing in the Fama-French model and the time-varying nature of factors. Studies indicate that, controlling for the Fama-French three factors and macroeconomic variables, investor sentiment has a significant impact on both A-share and H-share markets during the same period. In other words, when sentiment is high, stock prices rise, and vice versa. Additionally, investor sentiment has significant reversal predictions for the future 12-month returns in the A-share market and the future 6-month returns in the H-share market, indicating that the influence of investor sentiment on Mainland China's stock market lasts longer. Since both ESG300 and the Shanghai and Shenzhen 300 Index ETFs essentially track A-shares, they would be influenced by investor sentiment.
5.1.2. The Theoretical Advantages of ESG ETFs
In theory, ESG ETFs should have certain advantages in weathering market risks for several reasons:
5.1.2.1. Long-Term Sustainability
ESG investments focus on a company's performance in environmental, social, and governance aspects, meaning they select companies more likely to sustain robust operations in the future. This long-term sustainability orientation encourages investors to hold these funds rather than engage in frequent trading, reducing instability caused by short-term sentiment fluctuations.
5.1.2.2. Risk Management
ESG assessments cover risks in environmental, social, and governance areas. This means ESG ETFs typically favor companies that manage these risks better. This helps lower the overall risk of the portfolio, as companies performing well in these critical areas may reduce future uncertainties.
5.1.2.3. Investor Demand
With increasing societal interest in sustainability and ethical investing, ESG ETFs are becoming more popular. Investor demand can lead to more funds flowing into these ETFs, providing greater liquidity and support, reducing price volatility.
5.1.2.4. Long-Term Value
ESG factors contribute to the realization of a company's long-term value, not just short-term profits. This attracts more long-term investors who are concerned with a company's long-term health rather than short-term market fluctuations, contributing to market stability.
5.1.2.5. Avoiding Unethical Risks
ESG investments also help avoid risks associated with unethical or controversial behavior. This includes avoiding support for industries or companies with adverse impacts, reducing both moral and legal risks in the portfolio.
5.2. Data Analysis
Based on the data obtained in the previous sections, we can draw the following preliminary conclusions:
1)In the past year, ESG ETFs in the Mainland Chinese market have exhibited annualized volatility in the range of 0.6% to 0.8%. Among the selected ESG ETFs, 7 of them have shown daily average returns better than the 2 chosen Shanghai and Shenzhen 300 Index ETFs, accounting for 50% of the selected index ETFs. This suggests that within a similar annualized volatility range, ESG ETFs have performed competitively and slightly better than the Shanghai and Shenzhen 300 Index ETFs.
2)Regarding the Sharpe ratio, all ETFs have negative values, which lack meaningful comparisons, making it impossible to distinguish superiority.
3)In terms of the Information ratio, within the annual volatility range of 0.69% to 0.71%, the overall Information ratio of the Shanghai and Shenzhen 300 Index ETFs has outperformed the ESG ETFs, indicating that ESG ETFs have not gained a significant advantage in terms of excess returns.
4)In terms of tracking error, ESG ETFs have performed significantly worse than the Shanghai and Shenzhen 300 Index ETFs.
In summary, the current data suggests that ESG ETFs and conventional ETFs have their respective strengths and weaknesses. ESG ETFs demonstrate a slight advantage in risk resistance when returns are negative, but in many other aspects, their performance falls behind that of the Shanghai and Shenzhen 300 Index ETFs. Therefore, the data supports the conclusion that "ESG ETFs do not significantly differ in performance from conventional ETFs."
5.3. Reasons for the Analysis
Several reasons can explain why the conclusion that "ESG ETFs do not significantly differ in performance from conventional ETFs" holds true in the Mainland Chinese market:
5.3.1. Lack of Clear Definition for ESG ETFs in the Chinese Mainland Market
The Chinese domestic market has not established a clear definition for ESG ETFs, and there is a lack of standardized official ESG asset management product criteria. Most ESG ETFs in the domestic public offering market mainly focus on the broad ESG theme. Funds with explicit ESG evaluation criteria in their investment strategies are limited, indicating that the actual application of ESG screening, integration, and shareholder engagement strategies is scarce. In the early stages of ESG development, many asset management institutions simply employ negative screening strategies for responsible investment.
5.3.2. Lack of Uniform ESG Information Disclosure Standards for Listed Companies
China has yet to issue comprehensive ESG-related legal documents, primarily enacting regulations related to environmental protection and social responsibility. The China Securities Regulatory Commission (CSRC) and the Shanghai and Shenzhen Stock Exchanges are currently in a voluntary disclosure stage regarding ESG information disclosure by companies. There are no detailed, referenceable disclosure standard instructions for format, indicator systems, operational procedures, etc. This leads to diverse forms of corporate disclosure, a lack of quantification, challenges in structuring information, low reliability of ESG key issue data, and poor overall comparability.
5.3.3. Low Correlation of ESG Ratings for Listed Companies
Several ESG rating agencies both domestically and internationally provide ESG ratings for the same listed company with low correlation, making it challenging to effectively reflect a company's true ESG performance. The weak data foundation supporting the ESG evaluation system is due to difficulties in obtaining ESG-related information for listed companies, incomplete or unreliable information, inconsistencies in cross-asset class data, and a lack of standardized ESG information disclosure guidelines. Additionally, some ESG information is highly dynamic and unstructured, posing significant technical challenges in data collection and application.
Based on the above analysis, it is suggested that when the ESG-related system and concepts in the Mainland Chinese market mature, they should generally exhibit a phenomenon where "ESG ETFs offer less excess positive returns than conventional ETFs but have superior risk resistance."
6. Conclusion
This article, based on current academic research on ESG ETFs, categorizes mainstream academic viewpoints into three categories: ESG ETFs perform significantly better or partially better than conventional ETFs, ESG ETFs show no significant difference in performance compared to conventional ETFs, and ESG ETFs underperform conventional ETFs. Based on this, it proposes a methodology for studying the performance differences between ESG ETFs and conventional ETFs: when evaluating ETFs, use indicators such as annualized volatility, daily average returns, Sharpe ratio, Information ratio, and tracking error to assess different aspects of ETFs' risk and returns, aiming to provide a more comprehensive evaluation of ETF performance.
In this article, a comparison is made between ESG ETFs and Shanghai and Shenzhen 300 Index ETFs in the Mainland Chinese market using this methodology, resulting in the following conclusions:
1)In the past year, ESG ETFs in the Mainland Chinese market, within an annualized volatility range of 0.6% to 0.8%, had daily average returns that outperformed 7 of the selected ESG ETFs compared to 2 chosen Shanghai and Shenzhen 300 Index ETFs. This accounts for 50% of the selected index ETFs, suggesting that within a similar annualized volatility range, ESG ETFs' performance is competitive and slightly better than Shanghai and Shenzhen 300 Index ETFs.
2)Regarding the Sharpe ratio, all ETFs had negative Sharpe ratios, which lack meaningful comparisons and, therefore, do not allow for differentiation between superiority and inferiority.
3)In terms of the Information ratio, within an annual volatility range of 0.69% to 0.71%, the overall Information ratio of the Shanghai and Shenzhen 300 Index ETFs outperformed the ESG ETFs. This indicates that ESG ETFs have not gained a significant advantage in terms of excess returns.
4)In tracking error, ESG ETFs' performance was significantly worse than that of Shanghai and Shenzhen 300 Index ETFs.
For the future development of ESG ETFs, the article suggests the following:
1)Clearly define the concept of ESG to support product improvement.
2)Establish unified ESG evaluation standards and information disclosure mechanisms.
References
[1]. Elton E J, Gruber M J, De Souza A. Passive mutual funds and ETFs: Performance and comparison[J]. Journal of banking & finance,2019, 106:265-275.
[2]. Dumitrescu A, Järvinen J, Zakriya M. Hidden Gem or Fool’s Gold: Can passive ESG ETFs outperform the benchmarks? [J]. International Review of Financial Analysis,2023,86:102540.
[3]. Nguyen H. COVID-19: PERFORMANCE OF ESG ETFS AND, ESG ETFS VS. THEIR DECLARED INDEXES[J]. Applied Finance Letters, 2023, 12(1): 33-43.
[4]. Pavlova I, de Boyrie M E. ESG ETFs and the COVID-19 stock market crash of 2020: Did clean funds fare better?[J]. Finance Research Letters, 2022, 44: 102051.
[5]. Naffa H, Fain M. Performance measurement of ESG-themed megatrend investments in global equity markets using pure factor portfolios methodology[J]. PloS one, 2020, 15(12): e0244225.
[6]. Khandji A. A Risk & Return Analysis of ESG Focused ETFs[J]. 2022.
[7]. Strignert A, Malm E. ESG Investing through ETFs-An effective way to circumvent volatility?[J]. 2021.
[8]. Strignert A, Malm E. ESG Investing through ETFs-An effective way to circumvent volatility?[J]. 2021.
[9]. Fiordelisi F, Galloppo G, Lattanzio G, et al. An ESG ratings free assessment of socially responsible investment strategies[J]. Available at SSRN 3743802, 2020.
[10]. Milonas N, Rompotis G, Moutzouris C. The performance of ESG funds vis-à-vis non-ESG funds[J]. The Journal of Impact and ESG Investing, 2022, 2(4): 96-115.
[11]. Takahashi H, Yamada K. When the Japanese stock market meets COVID-19: Impact of ownership, China and US exposure, and ESG channels[J]. International Review of Financial Analysis, 2021, 74: 101670.
[12]. Yu G, Liu Y, Cheng W, et al. Data analysis of ESG stocks in the Chinese Stock Market based on machine learning[C]//2022 2nd International Conference on Consumer Electronics and Computer Engineering (ICCECE). IEEE, 2022: 486-493.
[13]. Curtis Q, Fisch J, Robertson A Z. Do ESG mutual funds deliver on their promises?[J]. Mich. L. Rev., 2021, 120: 393.
[14]. Cultice R. Do Socially Conscious ETFs Match their Active Counterparts?[J]. 2019.
[15]. Figueiredo M P. THE ESG FACTOR IMPACT OF ESG CRITERIA ADOPTION ON STOCK RETURNS AND VOLATILITY[J]. 2022.
[16]. Kanuri S. Risk and return characteristics of environmental, social, and governance (ESG) equity ETFs[J]. The Journal of Beta Investment Strategies, 2020, 11(2): 66-75.
[17]. Rompotis G G. The ESG ETFs in the UK[J]. Journal of Asset Management, 2022, 23(2): 114-129.
[18]. Athma P, Kumar K R. ETF vis-à-vis index funds: An evaluation[J]. Asia Pacific Journal of Research in Business Management, 2011, 2(1): 188-205.
[19]. Drenovak M, Urošević B, Jelic R. European bond ETFs: Tracking errors and the sovereign debt crisis[J]. European Financial Management, 2014, 20(5): 958-994.
[20]. Baker M, Wurgler J. Investor sentiment and the cross‐section of stock returns[J]. The journal of Finance, 2006, 61(4): 1645-1680.
[21]. Corredor P, Ferrer E, Santamaria R. Investor sentiment effect in stock markets: Stock characteristics or country-specific factors?[J]. International Review of Economics & Finance, 2013, 27: 572-591.
[22]. Xu Y, Green C J. Asset pricing with investor sentiment: Evidence from Chinese stock markets[J]. The Manchester School, 2013, 81(1): 1-32.
Cite this article
Feng,T. (2024). Performance Analysis and Prospects of ESG Exchange-Traded Funds in the Mainland Chinese Market. Advances in Economics, Management and Political Sciences,97,95-109.
Data availability
The datasets used and/or analyzed during the current study will be available from the authors upon reasonable request.
Disclaimer/Publisher's Note
The statements, opinions and data contained in all publications are solely those of the individual author(s) and contributor(s) and not of EWA Publishing and/or the editor(s). EWA Publishing and/or the editor(s) disclaim responsibility for any injury to people or property resulting from any ideas, methods, instructions or products referred to in the content.
About volume
Volume title: Proceedings of the 2nd International Conference on Financial Technology and Business Analysis
© 2024 by the author(s). Licensee EWA Publishing, Oxford, UK. This article is an open access article distributed under the terms and
conditions of the Creative Commons Attribution (CC BY) license. Authors who
publish this series agree to the following terms:
1. Authors retain copyright and grant the series right of first publication with the work simultaneously licensed under a Creative Commons
Attribution License that allows others to share the work with an acknowledgment of the work's authorship and initial publication in this
series.
2. Authors are able to enter into separate, additional contractual arrangements for the non-exclusive distribution of the series's published
version of the work (e.g., post it to an institutional repository or publish it in a book), with an acknowledgment of its initial
publication in this series.
3. Authors are permitted and encouraged to post their work online (e.g., in institutional repositories or on their website) prior to and
during the submission process, as it can lead to productive exchanges, as well as earlier and greater citation of published work (See
Open access policy for details).
References
[1]. Elton E J, Gruber M J, De Souza A. Passive mutual funds and ETFs: Performance and comparison[J]. Journal of banking & finance,2019, 106:265-275.
[2]. Dumitrescu A, Järvinen J, Zakriya M. Hidden Gem or Fool’s Gold: Can passive ESG ETFs outperform the benchmarks? [J]. International Review of Financial Analysis,2023,86:102540.
[3]. Nguyen H. COVID-19: PERFORMANCE OF ESG ETFS AND, ESG ETFS VS. THEIR DECLARED INDEXES[J]. Applied Finance Letters, 2023, 12(1): 33-43.
[4]. Pavlova I, de Boyrie M E. ESG ETFs and the COVID-19 stock market crash of 2020: Did clean funds fare better?[J]. Finance Research Letters, 2022, 44: 102051.
[5]. Naffa H, Fain M. Performance measurement of ESG-themed megatrend investments in global equity markets using pure factor portfolios methodology[J]. PloS one, 2020, 15(12): e0244225.
[6]. Khandji A. A Risk & Return Analysis of ESG Focused ETFs[J]. 2022.
[7]. Strignert A, Malm E. ESG Investing through ETFs-An effective way to circumvent volatility?[J]. 2021.
[8]. Strignert A, Malm E. ESG Investing through ETFs-An effective way to circumvent volatility?[J]. 2021.
[9]. Fiordelisi F, Galloppo G, Lattanzio G, et al. An ESG ratings free assessment of socially responsible investment strategies[J]. Available at SSRN 3743802, 2020.
[10]. Milonas N, Rompotis G, Moutzouris C. The performance of ESG funds vis-à-vis non-ESG funds[J]. The Journal of Impact and ESG Investing, 2022, 2(4): 96-115.
[11]. Takahashi H, Yamada K. When the Japanese stock market meets COVID-19: Impact of ownership, China and US exposure, and ESG channels[J]. International Review of Financial Analysis, 2021, 74: 101670.
[12]. Yu G, Liu Y, Cheng W, et al. Data analysis of ESG stocks in the Chinese Stock Market based on machine learning[C]//2022 2nd International Conference on Consumer Electronics and Computer Engineering (ICCECE). IEEE, 2022: 486-493.
[13]. Curtis Q, Fisch J, Robertson A Z. Do ESG mutual funds deliver on their promises?[J]. Mich. L. Rev., 2021, 120: 393.
[14]. Cultice R. Do Socially Conscious ETFs Match their Active Counterparts?[J]. 2019.
[15]. Figueiredo M P. THE ESG FACTOR IMPACT OF ESG CRITERIA ADOPTION ON STOCK RETURNS AND VOLATILITY[J]. 2022.
[16]. Kanuri S. Risk and return characteristics of environmental, social, and governance (ESG) equity ETFs[J]. The Journal of Beta Investment Strategies, 2020, 11(2): 66-75.
[17]. Rompotis G G. The ESG ETFs in the UK[J]. Journal of Asset Management, 2022, 23(2): 114-129.
[18]. Athma P, Kumar K R. ETF vis-à-vis index funds: An evaluation[J]. Asia Pacific Journal of Research in Business Management, 2011, 2(1): 188-205.
[19]. Drenovak M, Urošević B, Jelic R. European bond ETFs: Tracking errors and the sovereign debt crisis[J]. European Financial Management, 2014, 20(5): 958-994.
[20]. Baker M, Wurgler J. Investor sentiment and the cross‐section of stock returns[J]. The journal of Finance, 2006, 61(4): 1645-1680.
[21]. Corredor P, Ferrer E, Santamaria R. Investor sentiment effect in stock markets: Stock characteristics or country-specific factors?[J]. International Review of Economics & Finance, 2013, 27: 572-591.
[22]. Xu Y, Green C J. Asset pricing with investor sentiment: Evidence from Chinese stock markets[J]. The Manchester School, 2013, 81(1): 1-32.