


1. Introduction
Marketing strategies are comprehensive plans that businesses designed for themselves to promote their sales revenue or services, have competitiveness power against their competitors, and at the same time achieve specific profit maximizations as their business goal [1]. To effectively market and promote offerings to potential customers, companies are willing to do whatever it takes making full use of their resources.
With the advancement of science and technology, data analysis algorithms can combine quantitative and qualitative variables to give analysis results that cannot be obtained by humans. Keen businessmen are not letting go of this tool for better resource utilization, as it has enabled them to better manage their resources and maximize profits. That is the reason why information technologies have been widely used to marketing strategies in the digital age, including customer segmentation and personalization.
Market segmentation can be defined as dividing a market into distinct groups of customers, with different needs, characteristics, or behavior, who might require separate products or who may respond differently to various combinations of marketing efforts [2][3]. In the market, segmentation allows them to use different characteristics, such as needs, wants, personal preferences, or categories based on the target audience. This approach allows businesses to create more personalized and effective marketing strategies, as well as optimize resource allocation. By using data analysis, the business could make valuable decisions from database collected from the market to identify consumer behaviors and to create meaningful segments. These segments can range from demographic and geographic categories to more complex psychographic and behavioral clusters. Businesses may better target their marketing and offers to each group by identifying these categories. Offering the correct goods and services to the right clients at the appropriate time and location is the philosophy behind customization.
Personalization is the most extreme form of customer segmentation, and each segment has only one customer [4]. Using information about a consumer's interests, activities, and past purchases, personalization entails creating marketing messages, goods, services, and experiences specifically for that customer. Personalization enables the brand to engage with the consumer in a way that is more pertinent and compelling, which raises customer happiness, loyalty, and conversion rates.
Although the data analysis methods have played a crucial role in customer segmentation and personalization, Review papers are still needed to summarize the application of data analysis in the real world. In the following sections, this essay will delve into the intricate relationship between data analysis, customer segmentation, and personalization in the realm of marketing, principle of data analysis, specific methods that are applied in the real-world examples and the discussion about advantages, disadvantages, and ethical issues.
2. Data Analysis
2.1. Descriptive Data analysis
Descriptive Statistics gives numerical and graphic procedures to summarize a collection of data in a clear and understandable way [5]. It may be used to compare samples from different studies, summarize the data in order to describe what happened in the sample, and assist researchers in identifying sample characteristics that can affect their findings. Descriptive data analysis is powerful and capable of performing a wide range of tasks. [6].
Frequency distribution is often used to analyze data at the beginning. The measure of central tendency describes the center of a distribution and achieve the goal of “describe” data in descriptive data analysis. There are three major types of estimates of central tendency: mean, median and mode. Mean is calculated by summing all the values and divided by the number of values. It is most common measure of central tendency. Median is the value that exactly lies at the middle of the dataset. Mode is the most frequently occurring value in the dataset [6].
These metrics, however, do not convey a dataset's variability. A bell-shaped normal distribution is frequently stated as having a middle that lies precisely in the center of the distribution. Additionally, the distribution's tails (sides) are symmetric. Range is one metric for variability. Range is the distinction between the highest and lowest values. Outliers or measurements that differ significantly from the remainder of the sample can dramatically affect the range. Standard deviation is a measure of variability that reduces the impact of outliers. The variation of all the measurements in a sample is calculated mathematically as the standard deviation. The standard deviation can be viewed as the average distance from the mean that each of the values lies [5].
2.2. Predictive Data Analysis
Predictive analytics is about using the information of the past to understand the likely occurrence of the future [7]. Predictive data analysis involves several steps to obtain the goal. Firstly, data analysts collect the requirements and data that is going to be analyzed. Secondly, analysts transform the data to make it more suitable for analysis. Then use techniques from statistics and machine learning to analyze. Finally, analysts conclude the most suitable model and make their predictions [8].
Neural networks are one of the most popular models and techniques used in predictive analytics. An artificial neural network (ANN) is a system of synthetic neurons based on biological neurons that can analyze input signals and generate output in a manner similar to the human nervous system [9]. Artificial neural networks are a powerful technology used by applications for predictive analytics to learn from sample datasets and make predictions on new data. Before sending the input patterns from the training data to the hidden layer of the neuron vectors, the network's input layer analyzes them. Depending on the required output, neurons employ various activation functions. One neuron's output is sent to the neurons in the layer below it. A forecast for new data can be made using the output layer's accumulated output.
Artificial neural networks are a powerful technology used by applications for predictive analytics to learn from sample datasets and make predictions on new data. Before sending the input patterns from the training data to the hidden layer of the neuron vectors, the network's input layer analyzes them. Depending on the required output, neurons employ various activation functions. One neuron's output is sent to the neurons in the layer below it. A forecast for new data can be made using the output layer's accumulated output [8].
3. Customer segmentation
As we brought out the definition of customer segmentation previously, in this chapter we would further discuss various of ways to separate potential customers into different groups by different characteristics [10].
3.1. Why we need customer segmentation?
Before we imply customer segmentation in our retailing market, the very first question we should have for ourselves is that: What is our target? That means we need to understand why we need customer segmentation for selling more products in the market. For example, the short time target could vary from increase in new customers or attracting customers who had already bought products to buy again. On the other hand, if the producer is willing to sell more specific product, then the way to separate customers may be the most important concept for the producer to consider. They need to consider which kind of people would be the most willingly product buyers. Then, after deliberating the recent target, producers usually start to separate their potential customers by their characteristics.
3.2. Typical ways of customer segmentation
In the e-commerce market, we usually have some typical models to carry out customer segmentation: demographic, geographic, behavioral, technographic, psychographic, firmographic, needs-based, and value-based [11]. As the decision-maker considers how to go about selling products and services, they speculate about what type of method will maximize their profit in retailing. In the retailing market, especially in the e-commerce, when people and companies use online promotions and advertisement as an incentive, most of the data are collected by the electronic business platform. For demographic segmentation of the customers, it usually considers all the characteristics including the income, age, education level, etc. These characteristics mostly give a hand for all the brands to decide which group of people they would sell to. By giving the example of a sneaker retailing company, they would pop a $1000 sneaker to a man who has a salary of $20000 per month. Oppositely, the website would send a lower value sneaker to a lower salary owner. By using the psychological segmentation, the companies could analyze how the customers react to the recent climate change or some urgent environmental issues since the environment problems now is a key concept among the worlds. Another segmentation business may use in the e-commerce is the firmographic, which is to separate the customers by their ages and how their preference being separated. These would help the decision makers have a clearer view of which stage their potential customers are in and what are their necessary demands in the specific time. In the later section, we would mainly focus on analyzing the E-commerce data collected by the case, which basically is separated by two parts-inner data and outer data set. The inner data mostly includes the customer information and the purchase history. In contrast, the outer data includes the cookies people saved, the service dairy, and the investigation data [12]. By giving the example of Taobao, purchase history and preferred social media platform usage. If you want to send reminders or sales emails to regular or repeat online buyers, you can target ads on a particular social media platform. And the price is related to your personal habit.
4. Personalization
We have mentioned the definition of personalization in the previous section, and in this chapter, we will discuss in more depth how personalization uses data analytics to achieve extreme customer segmentation. Meanwhile, this chapter reviews past research on personalization and some different methods of personalization in particle.
4.1. Why we need personalization?
What comes first is that we will define personalization further, personalization is a key component of an interactive marketing strategy. It can make standardized goods or services more in line with the needs of individual customers, so that producers can obtain more profits, and let consumers have a better consumption experience. This goal fits nicely into traditional notions of segmentation [13]. Furthermore, we will mention another term—information overload. The definition of information overload is that we are in the era of information explosion or, as Shenk puts it, we are surrounded by data smog — an expression for the muck of the information age [14]. With the explosive growth of information, it is difficult for users to find content that they are interested in, and personalization can be filtered through algorithms, that is data analysis, to provide consumers with more accurate content that is in line with their interests, thereby reducing information overload. Meanwhile, Personalization can integrate fragmented information in different places through algorithms, so that consumers do not need to spend a lot of time to find the information they need. Hence, personalization can improve the user experience of every consumer, so that they can find the content they are interested in more quickly and accurately.
4.2. Methods of personalization
Collaborative filtering based on user-item networks and tailored recommendation methods are used in this strategy. A technology that analyzes user behavioral data to identify their interests and preferences in order to present them with tailored recommendations is referred to as a collaborative recommendation system. The item-based collaborative filtering is to recommend other items like the target item to the user by analyzing the user's behavior data on the item. It contains four important steps. First, the system builds a network of items based on the user's usage history, and calculates betweenness, proximity, and degree. Next, the system will analyze the number of projects in each user's project network based on these three data. The algorithm then analyzes the user's preference for each item and the order in which it ranks. In the last step, the system will give a recommendation list based on the prediction score. This approach can better solve the problem of how to recommend items from a plethora of possibilities [15].
The second method is User-controllable personalization. This method allows users to merge different recommendation methods and algorithms and can check and filter recommended items. It presents a slider-based interactive Venn diagram visualization that might serve as a useful illustration of information filtering. This system can help each user choose a more suitable item from many items by recommending personalized items. For example, users can sort the recommendation list by themselves, which can improve satisfaction under the visual interactive interface, which is User-controllable personalization [16].
5. Case Study
5.1. Case1: Online Retail
This case study explores the application of data analysis techniques, such as k-means clustering, in creating customer-centric business intelligence for online retailers. The retailer discussed in this case was established in 1981 with 80 staff selling unparalleled all-occasion gifts. After decades of operation, it has acquired many customers and collected a dataset for analysis, of which variables are shown in Table 1.
Table 1: Variables in the customer transaction dataset (4381 instances) [17].
Variable name | Data type | Description; typical values and meanings |
Invoice | Nominal | Invoice number: a 6-digit integral number uniquely assigned to each transaction |
StockCode | Nominal | Product (item) code; a 5-digit integral number uniquely assigned to each distinct product |
Description | Nominal | Product (item) name; CARD I LOVE LONDON |
Quantity | Numeric | The quantities of each product (item) per transaction |
Price | Numeric | Product price per unit in sterling; £45.23 |
InvoiceDate | Numeric | The day and time when each transaction was generated; 31/05/2011 15:59 |
Address Line 1 | Nominal | Delivery address line 1; 103 Borough Road |
Address Line 2 | Nominal | Delivery address line 2; Elephant and Castle |
Address Line 3 | Nominal | Delivery address line 3; London |
PostCode | Nominal | Delivery address postcode, mainly for consumers from the UK; SE1 0AA |
Country | Nominal | Delivery address country; England |
Only transactions that occurred between January 1 and December 31, 2011, are the subject of this complaint. There were 4,381 active separate post codes and 22,190 active transactions within this particular time period. There are 406,830 instances (rows of records) in the dataset that correspond to these transactions, each of which represents a distinct transactional item. Each post code was typically associated with five transactions, which means that each customer makes an online purchase about every two months. Additionally, only UK consumers were examined. It is important to note that each transaction that took place in 2011 had an average of 18.3 different products (items; 406830/22190). This shows that a large portion of the company's clients are businesses rather than individual clients.
This dataset has to be pre-processed before data analysis can start. The preparation includes selecting the appropriate variables, dividing InvoiceDate into Date and Time, separating InvoiceDate into Quantity, Price, Recency, Frequency, and Monetary, computing the values of these variables per postcode, and removing any transactions that do not have a postcode associated with them.
K-means algorithm is known to be sensitive to outliers. Therefore, histograms of Recency, Frequency and Monetary need to be observed before analysis begins. As shown in the Figure 1 below.
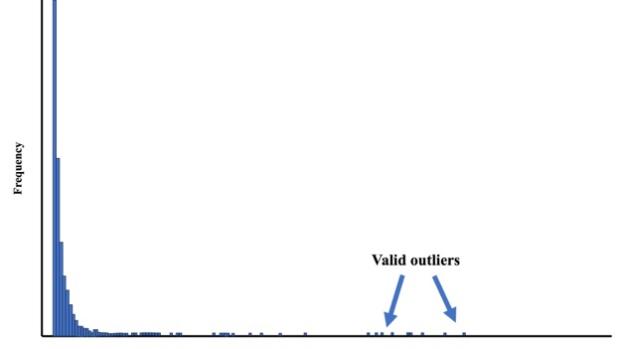
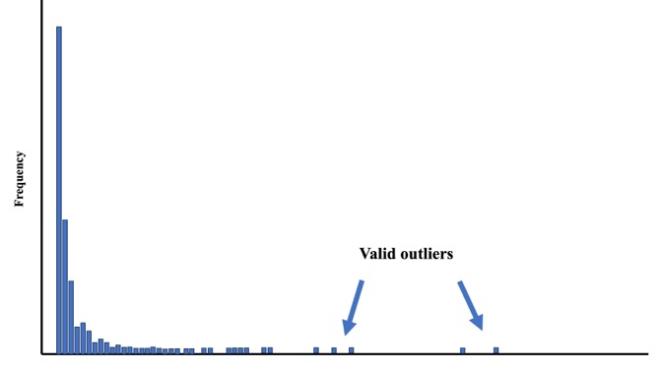
Figure 1: Distribution of the variables Frequency and Monetary [17].
There are certain occasions where the values for Currency and Frequency are completely different from the bulk of occurrences in the dataset. These instances are real from a business perspective since they are real transaction records, yet when it comes to data analysis, they are outliers. In this illustration, a filter node is created to deal with this problem. The filter node is set up to eliminate all instances of uncommon values involving any variable, and the minimal cutoff for rare values is set at 1% of the total number of instances taken into account.
The preparations are finally all done, and the k-means algorithm can be applied. The result of segmentation is shown in Table 2 where all the customers are segmented into 5 clusters.
Table 2: Statistics of each cluster [17].
Minimum | Median | Maximum | |
Cluster1 | |||
Recency | 8 | 9.8 | 12 |
Frequency | 1 | 1.3 | 4 |
Monetary | 3.75 | 361.2 | 7741.47 |
First_Purchase | 8 | 11.1 | 12 |
Cluster2 | |||
Recency | 4 | 5.4 | 7 |
Frequency | 1 | 2.3 | 13 |
Monetary | 15 | 586.19 | 3906.27 |
First_Purchase | 4 | 7.7 | 12 |
Cluster3 | |||
Recency | 0 | 1.5 | 3 |
Frequency | 1 | 2.6 | 7 |
Monetary | 20.8 | 685.71 | 4314.72 |
First_Purchase | 0 | 5.3 | 12 |
Cluster4 | |||
Recency | 0 | 1 | 5 |
Frequency | 3 | 8.3 | 16 |
Monetary | 191.17 | 2425.09 | 7330.8 |
First_Purchase | 1 | 1 | 12 |
Cluster5 | |||
Recency | 0 | 0.7 | 6 |
Frequency | 3 | 17.7 | 28 |
Monetary | 1641.48 | 5962.85 | 13110.02 |
First_Purchase | 0 | 11.1 | 12 |
Understanding and interpreting each discovered cluster is necessary for producing customer-centric business intelligence. It's intriguing to see that every cluster does contain a subset of customers that share the distinctive and inherent characteristics listed below. Cluster 1 has around 527 clients, or 14.4% of the populace. This cluster looks to be the least profitable given that there were no sales in the second half of the year. Understanding and interpreting each discovered cluster is necessary for producing customer-centric business intelligence. It's intriguing to see that every cluster does contain a subset of customers that share the distinctive and inherent characteristics listed below. Cluster 1 has around 527 clients, or 14.4% of the populace. This cluster looks to be the least profitable given that there were no sales in the second half of the year. Even though it makes up the smallest portion of the population (just 5.05%), this group seems to be the most lucrative. Despite having a far higher frequency and monetary value than Cluster 5, Cluster 4 has fewer consumers—about 627—than Cluster 5. This group seems to be the second most profitable. About 459 consumers make up Cluster 2. This group of clients appears less frequently throughout the year and has a substantially lower average dollar amount than Clusters 4 and 5, suggesting that consumers spend much less per capita. This cluster falls within the low recency, high frequency, medium financial, and moderate expenditure per consumer categories. The largest group, Cluster 3, has 1,748 consumers. This customer group has acceptable frequency values. This group's financial value is lower than that of Clusters 2 and 4, but it is still respectable because it has many newly enlisted customers who have only recently started shopping at stores. This group seems to be representative of the entire population. Therefore, there is a degree of uncertainty about profitability. In the long run, some consumers may be highly profitable, if at all.
To encapsulate analysis made so far: In the whole population of customers, 47% were regular consumers with moderate spending and frequency, 34% were medium- to high-profit consumers, 5% were extremely high-profit consumers, and the remaining 14% were extremely low-profit consumers. 60 percent of the overall sales came from about 22% of the customer base. Overall, the company's profitability appears to be pretty strong [18].
5.2. Case Study 2: e-commerce
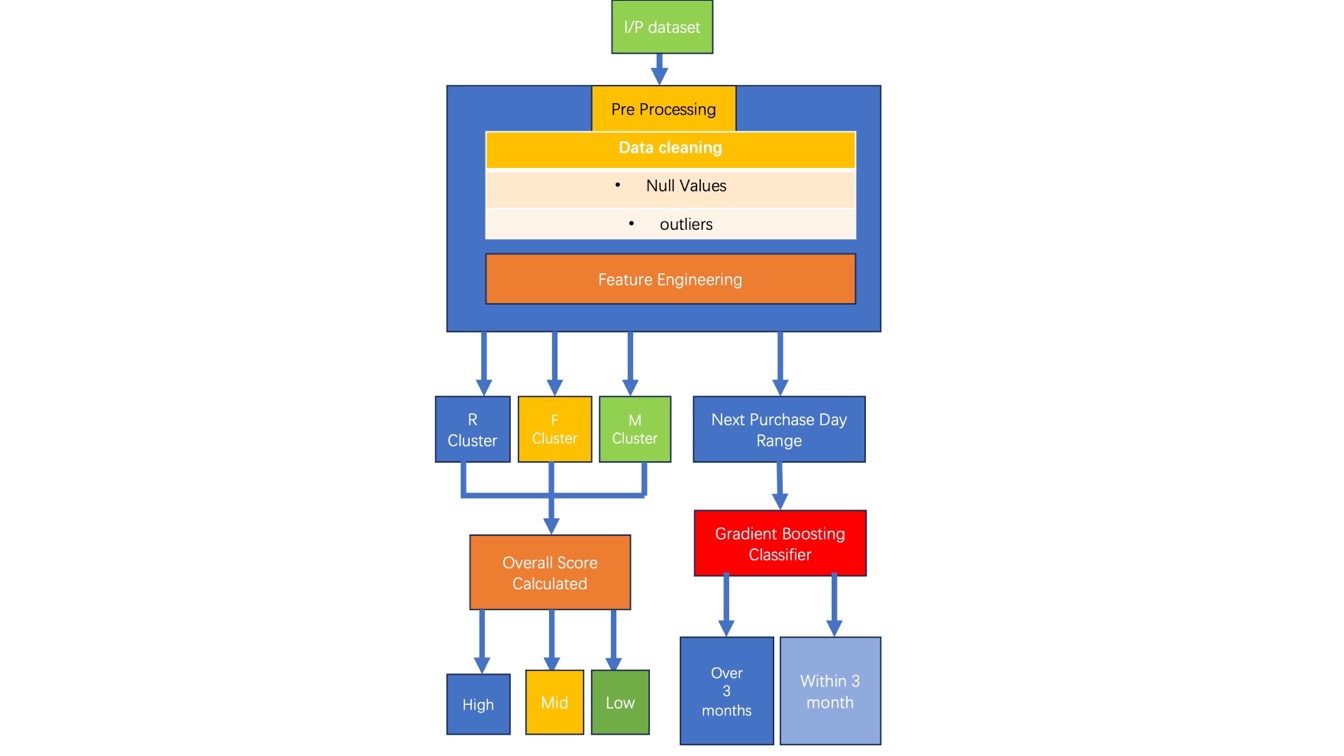
Figure 2: The process of processing data and customer segmentation[19].
The example we discovered here(Figure 2) is meant to assist other academics and other stakeholders in e-commerce in comparing the organization and categorization of small areas' e-commerce purchasing trends. The issue of churn in telecommunication services is addressed using a mix of classification and clustering methods. Since the telecommunications sector is constantly overrun with consumers, it benefits operators more to suggest retention methods to those who are ready to depart.
Table 3: Calculating the R, F, and M.
Customer ID | Next Purchase Day | Recency | Recency Cluster | Frequency | Frequency Cluster | Revenue | Revenue Cluster | |
0 | 13085.0 | 999 | 57 | 3 | 92 | 3 | 1459.46 | 0 |
1 | 18087 | 46 | 44 | 3 | 95 | 3 | 14411.62 | 0 |
2 | 17519 | 116 | 33 | 3 | 224 | 3 | 5102.80 | 0 |
3 | 12362 | 40 | 12 | 3 | 275 | 3 | 5284.58 | 0 |
4 | 15712 | 38 | 9 | 3 | 167 | 3 | 3467.46 | 0 |
In another model we found here(data in Table 3), according to the customer segmentation rule, the researcher decided to separate the raw data into three categories: R, F, and M. RFM is known as Recency of purchase, Frequency of purchase, and Total Monetary value of the purchase by the customer respectively [19]. However, there’s still problem in the model since the researchers believed that the segment of the recency, frequency, and monetary segments cannot be found during the arithmetic process. And our best customers are those with the least recency, the most frequency, and the highest monetary value [19]. Therefore, a new segmentation method is introduced to calculate the possibility of the customer’s willingness of purchasing the specific products.
In the study, the researches decided first start with separate the clusters into small and high clusters with smaller values of 0,1 and higher values of 3,4. However, as we mentioned that the best customer for us in the Recency section is a smaller value, therefore we need to put the smaller value for Recency into the higher ranking like 3,4. After the clusters are separated, by adding up the number of each clusters the researches grouped customers according to the overall score revealed that those with the greatest score, 8, were the most desirable, having the most Frequency, Monetary Value, and lowest Recency, while those with the lowest score, 3, were the least desirable. And the overall score is ranged from 3-8, with 3-4 is the low value, 5-6 is the mid value, and 7-8 is the high value. Till here, all the process of segmentation is finished here. Then the model defined the “0” as the customers purchase the next product more than 3 months, “1” is the value for those who buy products less than 3 months.
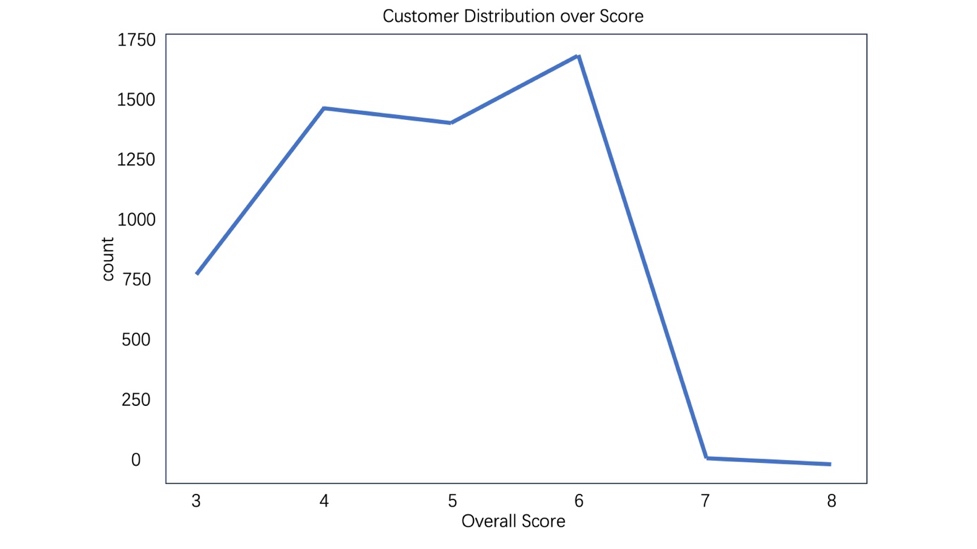
Figure 3: The Overall score of customer distribution[19].
Therefore, with the calculation the researchers did(showed in Figure 3), they found 6 clusters with the distribution is likely to be normal. The high value customers are below than the two other segmentations. Mid value customers are dominating the whole clusters. We could find from the graph above, it’s the model the researchers built according to their calculation. Yellow points are the highest in the currency and lowest in the recency. And the range of the frequency distribution is 0 to 15. The frequency of the mid-range clients is good, ranging from 0 to 25 times, and some even more than 35 times, and they haven't recently purchased extremely early. The low-value consumers are shown by the blue area, which has had a fairly recent change, practically all of them have purchased extended returns at low frequency, ranging from 0 to 12.
When measured by metrics, the first strategy in this study was to cluster directly on the combined "RFM" table. However, this method was ineffective at assigning clusters based on the proximity, frequency, and currency measures. It is unclear to the computer if low closeness should be connected to high frequency and high monetary values and clusters should be delivered correspondingly depending on each proximity, frequency, and monetary measure.
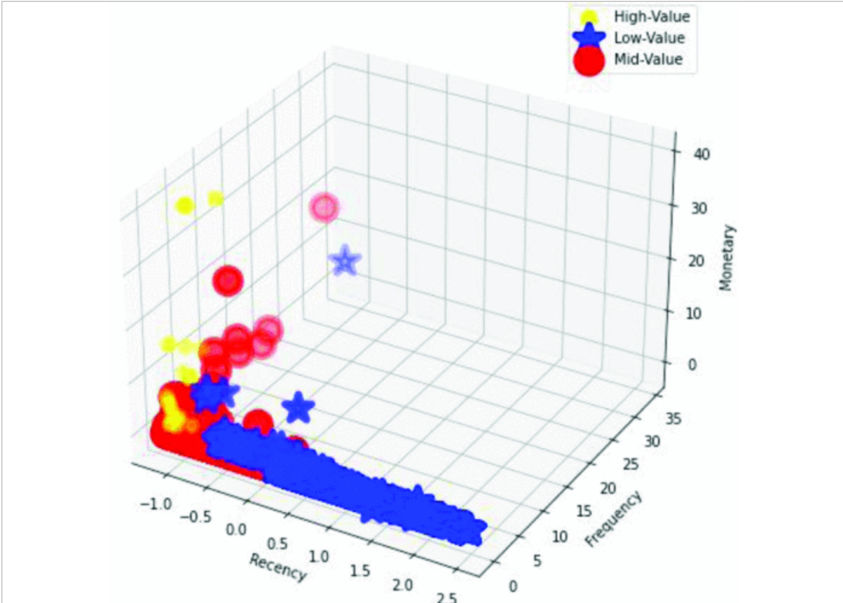
Figure 4: The Overall score of customer distribution (3 Dimension)[19].
As a result shown in figure 4, we thought of using a slightly different strategy in which each R, F, and M column was calculated independently and clustered one at a time. Then, three cluster columns were made. Finally, after compiling everything, we arrived at the final clusters, where greater clusters denote lower recency while also indicating higher frequency and monetary worth, and vice versa. This improves the clustering's effectiveness and logic. This method successfully segments current consumers into low, medium, and high categories, which may be applied to enhance customer relationship management and segmentation.
5.3. Case Study 3: Transportation
In this case study, a new eco-driving service for bus drivers is developed using digital tachographs (DGT) and drivers' personal information. Additionally, it examines ways to motivate drivers to engage in eco-driving by arming them with useful knowledge. For instance, the driving behavior, such as the number of decelerations per 100 miles, is assessed and supplied to each bus driver using the eTAS (Korea Transportation Safety Authority 2015) system. The next section will outline the five phases of the design process.
Data preparation is the first step; it involves gathering information about consumer behavior from numerous sources, preprocessing it, locating outliers, combining different types of data, and finally converting it into a format that can be analyzed. 33 bus drivers' DTG and driver data were gathered from March to June 2015 for this case study. A total of 1545 samples were produced using the data, which combined the license plate number and driving date. They all displayed the driving behavior of 33 buses from January to June. A flowchart of the data integration process is shown in Figure 5, and it shows a combination of Driver data and DTG data.
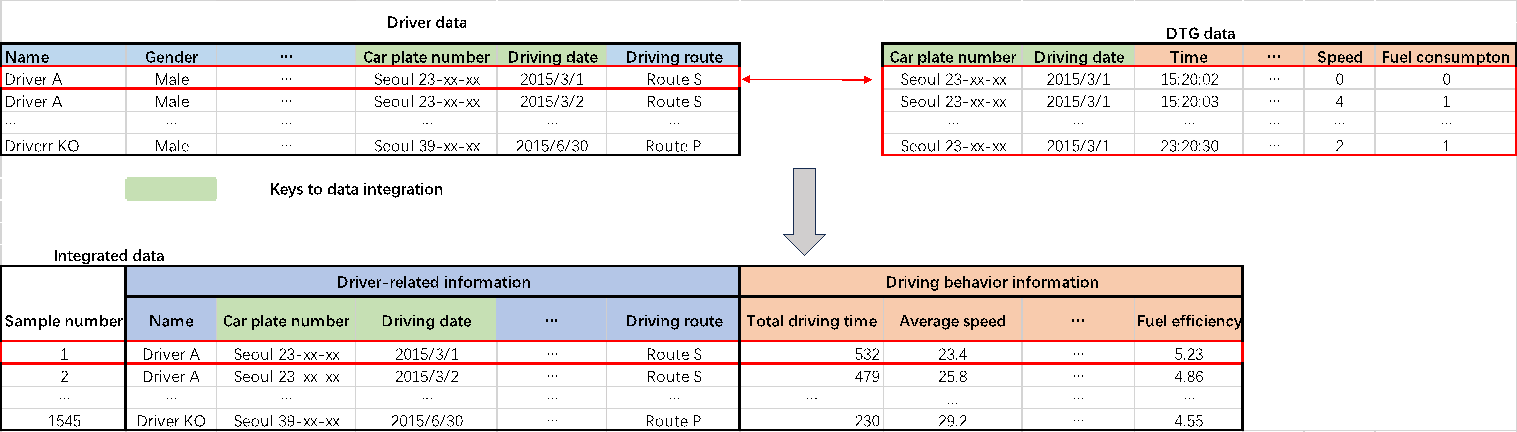
Figure 5: Integration of driver and DTG data [20].
The second step, data analysis planning, considers three factors: who should supply services, why eco-driving services should be provided, and how service management should behave. The variations in driver fuel economy and driving metrics on five distinct routes (routes A, J, G, P, and S) were then examined using the integrated data in accordance with the established variables. This knowledge enables us to recognize the three earlier-posed questions.
Table 4: Comparison of fuel efficiency and driving indicators foe different routes [20]. *p value < 0.01.
Variables | Route A (N = 317) | Route J (N = 283) | Route G (N = 226) | |||
Average | SD | Average | SD | Average | SD | |
Fuel efficiency(km/L) | 5.04 | 0.25 | 4.92 | 0.27 | 4.89 | 0.27 |
Ratio of idle time to total driving time (%) | 5.69 | 2.18 | 6.94 | 2.11 | 5.91 | 2.2 |
Overspeeding(# per 100 km) | 5.52 | 2.06 | 9.71 | 4.38 | 14.48 | 4.28 |
Rapid acceleration (# per 100 km) | 4.27 | 2.09 | 14.28 | 4.14 | 11.56 | 4.15 |
Rapid deceleration (# per 100 km) | 0.39 | 0.4 | 2.14 | 1.35 | 2.55 | 1.7 |
Rapid turning (# per 100km) | 16.05 | 7.87 | 18.07 | 8.19 | 27.55 | 8.47 |
Rapid lane change (# per 100 km) | 0.31 | 0.28 | 0.97 | 0.91 | 1.76 | 1.28 |
Variables | Route P (N = 330) | Route S (N = 389) | ||
Average | SD | Average | SD | |
Fuel efficiency(km/L) | 4.86 | 0.32 | 4.74 | 0.57 |
Ratio of idle time to total driving time(%) | 7.49 | 2.79 | 11.16 | 1.99 |
Overspeeding(# per 100 km) | 8.31 | 4.34 | 18.42 | 7.71 |
Rapid acceleration(# per 100 km) | 10.2 | 4.42 | 44.55 | 8.97 |
Rapid deceleration(# per 100 km) | 1.27 | 1.57 | 6.12 | 3.25 |
Rapid turning(# per 100km) | 14.69 | 5.58 | 38.33 | 6.53 |
Rapid lane change(# per 100 km) | 0.47 | 0.47 | 1.46 | 0.81 |
The third step is data analysis, which examines the integrated data in accordance with the strategy for data analysis as well as the variations in driving indicators and fuel economy of five distinct routes using analysis of variance and multiple comparison tests. Table 4 displays the comparative findings for several routes. It is evident that drivers on Route S have the biggest standard deviation (SD) and the lowest average fuel economy (p<0.01). Drivers on Route S have a greater idling time ratio (p<0.01) compared to drivers on other routes, and there are more speeding, acceleration, deceleration, and turning incidents per 100 kilometers on Route S. Table 4 demonstrates that the S-route drivers have the strongest link with the eco-driving service among drivers on other routes.
Table 5: Summary of the regression results [20].
Variable | Parameter estimate | Prob>ITI | Variation inflation factor (VIF) |
Intercept | 4.74 | 0 |
|
Idle time | -0.15 | 0 | 1.56 |
Overspeeding | -0.07 | 0 | 1.08 |
Rapid acceleration | -0.15 | 0 | 1.74 |
Rapid deceleration | -0.19 | 0 | 1.62 |
Rapid turning | -0.09 | 0 | 1.03 |
Rapid lane change | -0.06 | 0 | 1.23 |
The relationship between the driver's fuel efficiency and the driving indications on the S Route was then investigated, and the effect of each driving indicator on fuel efficiency was estimated using regression analysis. The outcomes of the linear regression analysis are shown in Table 5. The model is significant (p < 0.01) and the square value of R is 0.65, showing how well our linear model fits the data. Additionally, Table 5 demonstrates that all driving indicator coefficients are negative (p0.01), demonstrating the necessity to adjust all 6 driving indications to improve fuel economy. Another evidence that the linear model does not exhibit multicollinearity is the fact that all variance inflation factor values are lower than 2. Furthermore, we can see that, in comparison to other driving indications, idle time, quick acceleration, and rapid deceleration have a greater influence on driving efficiency. As a result, we ought to be more inclined to provide services that promote rapid acceleration and deceleration to reduce idle time.
5.4. Conclusion
To encapsulate, based on the papers synthesized above data analysis play an important role in promoting customer segmentation in retail industry and e-commerce, personalization service in eco-driving system. The models and real-world applications introduced above show how enterprises make accurate marketing decisions in the information age. These emerging data analysis methods can provide customers with better services.
6. Discussion
Data analysis is a comprehensive method and tool to depict and forecast the intrecate features of numbers. Armed with latest models and modern computing capability, it can be adopted by marketing decision-making. We have discussed the necessity and common ways of customer segmentation and personalization, and then understand the why we are facilitating this application. We have also looked at real life cases in online retail, e-commerce, and transportation. These cases are both supporting evidence for the importance of applying data analytics into marketing strategies and inspirations for the future possible integration of data analysis and other fields.
Despite great help in marketing strategies provided by these data analysis techniques, privacy issues and social concerns are preventing businesses fully promoting the application of customer data analysis. Some people regard these analysis as covert and aggressive behavior since they treasure their personal profile data such as preferences which in their understanding is violated by the businesses.
Another problem is preciseness. Algorithms and models are sensitive to data and parameters. A little error may cause the analysis to conclude a totally different result; Even for the same set of data, small changes in parameters can result in a change in the overall result. There are always risks of over-reliance on data, which sometimes lead to a loss of human interaction with customers. So, companies need to learn how to use data analytics to enhance profit-making while making sure they are not overdependent on it.
Data analytics has a bright future. The boasting artificial intelligence (AI) provides opportunities to take a gigantic leap for this field. The iteration of algorithms can take advantage of the strong code composing ability offered by AI models. On the other hand, issue of algorithmic bias is going to be paid more attention to in the future. In marketing, the purpose of the application of data analytics is to make more profits, and if the abuse of data annoys the customers to reduce consumption, the whole process is meaningless.
References
[1]. Rajan, Varadarajan. Journal of the Academy of Marketing Science, 2009, pp. 3–4, Strategic Marketing and Marketing Strategy: Domain, Definition, Fundamental Issues and Foundational Premises.
[2]. Tarver, Evan. “Market Segmentation: Definition, Example, Types, Benefits.” Investopedia, 30 Mar. 2023, www.investopedia.com/terms/m/marketsegmentation.asp.
[3]. Kotler, P. & Armstrong, G. (1999). Principles of marketing. Prentice Hall: London. Cooil, Aksoy, and Keiningham 37 Downloaded by [Ondokuz Mayis Universitesine] at 11:37 13 November 201
[4]. “Personalization Defined: What Is Personalization?” Salesforce, www.salesforce.com/resources/articles/personalization-definition/. Accessed 17 Aug. 2023.
[5]. Jaggi, Seema. "Descriptive statistics and exploratory data analysis." Indian Agricultural Statistics Research Institute 1 (2003): 1-18.
[6]. Thompson, Cheryl Bagley. "Descriptive data analysis." Air medical journal 28.2 (2009): 56-59.
[7]. Shi‐Nash, Amy, and David R. Hardoon. "Data analytics and predictive analytics in the era of big da ta." Internet of things and data analytics handbook (2017): 329-345.
[8]. Kumar, Vaibhav, and M. L. Garg. "Predictive analytics: a review of trends and techniques." International Journal of Computer Applications 182.1 (2018): 31-37.
[9]. W S McCulloch, Walter Pitts, 1943, “A logical calculus of the ideas immanent in nervous activities”, The bulletin of mathematical biophysics, Vol-5, Issue-4, Pages-115- 133.
[10]. Marketing Evolution. “Customer Segmentation Models: Types, Benefits & Uses.” Marketing Evolution, 19 July 2022, www.marketingevolution.com/marketing-essentials/customer-segmentation-models.
[11]. Bruce Cooil, Lerzan Aksoy & Timothy L. Keiningham (2008) Approaches to Customer Segmentation, Journal of Relationship Marketing, 6:3-4, 9-39, DOI: 10.1300/J366v06n03_02
[12]. Juni , Sari Nurma, et al. Review of Review on Customer Segmentation Technique on Ecommerce, Advanced Science Letters, vol. 22, no. 10, Oct. 2016.
[13]. Montgomery, Alan L., and Michael D. Smith. "Prospects for Personalization on the Internet." Journal of Interactive Marketing 23.2 (2009): 130-137.
[14]. Edmunds, Angela, and Anne Morris. "The problem of information overload in business organisations: a review of the literature." International journal of information management 20.1 (2000): 17-28.
[15]. Ha, Taehyun, and Sangwon Lee. "Item-network-based collaborative filtering: A personalized recommendation method based on a user's item network." Information Processing & Management 53.5 (2017): 1171-1184.
[16]. Parra, Denis, and Peter Brusilovsky. "User-controllable personalization: A case study with SetFusion." International Journal of Human-Computer Studies 78 (2015): 43-67.
[17]. Bruce Cooil, Lerzan Aksoy & Timothy L. Keiningham (2008) Approaches to Customer Segmentation, Journal of Relationship Marketing, 6:3-4, 9-39, DOI: 10.1300/J366v06n03_02
[18]. Sari, Juni Nurma, et al. "Review on customer segmentation technique on ecommerce." Advanced Science Letters 22.10 (2016): 3018-3022.
[19]. Akash, Patra, et al. 2022 4th International Conference on Advances in Computing, Communication Control and Networking (ICAC3N), 2022, Customer Segmentation and Future Purchase Prediction Using RFM Measures, https://ieeexplore-ieee-org.proxy.library.nyu.edu/document/10073993. Accessed 24 Aug. 2023.
[20]. Kim, Min-Jun, et al. "Approach to service design based on customer behavior data: a case study on eco-driving service design using bus drivers’ behavior data." Service Business 12 (2018): 203-227.
Cite this article
Zhang,Y.;Xu,Z.;Zhang,Z. (2024). Review on the Use of Data Analysis for Customer Segmentation and Personalization in Marketing. Advances in Economics, Management and Political Sciences,97,235-248.
Data availability
The datasets used and/or analyzed during the current study will be available from the authors upon reasonable request.
Disclaimer/Publisher's Note
The statements, opinions and data contained in all publications are solely those of the individual author(s) and contributor(s) and not of EWA Publishing and/or the editor(s). EWA Publishing and/or the editor(s) disclaim responsibility for any injury to people or property resulting from any ideas, methods, instructions or products referred to in the content.
About volume
Volume title: Proceedings of the 2nd International Conference on Financial Technology and Business Analysis
© 2024 by the author(s). Licensee EWA Publishing, Oxford, UK. This article is an open access article distributed under the terms and
conditions of the Creative Commons Attribution (CC BY) license. Authors who
publish this series agree to the following terms:
1. Authors retain copyright and grant the series right of first publication with the work simultaneously licensed under a Creative Commons
Attribution License that allows others to share the work with an acknowledgment of the work's authorship and initial publication in this
series.
2. Authors are able to enter into separate, additional contractual arrangements for the non-exclusive distribution of the series's published
version of the work (e.g., post it to an institutional repository or publish it in a book), with an acknowledgment of its initial
publication in this series.
3. Authors are permitted and encouraged to post their work online (e.g., in institutional repositories or on their website) prior to and
during the submission process, as it can lead to productive exchanges, as well as earlier and greater citation of published work (See
Open access policy for details).
References
[1]. Rajan, Varadarajan. Journal of the Academy of Marketing Science, 2009, pp. 3–4, Strategic Marketing and Marketing Strategy: Domain, Definition, Fundamental Issues and Foundational Premises.
[2]. Tarver, Evan. “Market Segmentation: Definition, Example, Types, Benefits.” Investopedia, 30 Mar. 2023, www.investopedia.com/terms/m/marketsegmentation.asp.
[3]. Kotler, P. & Armstrong, G. (1999). Principles of marketing. Prentice Hall: London. Cooil, Aksoy, and Keiningham 37 Downloaded by [Ondokuz Mayis Universitesine] at 11:37 13 November 201
[4]. “Personalization Defined: What Is Personalization?” Salesforce, www.salesforce.com/resources/articles/personalization-definition/. Accessed 17 Aug. 2023.
[5]. Jaggi, Seema. "Descriptive statistics and exploratory data analysis." Indian Agricultural Statistics Research Institute 1 (2003): 1-18.
[6]. Thompson, Cheryl Bagley. "Descriptive data analysis." Air medical journal 28.2 (2009): 56-59.
[7]. Shi‐Nash, Amy, and David R. Hardoon. "Data analytics and predictive analytics in the era of big da ta." Internet of things and data analytics handbook (2017): 329-345.
[8]. Kumar, Vaibhav, and M. L. Garg. "Predictive analytics: a review of trends and techniques." International Journal of Computer Applications 182.1 (2018): 31-37.
[9]. W S McCulloch, Walter Pitts, 1943, “A logical calculus of the ideas immanent in nervous activities”, The bulletin of mathematical biophysics, Vol-5, Issue-4, Pages-115- 133.
[10]. Marketing Evolution. “Customer Segmentation Models: Types, Benefits & Uses.” Marketing Evolution, 19 July 2022, www.marketingevolution.com/marketing-essentials/customer-segmentation-models.
[11]. Bruce Cooil, Lerzan Aksoy & Timothy L. Keiningham (2008) Approaches to Customer Segmentation, Journal of Relationship Marketing, 6:3-4, 9-39, DOI: 10.1300/J366v06n03_02
[12]. Juni , Sari Nurma, et al. Review of Review on Customer Segmentation Technique on Ecommerce, Advanced Science Letters, vol. 22, no. 10, Oct. 2016.
[13]. Montgomery, Alan L., and Michael D. Smith. "Prospects for Personalization on the Internet." Journal of Interactive Marketing 23.2 (2009): 130-137.
[14]. Edmunds, Angela, and Anne Morris. "The problem of information overload in business organisations: a review of the literature." International journal of information management 20.1 (2000): 17-28.
[15]. Ha, Taehyun, and Sangwon Lee. "Item-network-based collaborative filtering: A personalized recommendation method based on a user's item network." Information Processing & Management 53.5 (2017): 1171-1184.
[16]. Parra, Denis, and Peter Brusilovsky. "User-controllable personalization: A case study with SetFusion." International Journal of Human-Computer Studies 78 (2015): 43-67.
[17]. Bruce Cooil, Lerzan Aksoy & Timothy L. Keiningham (2008) Approaches to Customer Segmentation, Journal of Relationship Marketing, 6:3-4, 9-39, DOI: 10.1300/J366v06n03_02
[18]. Sari, Juni Nurma, et al. "Review on customer segmentation technique on ecommerce." Advanced Science Letters 22.10 (2016): 3018-3022.
[19]. Akash, Patra, et al. 2022 4th International Conference on Advances in Computing, Communication Control and Networking (ICAC3N), 2022, Customer Segmentation and Future Purchase Prediction Using RFM Measures, https://ieeexplore-ieee-org.proxy.library.nyu.edu/document/10073993. Accessed 24 Aug. 2023.
[20]. Kim, Min-Jun, et al. "Approach to service design based on customer behavior data: a case study on eco-driving service design using bus drivers’ behavior data." Service Business 12 (2018): 203-227.