


1. Introduction
Economic indicators have long held the attention of policymakers, scholars, and the general public alike. Chief among these indicators is the Gross Domestic Product (GDP), a reflection of a nation's economic health and the most widely used measure of its output. Its origin traces back to the 20th century, with notable economists such as Simon Kuznets developing standardized metrics like the Gross National Product (GNP) [1]. The evolution from GNP to the more recognized GDP of today underscores the shifting priorities and understandings of national economies. For instance, GDP's components, such as consumption, investment, and government expenditure, have seen varying emphases depending on the time, nation, and economic structure in question.
Despite the vast amount of research on GDP and its constituents, certain gaps in the literature persist. While there has been an emphasis on improving accuracy and refining measurement techniques, as evidenced by works of Jens Hogrefe and S. Boragan among others [2][3], the focus has predominantly been on the total value of GDP and its immediate components. Trend value analyses, which offer insights into the cyclical movement of GDP components, remain surprisingly underrepresented. Some scholars have dabbled in this realm, notably YS Schüler and a team in 2022, but their focus has largely been on developed nations with significant domestic production capabilities [4][5].
Such an oversight poses a question: What about countries like Singapore? As a developed nation with a heavy emphasis on exports, its economic structure might offer unique insights into the composition and trends of GDP. This study embarks on that uncharted territory, seeking to elucidate the correlations, cyclical amplitude variations, and periodic trends of Singapore's GDP and its components.
In doing so, this paper strives not just to fill an academic gap, but to provide policymakers and economists with a richer, more nuanced understanding of a nation's economic trajectory, using Singapore as a prime example.
2. Literature Review
In 1946, Simon Kuznets introduced the concept of GNP in his book "National Income and Its Composition, 1919–1938" as a standardized measure of the total national production over a period of time[1]. This consisted of consumption, investment, government expenditure, and net exports. However, this early conception of GNP differed from the more commonly used GDP in modern macroeconomics. GNP is calculated by adding the income earned by a nation's residents abroad to its GDP and then subtracting payments made to the rest of the world. Essentially, it is a measurement cantered around the nation's residents. The United States employed this metric to study its economic structure until 1965 when it began compiling GDP data by industry to gain a better understanding of its economic composition. Many developed nations, like the UK, also established departments in 1947 to collect and study data related to the various sectors of GDP.
As time progressed, countries continued to refine their data collection methods to achieve more accurate GDP figures. Scholars too have worked on enhancing methodologies to reduce measurement errors. For instance, Jens, Hogrefe. (2008) posited a mixed-frequency measurement method [2]. He emphasized the paramount importance of high-quality data in analysing macroeconomic hypotheses and predictions. However, there are challenges in terms of the frequency, currency, and validity of the data. Notably, certain macroeconomic variables, such as GDP, are available only on a quarterly basis, whereas others, like interest rates or stock prices, are sampled at much higher frequencies. Additionally, there are often delays in data publication, and substantial revisions may be made before the release, leading to uncertainties regarding the accuracy of the initial data. In his paper, Hogrefe focused on forecasting GDP revisions. He proposed the use of mixed-frequency data, incorporating both quarterly and monthly information, to better harness the information at hand and enhance the accuracy of GDP revision predictions. By adopting his approach, one can achieve more readiness and precision in real-time accuracy and revision of data like GDP.
On another note, S., Boragan (2011) and colleagues introduced a "forecast combination" measurement [3]. Their study aimed to improve the measurement of U.S. GDP by merging two often divergent estimates: the expenditure-side version (GDPE) and the income-side version (GDPI). They developed a "forecast combination" approach to amalgamate these estimates, with the goal of providing a more accurate and practical composite estimate for U.S. GDP growth, termed GDPC. Their study juxtaposed GDPC with GDPE and GDPI, with a particular focus on their behaviours during business cycles. Furthermore, they discussed several variations and extensions of their method to bolster GDP measurement.
As the precision in GDP data collection improves, scholarly analysis of GDP data has also become increasingly accurate. However, most academics currently concentrate on how to measure GDP and boost it, examining the recent variations in the components of GDP. Regrettably, there is a lack of research papers focusing on the trend values of GDP components. Yet, analysing trend values remains a pivotal and meaningful domain. In recent years, some scholars have embarked on studies in this area. For example, in 2018, YS Schüler delved into the business cycles of G7 countries using detrending components as an analytical tool [4]. Although his primary focus was on the presence of spurious cycles caused by the misuse of bandpass filters, he believed that filter misuse could amplify cycle variance and offset short-term fluctuations, especially in medium-term cycles exceeding typical business cycle durations. Later, in 2022, P Hu, P Ji, H Xu, X Shi, Y Wu, and others employed a detrended curve method for the U.S [5]. Their profound analysis cantered on the trend values of the U.S. GDP's Consumption and Investment. They extensively explored their correlation with GDP and the extent of their impact
Yet, these studies largely target developed nations with strong domestic production capabilities. There's a distinct absence of analyses on countries like Singapore, which has a significant export economy. I believe that examining the GDP composition of an export-heavy developed nation like Singapore might yield different findings than those of the countries previously studied by other researchers. I intend to employ the detrending curve methodology to conduct a detailed trend value analysis for Singapore, a prominent Asian developed economy.
In this paper, I aim to explore areas currently underrepresented in academia: the correlations between GDP components and their cyclical amplitude variations. Specifically, I wish to uncover the periodic trends of GDP and its components, their direct correlations, and the relative impact of investment and consumption on the cyclical trends of GDP. I am confident that this research will fill a gap in the academic domain.
3. Data and Methodology
Table 1: Gross domestic products, Consumption and Investment of Singapore (2000-2021) Note: unit is Millions of Singapore dollar (2015) Source: International Financial Statistics
Year | GDP | Consumption | Investment |
2000 | 193208.7 | 86636.3 | 60084.2 |
2001 | 191139.7 | 93624.8 | 56955.5 |
2002 | 198638.8 | 96853.6 | 51741.8 |
2003 | 207673.4 | 98096.4 | 49073.8 |
2004 | 228316.1 | 103251.5 | 54125.5 |
2005 | 245134.6 | 107480.6 | 56095.6 |
2006 | 267213.3 | 112193.7 | 61390 |
2007 | 291320 | 120052.9 | 70908.4 |
2008 | 296748.7 | 125186.7 | 78535.2 |
2009 | 297128.4 | 124841.5 | 82844.4 |
2010 | 340270.7 | 130273.1 | 88436.8 |
2011 | 361418.3 | 135432.8 | 94066.2 |
2012 | 377449 | 140475.5 | 102183.8 |
2013 | 395633.1 | 144430.3 | 108477.2 |
2014 | 411203.4 | 149636.9 | 113055.2 |
2015 | 423444.1 | 157343.7 | 115271.1 |
2016 | 438525.9 | 162394.8 | 115993.5 |
2017 | 458967.5 | 167567.4 | 122111.4 |
2018 | 475771.7 | 174197.6 | 115885.6 |
2019 | 480984.6 | 179768.6 | 117841.1 |
2020 | 461056.9 | 156632.1 | 101156.2 |
2021 | 496161.6 | 163688.3 | 120969.1 |
The primary approach of my methodology hinges on detrending. Initially, I've gathered data spanning 20 years pertaining to Singapore's GDP and related metrics. My main focal points are GDP, consumption, and investment. The data harnessed for my research originates from the International Financial Statistics (IFS). I've utilized data concerning Singapore’s gross domestic product, consumption, and investment from 2000 to 2021. Given that IFS is a highly authoritative and official source, its data quality is both trustworthy and reliable. Furthermore, the data encompasses a consistent 21-year span, devoid of any gaps or missing annual figures, underscoring its coherence and completeness.
At the heart of my methodology lies the basic equation:
\( GDP = C + I + G + NX \)
Where:
C = consumption
I = investment
G = government spending
NX = net exports
In this context, GDP signifies the aggregate market value of finished goods and services within a nation's borders over a specified time frame. My primary variables of interest are GDP, consumption, and government spending. Thus, by observing the trends from 2000 to 2021, I employed the Excel function for trend value.
A trend characterizes the persistent movement in a time series dataset over an extended period. Through this, I was able to derive the TREND values for GDP, consumption, and investment over these two decades. Consequently, I obtained the Cyclical components to examine short to medium-term fluctuations in the dataset around the trend:
\( Cyclical components(\%) = (Real-Trend)/Trend*100 \)
Having acquired the cyclical components for gross domestic product, consumption, and investment from 2000-2021, I juxtaposed the data for GDP with consumption, and GDP with investment, crafting two sets of graphs. These graphical representations vividly illustrate the short-term and long-term influences of consumption and investment on the GDP. Moreover, they allow for a comparison of the impacts of these two components on the GDP.
Subsequently, beyond the visual graph comparisons, I leveraged the standard deviation as a means to quantify their distinctions. The standard deviation serves as a statistical tool, shedding light on the degree of variation or spread in a dataset. By calculating the cyclical components (%) standard deviation for GDP, consumption, and investment over this period, we can discern which dataset is more stable.
Ultimately, I employed correlation to individually compare GDP with consumption and GDP with investment, aiming to gauge their respective degrees of association with GDP. Correlation quantifies the extent of relationship between multiple variables. However, it's pivotal to note that correlation doesn't equate to causation. A mutual relationship between two metrics doesn't insinuate that one variable instigates change in the other.
4. Discussion and Result
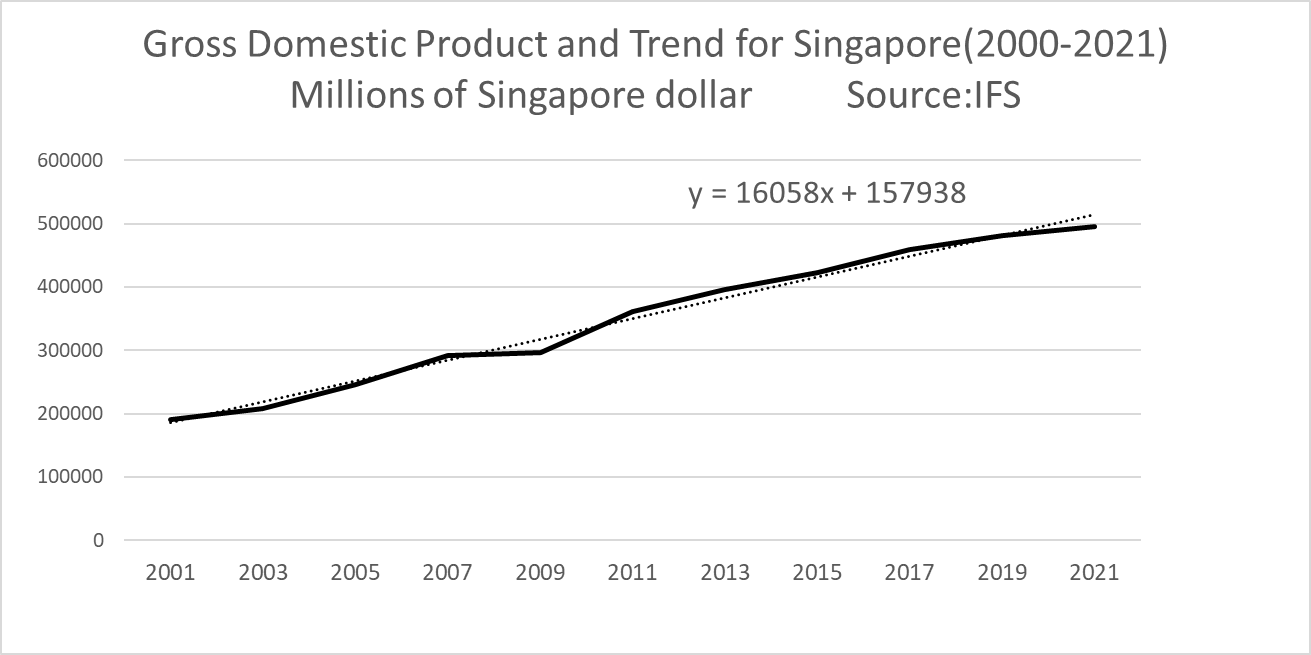
Figure 1: Gross Domestic Product and Trend for Singapore(2000-2021)
This chart shows the change in Singapore's GDP from 2000 to 2021. It's evident that the GDP trend is relatively smooth and stable, with only minor contractions in 2009 and 2020 due to external factors. However, the impact was not substantial.
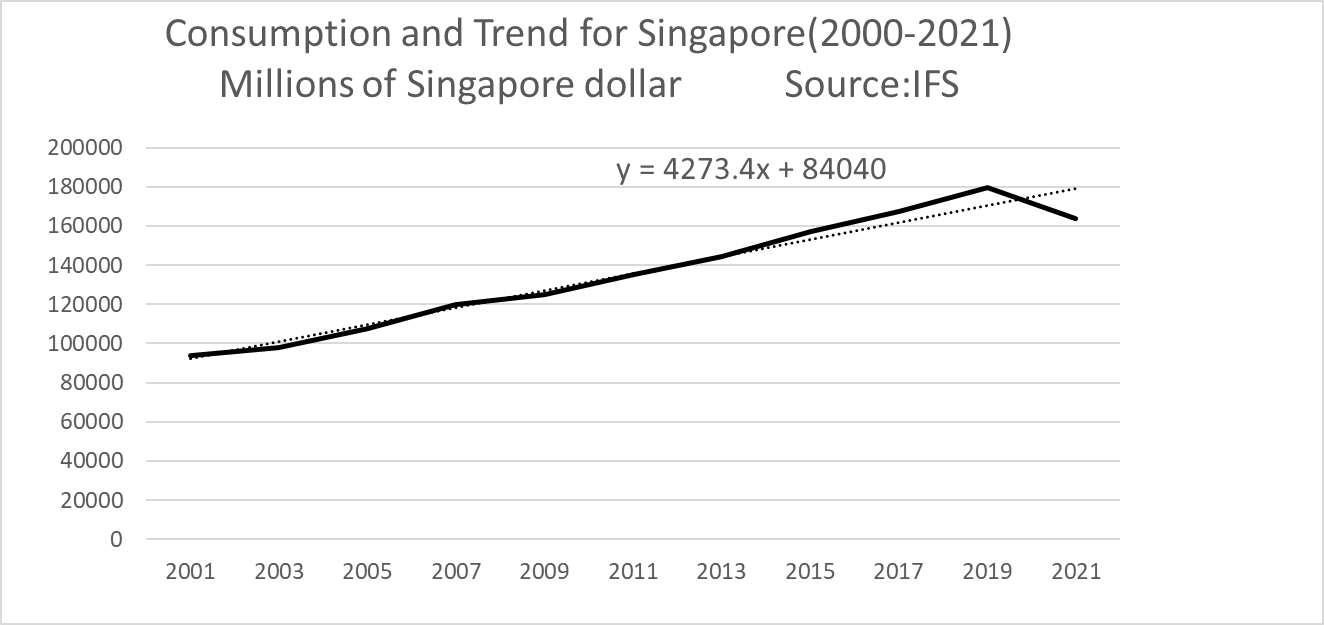
Figure 2: Consumption and Trend for Singapore(2000-2021)
This chart depicts the trend in Singapore's consumption for the same years. It follows a similar pattern to GDP, with an overall steady upward trajectory. There was a significant contraction in 2020 due to external shocks.
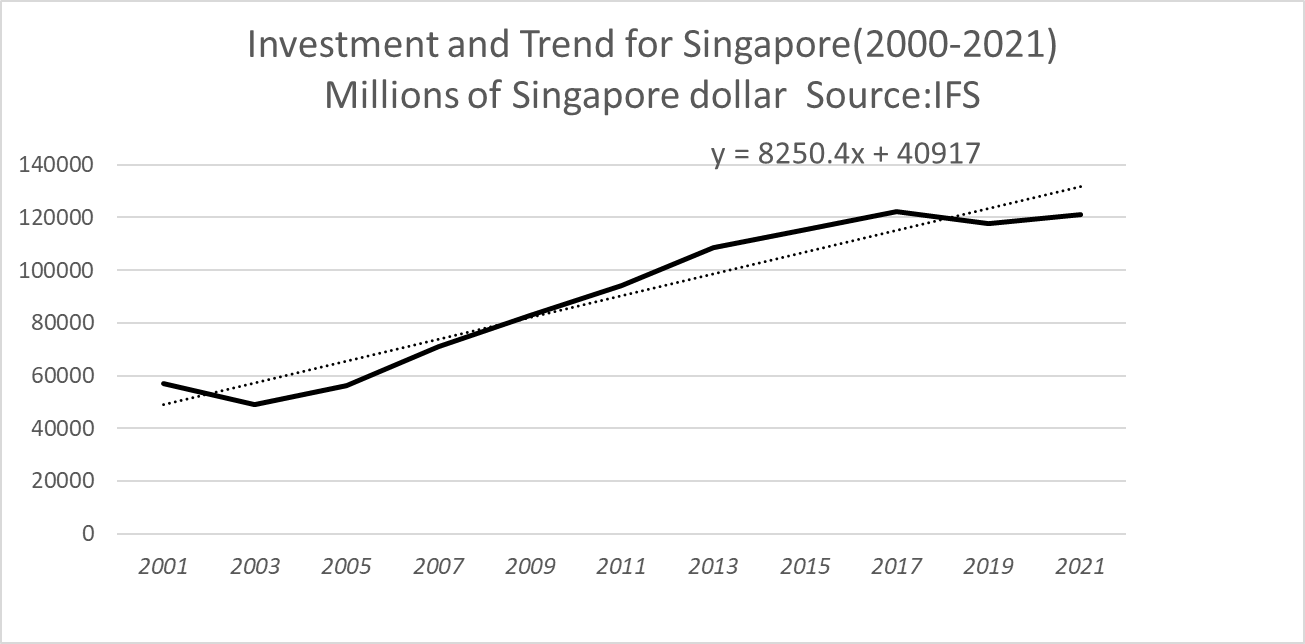
Figure 3: Investment and Trend for Singapore(2000-2021)
This chart represents the trend changes in investment in Singapore during this period. It's clear that short-term fluctuations in investment are more pronounced compared to GDP and consumption. Although in the long term, these fluctuations tend to balance out, as represented by the dotted line, the magnitude of change in investment is the most significant when faced with external shocks and influences.
While these three charts reveal some trends and patterns, I will now use specific data analysis to prove and explore these trends further, as well as their deeper relationships. After performing trend value calculations in Excel, we obtain trend values (TREND) for each year. Then, using the formula Cyclical component (%) = (Real-Trend) / Trend * 100, we can derive cyclical components for all three. At this point, I will divide GDP and Consumption, as well as GDP and Investment, into two groups to study their cyclical relationships with GDP. After performing these calculations, we can obtain the following two-line charts for comparison. Next, I will discuss the cyclical relationships between these two factors and GDP separately:
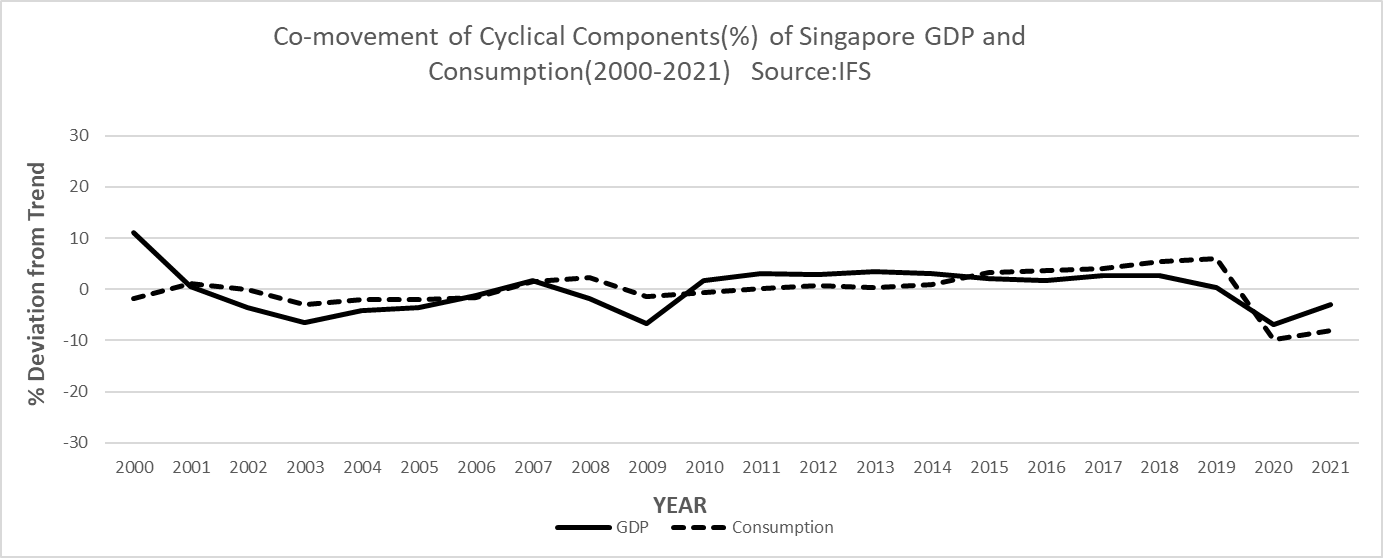
Figure 4: Co-movement of Cyclical Components(%) of Singapore Gross Domestic Product and Consumption(2000-2021)
From this chart, we can observe that the cyclical variation in Singapore's consumption closely aligns with the cyclical changes in Singapore's GDP. The fluctuations are generally small and stable.
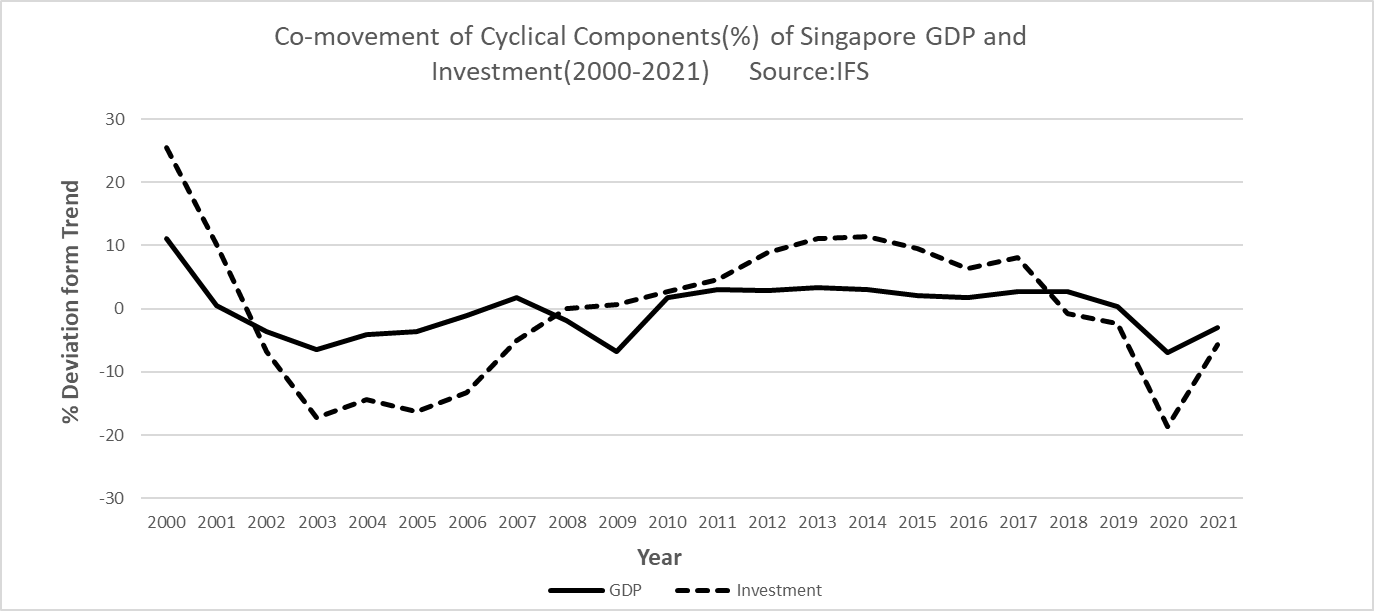
Figure 5: Co-movement of Cyclical Components (%) of Singapore Gross Domestic Product and Investment(2000-2021)
When examining the cyclical changes in GDP and investment over 20 years, it's evident that the fluctuations in investment are much larger compared to consumption. Although the long-term cycles align with GDP, short-term volatility is significant.
Table 2: Standard deviation, Standard deviation ratio and Correlation for Gross domestic product, Consumption, Investment Cyclical components.
% deviation from trend | Standard deviation | SD ratio | Correlation |
GDP | 4.26 | 1 | 1 |
Consumption | 3.81 | 0.89 | 0.48 |
Investment | 11.38 | 2.67 | 0.84 |
Subsequently, I analysed the standard deviation of the cyclical components for GDP, Consumption, and Investment, resulting in the above table.
From the obtained standard deviations, it's clear that the data stability for GDP and Consumption is similar, both relatively low. However, the standard deviation for Investment is 11, indicating high instability and risk. In terms of proportion, the risk ratio for Investment is more than four times that of GDP. To obtain a more accurate correlation, I once again calculated the correlation between GDP and Consumption, as well as GDP and Investment, for their trend cyclical components. The correlation coefficient for GDP and Consumption is 0.48, while for GDP and Investment, it is 0.84. It's important to note that these correlation coefficients do not imply causation but simply indicate how one variable change concerning the other simultaneously. From these two figures, we can see that the correlation between Investment and GDP is stronger than that between Consumption and GDP. This point is particularly noteworthy because the correlation between consumption and GDP in the U.S. is very high. Surprisingly, the correlation between Singapore's consumption and GDP is only 0.48. This suggests that the growth and propulsion of Singapore's GDP might mainly depend on other factors. Unlike the U.S., a major consumption-driven economy, which calculated to be 0.90 by Hu. Pan and his colleagues in 2023 [5]. Singapore might rely more heavily on net exports and investment. As a financial safe haven in East Asia and investing in foreign assets to grow its GDP, Singapore might not focus as much on boosting domestic consumption. I hope more scholars will delve deeper into this topic in the future.
Based on previous data, to more effectively stimulate the economy in the short term, the government should prioritize investment-related policies, as investment can rapidly drive economic changes. However, for sustained and stable long-term growth, the government should lean towards consumption-related policies, given their smoother and more stable co-movement curve.
5. Conclusion
The evolution of GDP as an economic tool, from its inception by Simon Kuznets in 1946 to its present-day applications, demonstrates the essential role it plays in understanding a nation's economic health. This research has underscored a significant gap in the academic discourse - the dearth of detailed trend value analyses of GDP components, especially for export-driven economies like Singapore. Through rigorous data collection from authoritative sources such as IFS and meticulous application of detrending methodologies, we have gained valuable insights into the intricacies of Singapore's GDP composition over a 21-year period.
Our study has unveiled the nuanced interplay between different GDP components, specifically consumption and investment, and their respective influences on the nation's GDP. By employing statistical tools such as standard deviation and correlation, we not only visualized but also quantified the relationships and variations within the data, emphasizing the importance of these variables in shaping Singapore's economic landscape.
Furthermore, this research highlights the significance of countries with a prominent export economy, like Singapore, which remain underrepresented in current academic discussions. Their unique economic compositions and dynamics offer invaluable insights that can't be mirrored by larger, more domestic production-driven nations. Besides, based on my calculations and research, the correlation between Singapore's consumption and GDP is not strong. This indicates that the economic structure of Singapore, a major export powerhouse, is indeed different from that of the U.S. It's a topic that warrants in-depth study, and I hope subsequent scholars can analyze Singapore's economic structure more profoundly.
In essence, the journey from Kuznets' conceptualization of GNP to our contemporary analysis of Singapore's GDP showcases the dynamic nature of economic research and the continual need for adaptation and nuance in our methodologies. As we move forward, it's imperative for academia to broaden its scope, delving deeper into under-explored economies and ensuring that our understanding of global economics is both comprehensive and inclusive. This research serves as a testament to the rich tapestry of insights waiting to be unearthed when we venture beyond the conventional and into the less-traversed terrains of economic study.
References
[1]. Kuznets, S. (1946). National income (p. 144). New York: National Bureau of Economic Research.
[2]. Hogrefe, J. (2008). Forecasting data revisions of GDP: a mixed frequency approach. AStA Advances in Statistical Analysis, 92, 271-296.
[3]. S., Boragan, Aruoba., Francis, X., Diebold., Jeremy, J., Nalewaik., Frank, Schorfheide., Dongho, Song. (2011). Improving GDP measurement: a forecast combination perspective. Research Papers in Economics,
[4]. Schüler, Y. S. (2018). Detrending and financial cycle facts across G7 countries: Mind a spurious medium term!.
[5]. Hu, P., Ji, P., Xu, H., Shi, X., & Wu, Y. (2023, March). US GDP Detrended Analysis. In 2022 3rd International Conference on Big Data Economy and Information Management (BDEIM 2022) (pp. 376-384). Atlantis Press. Data from International Financial Statistics
Cite this article
Xie,Z. (2024). An Analysis on Singapore's Business Cycle. Advances in Economics, Management and Political Sciences,101,136-143.
Data availability
The datasets used and/or analyzed during the current study will be available from the authors upon reasonable request.
Disclaimer/Publisher's Note
The statements, opinions and data contained in all publications are solely those of the individual author(s) and contributor(s) and not of EWA Publishing and/or the editor(s). EWA Publishing and/or the editor(s) disclaim responsibility for any injury to people or property resulting from any ideas, methods, instructions or products referred to in the content.
About volume
Volume title: Proceedings of the 2nd International Conference on Financial Technology and Business Analysis
© 2024 by the author(s). Licensee EWA Publishing, Oxford, UK. This article is an open access article distributed under the terms and
conditions of the Creative Commons Attribution (CC BY) license. Authors who
publish this series agree to the following terms:
1. Authors retain copyright and grant the series right of first publication with the work simultaneously licensed under a Creative Commons
Attribution License that allows others to share the work with an acknowledgment of the work's authorship and initial publication in this
series.
2. Authors are able to enter into separate, additional contractual arrangements for the non-exclusive distribution of the series's published
version of the work (e.g., post it to an institutional repository or publish it in a book), with an acknowledgment of its initial
publication in this series.
3. Authors are permitted and encouraged to post their work online (e.g., in institutional repositories or on their website) prior to and
during the submission process, as it can lead to productive exchanges, as well as earlier and greater citation of published work (See
Open access policy for details).
References
[1]. Kuznets, S. (1946). National income (p. 144). New York: National Bureau of Economic Research.
[2]. Hogrefe, J. (2008). Forecasting data revisions of GDP: a mixed frequency approach. AStA Advances in Statistical Analysis, 92, 271-296.
[3]. S., Boragan, Aruoba., Francis, X., Diebold., Jeremy, J., Nalewaik., Frank, Schorfheide., Dongho, Song. (2011). Improving GDP measurement: a forecast combination perspective. Research Papers in Economics,
[4]. Schüler, Y. S. (2018). Detrending and financial cycle facts across G7 countries: Mind a spurious medium term!.
[5]. Hu, P., Ji, P., Xu, H., Shi, X., & Wu, Y. (2023, March). US GDP Detrended Analysis. In 2022 3rd International Conference on Big Data Economy and Information Management (BDEIM 2022) (pp. 376-384). Atlantis Press. Data from International Financial Statistics