


1. Introduction
In recent decades, the escalating concern over air pollution has reached new heights. According to Fuller and his associates [1], the global toll of air pollution-related fatalities exceeds 6.5 million annually. Among the key culprits, particulate matter (PM), a combination of sulfates, nitrates, carbon, and mineral dust, plays a pivotal role. Notably, PM2.5, the finer particulate matter measuring ≤ 2.5 micrometers, can deeply infiltrate lung tissue, giving rise to severe health complications [2]. Amidst the various contributors to this predicament, vehicle emissions stand out as the primary originators of anthropogenic air pollution [3]. In response, governmental bodies and industries worldwide are increasingly shifting towards new energy vehicles (NEVs). Unlike their conventional fuel counterparts, NEVs offer the advantage of zero exhaust emissions and reduced PM discharge, thereby offering a hopeful avenue for tackling the repercussions of vehicle emissions [4].
1.1. Air Pollution Severity in China
China, as the world’s largest automotive market and one of the major contributors to carbon emissions, has been one of the most severe PM2.5-dominated air pollution countries. According to the Beijing Municipal Ecology and Environment Bureau (BMEEB) report in 2021, motor vehicles and other mobile sources are responsible for up to 46% of local PM2.5 emissions [5]. This alarming statistic underscores the pressing need to investigate and address the impact of the transportation sector on PM2.5 pollution.
1.2. The Prosperity of NEVs in China
In response to environmental concerns, China emphasizes adopting NEVs, particularly electric vehicles (EVs), to combat air pollution. The government prioritizes effective measures, focusing on promoting EVs through infrastructure, policies, and supply encouragement [6]. This approach reflects China's commitment to sustainable transportation, reducing the auto sector's environmental impact for a greener future. However, it is essential to acknowledge that while new energy vehicles present a promising path toward cleaner transportation, they are not entirely devoid of environmental damage. Research conducted by Wang and his colleagues reveals that NEVs’ braking and tire wear contribute 30 percent of PM2.5 emissions, while exhaust emissions from gasoline and diesel vehicles constitute 19 percent [7]. This paradoxical scenario demands a comprehensive examination to ascertain the efficiency of NEV adoption and the intricate relationship between NEV proliferation and air pollution.
1.3. Research Objectives and Methods
To address this paradox, our research utilizes Regression Analysis, Time Series Analysis, and Panel Data Models. We first employ regression to uncover the link between NEV adoption and PM2.5 emissions in representative cities since policy implementation. Subsequently, Panel Data Models summarize the nationwide relationship between these variables.
We leverage diverse traffic and air datasets, including daily PM2.5 emissions from the Ecological Environment Bureau, NEV inventory data, market share, and charging infrastructure information. These datasets elucidate variable relationships.
Our primary objective is to analyze China's NEV adoption's correlation with air quality. By doing so, we contribute to combating climate change and fostering a greener future. While extensive literature explores NEV adoption's impact globally, our research specifically examines the emerging NEV industry's effect on PM2.5 in China—a nation grappling with PM2.5 pollution and recent NEV development. Our insights offer a valuable gauge of e-mobility's efficacy for sustainable development in China.
The remainder of this proposal is structured as follows: Section 2 offers a deeper insight into several interconnected literature strands. In Section 3, a conceptual framework explains our research rationale, mathematical formula, and confounding factors. Section 4 presents data sources and summary statistics, while Section 5 outlines our employed methodologies. The conclusion in Section 6 outlines the next steps in our research plan.
2. Literature Review
New energy vehicles (NEVs) present the possibility of concurrent advantages for air quality improvement and addressing climate change. Hence, China has implemented policies incentivizing the use of new energy vehicles. Academic studies pertaining to electric vehicles have experienced a substantial surge in the present decade. We conducted a systematic exploration on Google Scholar, utilizing the subsequent keywords: “new energy vehicles," "environment," "air pollution," and "air quality. " No specific time limits were placed on the publication years of the studies, although we have a preference for citing more recent ones.
The existing body of literature encompasses diverse methodologies for model development and data analysis, highlighting China's unique policy frameworks and ecosystems. Acknowledging the nonlinear nature of air pollution chemistry, it remains uncertain to what degree NEVs could offer mitigation, particularly in severe air pollution events. Therefore, much remains unknown with regard to NEVs’ mitigation potential. After comparing various models discussed in the literature, we have determined that our study will employ time series analysis, regression analysis, and panel data modeling to investigate the relationship between PM2.5 levels and the proportion of NEV in four distinct Chinese cities over the period spanning from 2015 to 2022.
2.1. Impacts of air quality on human health
Air quality exerts a significant impact on human health. Bernstein and his colleagues found that outdoor pollutants, whether in gaseous or particulate form, can potentially exacerbate or intensify the underlying pathophysiological conditions affecting the upper and lower airways [8]. To combat air pollution, the main contribution must be found first. As mentioned in the introduction part 3, mobile sources account for 46% of local emissions in Beijing [9]. Promoting NEV cars is the best approach to improving local air quality.
2.2. EV car adoption and air quality
Cities in China have suffered from severe air pollution due to the fast industrialization and spread of private cars. Therefore, the Chinese government has launched many policies to reduce carbon emissions from cars and improve air quality. For example, Hu and other scholars stated that Shanghai commenced the issuance of license plates for private vehicles through auctions in 1994 [10]. Also, During the 2008 Olympic Games, Beijing implemented driving restrictions. Vehicles were allowed to drive every other day. People end up buying two cars with different plate numbers so that they always have one vehicle available at hand. In the long run, only restrictions will not change the status quo and improve the air quality.
The adoption of NEV cars can reduce traffic-related emissions more effectively. For example, in one research by John Brady in 2011, Brady and his colleagues assessed the possible decrease in emissions from road traffic associated with commuting in the Greater Dublin Area, considering various scenarios of electric vehicle market penetration. Results showed that an additional 8% decrease is evident for both PM2.5 and PM10 pollutants [11]. Our aim is to use a similar principle, as Brady and his co-workers did, to evaluate the effectiveness of NEV car adoption in cities in China. Our findings are important for understanding the potential effects of NEV on air quality and can provide useful information to local governments for use in air pollution control strategies.
2.3. Method
First, we choose PM2.5 as an indicator of air quality based on the analysis of past research on the short-term effects of PM2.5 and PM10. N.A.H. Janssen et al. found that the strong correlation (R = 0.95) between PM10 and PM2.5 concentrations arises from the shared emission sources, primarily mobile sources and agricultural activities. This significant correlation between the two particulate measures could pose challenges when attempting to decipher the distinct contributions of these fractions in subsequent statistical investigations [12]. Therefore, to avoid repetitiveness in our research, we decided to include the concentration of PM 2.5 as the only air quality indicator.
In addition, models of past research provided us with useful insights about choosing the most suitable analysis method. For example, Brady et al. and Hu et al. used the COPERT model to simulate the reduction effects under different scenarios. This is the most commonly used model and has mature, standardized methods. This is a good model because it is comprehensive. COPERT Model can be easily adapted to most regions and countries, no matter what geographical contexts it has. This benefit is good for our research because we are also analyzing four cities in China that are different. In contrast, Yu et al. used a different model called the CALPUFF dispersion model [13]. This is a relatively complex model and requires detailed emission inventories, land-use data, and meteorological information. Therefore, we do not plan to use these two models in our own research. However, we can use this model to improve the accuracy of our research results if we can obtain a larger data sample in the future.
Past research reminded us of the importance of comparing the air quality of different cities and regions. Both Li et al. and Liu et al. choose different cities and regions to compare the reduction of CO2 and PM2.5. Nan Li et al.’s research showed that significant decreases were more likely to happen during periods and locations with elevated ambient concentrations and in instances of heightened pollution events [14]. By analyzing the trends of various Chinese cities that have huge differences from each other, we can get a more general conclusion about our research topic. Therefore, our research should not only analyze the trend in Shanghai but also include other types of cities in China, including Dalian in northern China, Chongqing in central China, and Shenzhen in southern China.
2.4. Objections
In contrast, there is undeniable evidence regarding the significant environmental consequences of non-exhaust emissions. Some researchers argue that the heavy mass of battery in NEV cars accelerate tire aging. Tire wear contributes to air quality degradation by releasing particulate matter, specifically microplastics and airborne particles, into the atmosphere. Air quality assessments across Europe have indicated that the combined contribution of non-exhaust emissions (from tire wear and resuspension) to PM10 is comparable to that of tailpipe emissions. Undoubtedly, substantial quantities of TRWP (Tire and road wear particles) are released into the environment yearly [15]. In addition, Ketzel and other colleagues estimated that in various European countries, a significant portion (approximately 50–85%, depending on the location) of the total PM10 emissions from traffic is attributed to non-exhaust sources. Furthermore, the absence of measures to control non-exhaust emissions has resulted in their growing contribution to the overall PM air quality in these regions. Nevertheless, the extent of ecotoxicological effects remains unclear because most research studies have utilized artificially generated tire wear particles, which differ from real-world TRWP [16]. In just a single study, a toxicological threshold value was established (NOAEC: 112 μg/m3 for respirable TRWP). According to the findings from this risk assessment, the potential risk for human health, particularly in relation to cardiopulmonary effects, is considered to be low [17].
2.5. Creativity and uniqueness of our research
First of all, four cities situated in diverse geological locations and characterized by varying degrees of industrialization have been chosen for the research to minimize the influence of additional variables that affect urban air quality. These cities—Shanghai, Dalian, Shenzhen, and Chongqing—exhibit contrasting levels of industrialization, population size, energy-resource compositions, and geological settings. If the study outcomes reveal a consistent pattern among these four cities when investigating the connection between the adoption of NEVs and urban air quality, it becomes reasonable to infer that the enhancement of air quality is predominantly attributed to the adoption of NEVs. Also, the study uses the most up-to-date data to ensure congruence with the substantial advancements in New Energy Vehicles (NEVs). Finally, we utilize PM2.5 as the singular air quality indicator to streamline the model while maintaining the validity of the conclusion.
3. Conceptual Framework
The research is based on the theory that increased adoption of NEVs can lead to reduced emissions of air pollutants, particularly PM2.5, due to the lower emissions associated with new energy vehicles compared to conventional internal combustion engine vehicles.
3.1. Significance of Investigating Transportation
Figure 1: Sources of Atmospheric PM2.5 in Beijing.
PM2.5 is primarily generated by anthropogenic activities, including industrial processes, residential heating, and transportation emissions. Among these sources, the transportation sector significantly contributes to PM2.5 levels, releasing particulate matter, nitrogen oxides (NOx), and volatile organic compounds (VOCs) through fossil fuel combustion. As depicted in Figure 1, nearly 60% of the major sources of PM2.5 in Beijing in 2021 were attributed to local emissions, with the transportation sector accounting for a substantial 46% share.
Therefore, the investigation of transportation is important in the context of PM2.5 reduction. Urban road traffic, in particular, is a prominent source of PM2.5 in urban areas, and the escalating number of vehicles has exacerbated air pollution challenges. By exploring the impact of China's new energy vehicle adoption on urban air quality, this research unveils the potential of electric mobility in mitigating transportation-related PM2.5 emissions.
3.2. The Effect of NEV Adoption on Air Pollution:
We plan to utilize a simple linear regression model. Our analysis posits that PM2.5 annual average concentration Yit in the given city i during year t can be expressed as:
\( Yit=bXit+a… \) \( (1) \)
Xit represents the extent of NEV adoption, specifically, the growth rate of the market share occupied by new energy vehicles. “a” is the sum impact of other influential elements. The parameter “b” delineates the slope of the line, which is the sought-after value, and is theoretically calculated as:
\( b=\frac{Σ(X-X)-(Y-Y)}{Σ{(X-X)^{2}}}… \) \( (2) \)
3.3. Navigating Potential Confounding Factor:
a. Weather Conditions: While weather can influence short-term variations in PM2.5 levels, this research focuses on annual average concentrations. As such, weather conditions within a year would not be a confounding variable. Moreover, any weather-related variations will be appropriately accounted for in the statistical analysis.
b. Industrial Emissions: Although industrial emissions significantly contribute to PM2.5 pollution, their influence is more pronounced in suburban areas and is not a primary concern for our investigation of urban air quality.
c. Residential Heating: Residential heating is considered the second largest source of PM2.5 pollution, accounting for 16 percent of emissions. However, its contribution to PM2.5 emissions is relatively continuous and stable and will not have a great impact on the relationship we want to find.
d. Other Sources: The remaining sources, such as dust generation and coal combustion, are not considered confounding factors in this study due to their stable nature during the period under investigation. No significant changes, controls, or policies were implemented that would alter their contributions to urban air quality. Consequently, the impact of these sources on the relationship between NEV adoption and urban air quality is expected to be minimal. It will not significantly affect the primary focus of our research.
In summary, the potential influencers listed above are unlikely to exert a significant impact on our study. Nonetheless, we will diligently account for them within our formula, as symbolized by "a" in the regression equation, while considering other factors such as humidity, wind speeds, and temperature. Our ongoing research will uncover more refined quantitative methods to calculate the influencing factors.
4. Data
Our research methodology is unfolding in a meticulously planned tripartite sequence. We aim to investigate the relationship between China's new energy vehicle (NEV) adoption and its effects on air quality, with a specific focus on PM2.5 levels in four prominent cities: Shanghai, Shenzhen, Chongqing, and Dalian.
Presently, we amass data from Shanghai as an illustrative case and subsequently engage in comprehensive analysis, as shown in Table 1. It is embarking on the comprehensive collection of requisite data pertaining to the proportion of NEV adoption and concurrent air quality metrics in Shanghai from 2015 to 2022. As a bedrock of empirical inquiry, we are drawing upon authoritative sources, including the Shanghai Environmental Protection Bureau (SEPB) and the esteemed Shanghai Statistical Yearbook (SSY), renowned repositories that underpin the foundation of our investigation. Also, we initiate email correspondence with the National Environmental Protection Bureau or pertinent organizations to facilitate the acquisition of the requisite meteorological data.
There are two reasons for selecting these four cities as research samples. First is data accessibility and availability. These cities are major economic and technological hubs, likely having well-developed data collection systems and government databases. Access to comprehensive and reliable data on EV sales, charging infrastructure, consumer preferences, and policy impacts is crucial for accurate market analysis and informed decision-making. Second is the diversity of cities. Shanghai, Shenzhen, Chongqing, and Dalian represent a diverse range of urban landscapes, socio-economic conditions, and demographic profiles. Studying these cities allows examining how different populations and urban structures interact with and adopt EV technology. This diversity provides valuable insights into the potential scalability and adaptability of EV adoption strategies across a spectrum of city types within China.
We are traversing the terrain of statistical analysis, endeavoring to unearth the inherent correlation between the two variables—NEV adoption proportion and air quality. This pivotal phase of our research calls upon the judicious application of statistical tools, particularly Pearson's correlation coefficient, to quantify and delineate the relationship underpinning these intricate dynamics.
The culmination of our research expedition is unfolding through the discerning lens of correlation evaluation and causal inference. Within this ambit, we meticulously scrutinize the established correlation, mindful that correlation does not imply causation. Our scholarly commitment is propelling us to traverse beyond mere statistics. Drawing insights from established research, including contributions from the China Automotive Energy Research Center (CAERC) and the deliberations of environmental NGOs such as Greenpeace (Greenpeace), we aim to unfurl plausible reasons underpinning the observed correlation. This deliberation encapsulates multifarious factors, encompassing governmental policies, socio-economic influences, and technological trajectories.
Table 1: Data on PM2.5 Concentration (μg/m³), EV Car Sales, and EV Car Market Share (%) in Shanghai from 2015-2022.
Year | PM2.5 Concentration (μg/m³) | EV Car Sales | EV Car Market Share (%) |
2015 | 54 | 4.43 | 1.3 |
2016 | 45 | 4.51 | 1.4 |
2017 | 39 | 6.13 | 1.7 |
2018 | 36 | 24 | 4.7 |
2019 | 35 | 30 | 7.2 |
2020 | 32 | 42.4 | 9.6 |
2021 | 27 | 67.7 | 15.2 |
2022 | 25 | 94.5 | 19.81 |
5. Method
5.1. Brief Introduction
In this section, we delineate the methodology employed to investigate the correlation between the adoption level of NEV and PM2.5 concentration. We leverage three analytical approaches: time series analysis, regression analysis, and panel data modeling. Our analysis posits that the annual average PM2.5 concentration, denoted as Yit, in a specific city i during year t is influenced by the extent of NEV adoption, represented by the growth rate of the market share occupied by NEV (Xit). The relationship is postulated as follows:
\( Yit=bXit+a… \) \( (3) \)
Where Yit represents the PM2.5 annual concentration in city i during year t. Xit signifies the extent of NEV adoption, specifically the NEV car sales and the rate of NEV car market share. "a" represents the combined impact of other influential elements. "b" denotes the slope of the relationship, a value of particular interest. We will detail the steps of our research using the following methodologies: time series analysis, regression analysis, and panel data modeling.
5.2. Time Series Analysis
Time series analysis enables us to uncover temporal patterns and trends within the dataset. We will collect longitudinal data on NEV adoption levels and PM2.5 concentrations from 2015 to 2022 in multiple Chinese cities. Our time series analysis examines the trends and periodicity in both variables. By applying statistical techniques such as decomposition, autocorrelation, and moving averages, we aim to identify any inherent patterns and variations within the time series data.
5.3. Regression Analysis
Regression analysis is a fundamental tool to examine the relationship between variables. In our study, we will perform regression analysis to quantify the relationship between NEV adoption levels and PM2.5 concentrations. The regression equation is expressed as Yit = bXit + a. We will use statistical software to estimate the values of "a" and "b" based on the collected data. The coefficient "b" signifies the magnitude and direction of the impact of NEV adoption on PM2.5 concentrations, while "a" represents the intercept, accounting for other influential factors.
5.4. Panel Data Modeling
Considering the inherent variability across different regions, panel data modeling is employed to account for unobserved heterogeneity. We will assemble a panel dataset, including cross-sectional data from multiple cities over the years. This approach allows us to control for time-invariant and city-specific effects that could influence the relationship between NEV adoption and PM2.5 concentrations. By utilizing advanced panel data techniques such as fixed-effects and random-effects models, we aim to provide a comprehensive estimation of the impact of NEV adoption on PM2.5 concentrations while accounting for regional disparities.
5.5. Summary and Charts
Our research employs time series analysis, regression analysis, and panel data modeling to investigate the relationship between NEV adoption and PM2.5 concentrations. By employing these methodologies, we aim to elucidate the intricate interplay between these variables and contribute substantiated insights to the ongoing discourse on sustainable transportation policies and environmental quality improvement. Figure 2 shows the simple linear relationship between EV car sales and PM2.5 concentration in Shanghai in recent years. Figure 3 shows the simple linear relationship between the EV car market shares and PM2.5 concentration in Shanghai in recent years.
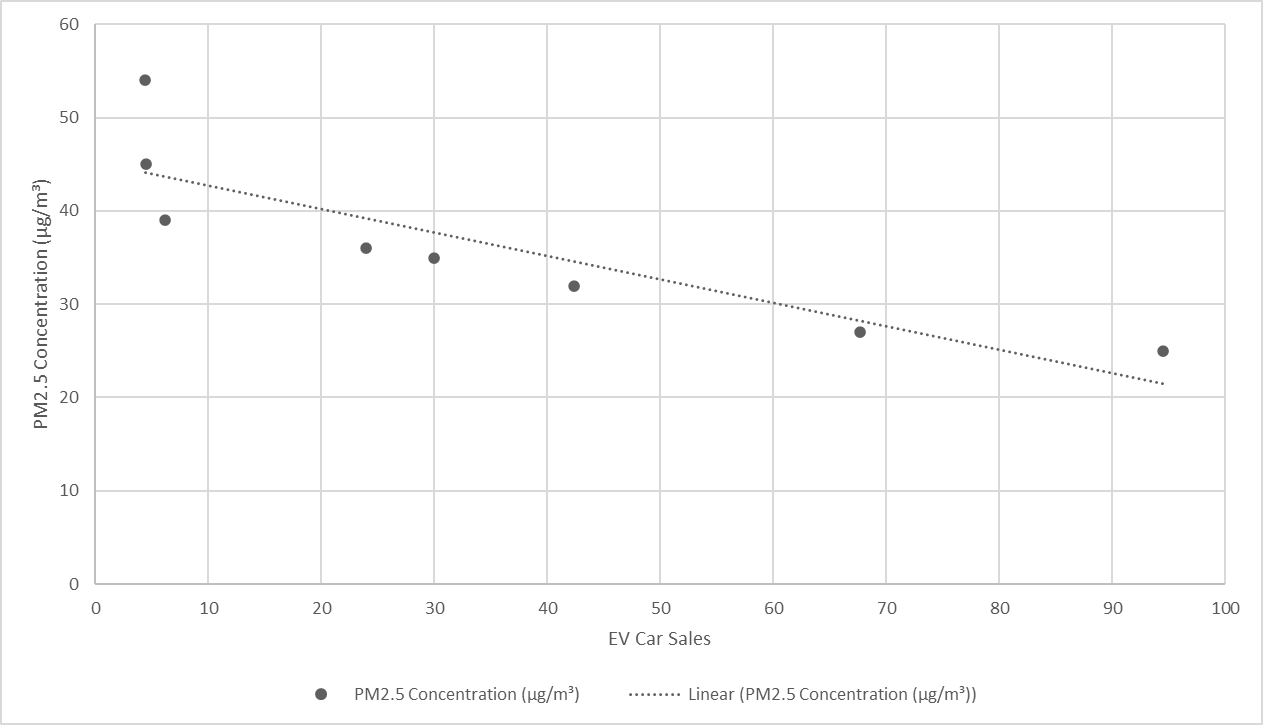
Figure 2: Simple Linear Regression of EV car sales and PM2.5 Concentration (μg/m³) in Shanghai from 2015-2022.
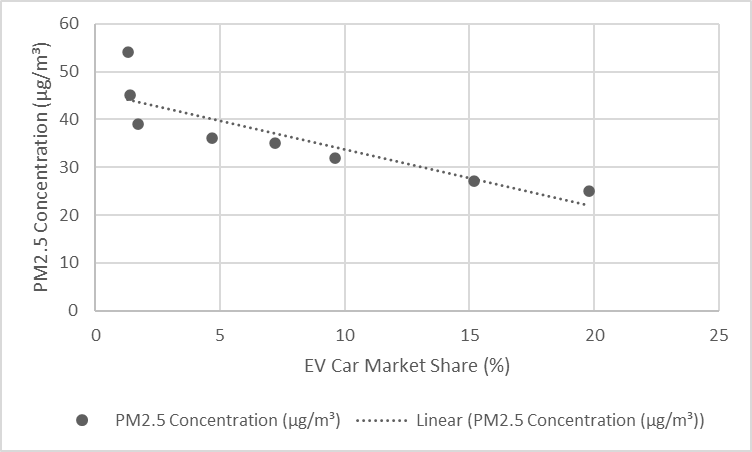
Figure 3: Linear Regression of EV Car Market Share (%) and PM2.5 Concentration (μg/m³) in Shanghai from 2015-2022.
6. Conclusion
Our research investigates the connection between the adoption level of new energy vehicles (NEVs) and PM2.5 concentration. Through this exploration, we aim to provide evidence-based perspectives on the impact of electric vehicle adoption in mitigating climate change and enhancing air quality within four prominent Chinese cities. This analysis holds the potential to guide policymakers in formulating novel strategies for NEV adoption, thereby contributing to addressing climate change and fostering a greener societal framework.
We extensively examined the existing body of literature concerning the air quality and public health benefits associated with new energy vehicles. Our approach involved the organization and evaluation of this literature, combining qualitative and quantitative evidence. Employing techniques such as time series analysis, regression analysis, and panel data modeling, we investigated the relationship between PM2.5 levels and the proportion of new energy vehicles from 2010 to 2020 across four diverse cities in China. Initially, we gathered PM2.5 concentration data from reports published by the Municipal Ecology and Environment Bureau. Subsequently, PM2.5 was chosen as the exclusive indicator of air quality. By conducting regression analysis between these two datasets, we derived projections indicating the evolving efficacy of NEV adoption in mitigating climate change. The data analysis findings for Shanghai revealed a notably strong positive correlation between PM2.5 concentration and the market share of NEV cars (R=0.97). Similar correlations were also expected to be observed in the study outcomes for Dalian, Shenzhen, and Chongqing.
One potential limitation of our study is the absence of an examination of the influence of other meteorological conditions that could impact air quality. For instance, humidity, wind speeds, and temperature stand as crucial factors in air quality determination. It's worth noting that various factors beyond the adoption of NEV cars could give rise to notable fluctuations in PM2.5 concentration.
Given the availability of more reliable and high-quality data in the future, it would be prudent to refine our model in alignment with the COPERT model. This enhancement would facilitate a more comprehensive analysis by incorporating additional meteorological factors.
Acknowledgement
Xiangyi Zeng and Jiaming Liu contributed equally to this work and should be considered co-first authors.
References
[1]. Fuller, R. (2022). Pollution and health: A progress update - the lancet. Pollution and health. https://www.thelancet.com/journals/lanplh/article/PIIS2542-5196(22)00090-0/fulltext.
[2]. U.S. Department of Health and Human Services. (2022). Air pollution and your health. Institute of Environmental Health Sciences. https://www.niehs.nih.gov/health/topics/agents/air-pollution/index.cfm.
[3]. National Toxicology Program. (2019). NTP Monograph on the Systematic Review of Traffic-Related Air Pollution and Hypertensive Disorders of Pregnancy. https://doi.org/10.22427/ntp-mgraph-7.
[4]. U.S. Department of Energy. (2022). All-electric vehicles. Alternative Fuels Data Center: All-Electric Vehicles. https://afdc.energy.gov/vehicles/electric_basics_ev.html#:~:text=Although%20electricity%20production%20may%20contribute,direct%20exhaust%20or%20tailpipe%20emissions.
[5]. Beijing Municipal Ecology and Environment Bureau. (2021). The third round of source analysis of PM2.5 in Beijing. http://sthjj.beijing.gov.cn/bjhrb/index/xxgk69/zfxxgk43/fdzdgknr2/ywdt28/xwfb/21219955/index.html
[6]. State Concil of the People's Republic of China. (2023). A series of new energy vehicle policies issued by The State Council. https://www.gov.cn/zhengce/202306/content_6888250.htm.
[7]. Wang, X., Gronstal, S., Lopez, B., Jung, H., Chen, L. W. A., Wu, G., Ho, S. S., Chow, J. C., Watson, J. G., Yao, Q., & Yoon, S. (2023). Evidence of non-tailpipe emission contributions to PM2.5 and PM10 near Southern California Highways. Environmental Pollution, 317, 120691. https://doi.org/10.1016/j.envpol.2022.120691.
[8]. Bernstein, J. A., Alexis, N., Barnes, C., Bernstein, I. L., Nel, A., Peden, D., Diaz-Sanchez, D., Tarlo, S. M., & Williams, P. B. (2004). Health effects of air pollution. Journal of Allergy and Clinical Immunology, 114(5), 1116-1123. https://doi.org/10.1016/j.jaci.2004.08.030.
[9]. BMEEB. (2021). Beijing Municipal Ecology and Environment Bureau. http://sthjj.beijing.gov.cn/bjhrb/index/xxgk69/zfxxgk43/fdzdgknr2/ywdt28/xwfb/21219955/index.html
[10]. Hu, X. et al. (2021) ‘The potential impacts of electric vehicles on urban air quality in Shanghai City’, Sustainability, Basel Vol.13, Iss. 2
[11]. Brady, J. and O’Mahony, M. (2011) ‘Travel to work in Dublin. the potential impacts of electric vehicles on climate change and Urban Air Quality’, Transportation Research Part D: Transport and Environment, 16(2), pp. 188–193.
[12]. Baensch-Baltruschat, B. et al. (2020) ‘Tyre and road wear particles (TRWP) - a review of generation, properties, emissions, human health risk, ecotoxicity, and fate in the environment’, Science of The Total Environment, Volume 16, Issue 2, March 2011, Pages 188-193
[13]. Yu, H. & Stuart, A. L. (2017). Impacts of compact growth and electric vehicles on future air quality and urban exposures may be mixed. Science of The Total Environment, Volume 576, 15 January 2017, Pages 148-158
[14]. Li, N., Chen, J. P., Tsai, I. C., He, Q. Chi, S. Y., Lin, Y. C., & Fu, T. M. (2016). Potential impacts of electric vehicles on air quality in Taiwan. Science of The Total Environment, 566–567, Pages 919-928
[15]. Amato, F., Cassee, F. R., Denier van der Gon, H. A. C., Gehrig, R., Gustafsson, M., Hafner, W., Harrison, R. M., Jozwicks, M., Kelly., F. J., Moreno, T., Prevot, A. S. H., Schaap, M., Sunyer, J., & Querol, X. (2014). Urban Air Quality: The challenge of traffic non-exhaust emissions. Journal of Hazardous Materials, 275, 31–36.
[16]. Greenpeace. (2015). Together we can change the world. https://www.greenpeace.org/.
[17]. Hu, X., Chen, N., Wu, N., & Yin, B. (2021). The potential impacts of electric vehicles on urban air quality in Shanghai City. Sustainability, 13(2), p. 496. doi:10.3390/su13020496.
Cite this article
Zeng,X.;Liu,J.;Chen,G. (2024). The Impact of China's New Energy Vehicle Adoption on Urban PM2.5 Levels. Advances in Economics, Management and Political Sciences,101,41-51.
Data availability
The datasets used and/or analyzed during the current study will be available from the authors upon reasonable request.
Disclaimer/Publisher's Note
The statements, opinions and data contained in all publications are solely those of the individual author(s) and contributor(s) and not of EWA Publishing and/or the editor(s). EWA Publishing and/or the editor(s) disclaim responsibility for any injury to people or property resulting from any ideas, methods, instructions or products referred to in the content.
About volume
Volume title: Proceedings of the 2nd International Conference on Financial Technology and Business Analysis
© 2024 by the author(s). Licensee EWA Publishing, Oxford, UK. This article is an open access article distributed under the terms and
conditions of the Creative Commons Attribution (CC BY) license. Authors who
publish this series agree to the following terms:
1. Authors retain copyright and grant the series right of first publication with the work simultaneously licensed under a Creative Commons
Attribution License that allows others to share the work with an acknowledgment of the work's authorship and initial publication in this
series.
2. Authors are able to enter into separate, additional contractual arrangements for the non-exclusive distribution of the series's published
version of the work (e.g., post it to an institutional repository or publish it in a book), with an acknowledgment of its initial
publication in this series.
3. Authors are permitted and encouraged to post their work online (e.g., in institutional repositories or on their website) prior to and
during the submission process, as it can lead to productive exchanges, as well as earlier and greater citation of published work (See
Open access policy for details).
References
[1]. Fuller, R. (2022). Pollution and health: A progress update - the lancet. Pollution and health. https://www.thelancet.com/journals/lanplh/article/PIIS2542-5196(22)00090-0/fulltext.
[2]. U.S. Department of Health and Human Services. (2022). Air pollution and your health. Institute of Environmental Health Sciences. https://www.niehs.nih.gov/health/topics/agents/air-pollution/index.cfm.
[3]. National Toxicology Program. (2019). NTP Monograph on the Systematic Review of Traffic-Related Air Pollution and Hypertensive Disorders of Pregnancy. https://doi.org/10.22427/ntp-mgraph-7.
[4]. U.S. Department of Energy. (2022). All-electric vehicles. Alternative Fuels Data Center: All-Electric Vehicles. https://afdc.energy.gov/vehicles/electric_basics_ev.html#:~:text=Although%20electricity%20production%20may%20contribute,direct%20exhaust%20or%20tailpipe%20emissions.
[5]. Beijing Municipal Ecology and Environment Bureau. (2021). The third round of source analysis of PM2.5 in Beijing. http://sthjj.beijing.gov.cn/bjhrb/index/xxgk69/zfxxgk43/fdzdgknr2/ywdt28/xwfb/21219955/index.html
[6]. State Concil of the People's Republic of China. (2023). A series of new energy vehicle policies issued by The State Council. https://www.gov.cn/zhengce/202306/content_6888250.htm.
[7]. Wang, X., Gronstal, S., Lopez, B., Jung, H., Chen, L. W. A., Wu, G., Ho, S. S., Chow, J. C., Watson, J. G., Yao, Q., & Yoon, S. (2023). Evidence of non-tailpipe emission contributions to PM2.5 and PM10 near Southern California Highways. Environmental Pollution, 317, 120691. https://doi.org/10.1016/j.envpol.2022.120691.
[8]. Bernstein, J. A., Alexis, N., Barnes, C., Bernstein, I. L., Nel, A., Peden, D., Diaz-Sanchez, D., Tarlo, S. M., & Williams, P. B. (2004). Health effects of air pollution. Journal of Allergy and Clinical Immunology, 114(5), 1116-1123. https://doi.org/10.1016/j.jaci.2004.08.030.
[9]. BMEEB. (2021). Beijing Municipal Ecology and Environment Bureau. http://sthjj.beijing.gov.cn/bjhrb/index/xxgk69/zfxxgk43/fdzdgknr2/ywdt28/xwfb/21219955/index.html
[10]. Hu, X. et al. (2021) ‘The potential impacts of electric vehicles on urban air quality in Shanghai City’, Sustainability, Basel Vol.13, Iss. 2
[11]. Brady, J. and O’Mahony, M. (2011) ‘Travel to work in Dublin. the potential impacts of electric vehicles on climate change and Urban Air Quality’, Transportation Research Part D: Transport and Environment, 16(2), pp. 188–193.
[12]. Baensch-Baltruschat, B. et al. (2020) ‘Tyre and road wear particles (TRWP) - a review of generation, properties, emissions, human health risk, ecotoxicity, and fate in the environment’, Science of The Total Environment, Volume 16, Issue 2, March 2011, Pages 188-193
[13]. Yu, H. & Stuart, A. L. (2017). Impacts of compact growth and electric vehicles on future air quality and urban exposures may be mixed. Science of The Total Environment, Volume 576, 15 January 2017, Pages 148-158
[14]. Li, N., Chen, J. P., Tsai, I. C., He, Q. Chi, S. Y., Lin, Y. C., & Fu, T. M. (2016). Potential impacts of electric vehicles on air quality in Taiwan. Science of The Total Environment, 566–567, Pages 919-928
[15]. Amato, F., Cassee, F. R., Denier van der Gon, H. A. C., Gehrig, R., Gustafsson, M., Hafner, W., Harrison, R. M., Jozwicks, M., Kelly., F. J., Moreno, T., Prevot, A. S. H., Schaap, M., Sunyer, J., & Querol, X. (2014). Urban Air Quality: The challenge of traffic non-exhaust emissions. Journal of Hazardous Materials, 275, 31–36.
[16]. Greenpeace. (2015). Together we can change the world. https://www.greenpeace.org/.
[17]. Hu, X., Chen, N., Wu, N., & Yin, B. (2021). The potential impacts of electric vehicles on urban air quality in Shanghai City. Sustainability, 13(2), p. 496. doi:10.3390/su13020496.